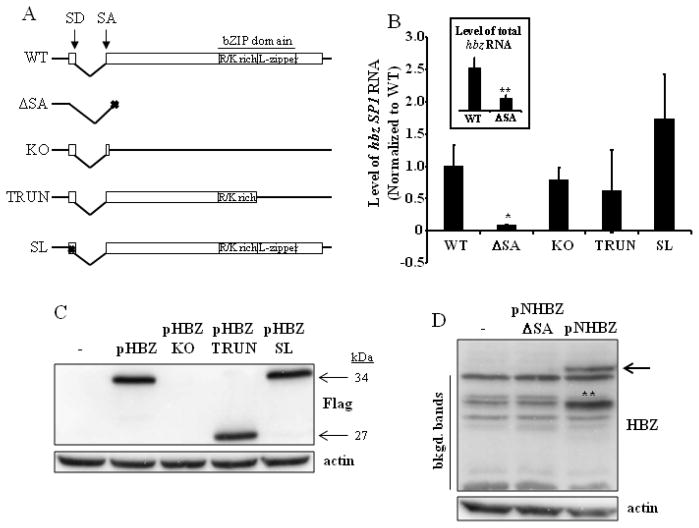
Fig. 2. Analysis of the hbz mRNA transcript and HBZ protein.
(A) Schematic representation of wild-type HBZ (WT), with its splice donor (SD) and acceptor (SA) sites and bZIP domain indicated. The four HBZ mutants generated for this study are also depicted. These mutants were made in the context of the pACH proviral clone. ΔSA, splice-deficient mutant; KO, knockout mutant; TRUN, truncation mutant; SL, stem-loop mutant. (B) 293T cells were transfected with the pACH.HBZ-WT or mutant plasmids. Total RNA was isolated 96h post-transfection, and the hbz SP1 mRNA amplified by real-time RT-PCR using primers shown in Fig. 1. Background values were subtracted and data normalized to WT. GAPDH was amplified as an internal control, and did not differ significantly between samples. These results represent an average of at least three independent experiments. Inset, total hbz mRNA was amplified by real-time RT-PCR using the primers within exon 2 of the hbz gene shown in Fig. 1. Background values were subtracted and data normalized to WT (ΔSA value is 0.31). Student’s two-tailed t tests were performed to determine significant differences between samples (*, P < 0.05; **, P < 0.01). (C) 293T cells were transfected with pHBZ1 (pHBZ) or mutant HBZ expression plasmids. Western blot analysis was carried out to show HBZ-flag expression from these plasmids, using anti-Flag antibody. The size of the proteins are indicated to the right of the blot. Detection of actin was carried out as a loading control. (D) 293T cells were transfected with pNHBZ or pNHBZ-ΔSA expression plasmids. Western blot analysis was carried out to show HBZ expression (arrow) from these plasmids, using anti-HBZ antibody. Detection of actin was carried out as a loading control. The background bands (bkgd. bands) are indicated to the left of the blot. **, the intensity of this band (as compared to the others) is probably due to protein degradation. It cannot represent an HBZ protein translated using an internal ATG, since there is no start site that would produce a protein of that size.

