

Abstract
Fat suppression is important but challenging in balanced steady-state free precession (bSSFP) acquisitions, for a number of clinical applications. In the present work, the practicality of performing fat-water selective excitations using spatial-spectral (SPSP) RF pulses in bSSFP sequence is examined. With careful pulse design, the overall duration of these SPSP pulses was kept short to minimize detrimental effects on TR, scan time and banding artifact content. Fat-water selective excitation using SPSP pulses was demonstrated in both phantom and human bSSFP imaging at 3T, and compared to results obtained using a two-point Dixon method. The sequence with SPSP pulses performed better than the two-point Dixon method, in terms of scan time and suppression performance. Overall, it is concluded here that SPSP RF pulses do represent a viable option for fat-suppressed bSSFP imaging.
Keywords: balanced steady-state free precession, spatial-spectral pulse, fat-water suppression, Dixon method
INTRODUCTION
Balanced steady-state free precession (bSSFP) is a fast imaging sequence with high signal-to-noise ratio efficiency, which makes it attractive for clinical applications. Images obtained with bSSFP sequences often feature bright fat signals due to the inherently-higher T2/T1 value of fat compared to that of water [1], exacerbating the need for fat suppression. Some potential options for fat suppression in bSSFP imaging are the use of spectrally selective RF presaturation pulses [2] or other magnetization preparation approaches [3-4]. Spectrally selective RF pulses are relatively long (e.g. 4 ms at 3T or 8 ms at 1.5T when a Gaussian type pulse is used) and, with the addition of a spoiler gradient pulse to dephase fat signals, can significantly increase scan time if pulses are applied every TR. Applying such preparation block only once every several TRs (instead of every TR) would not significantly increase scan time [3-4], but may affect the steady-state signal and can cause transient artifacts.
In recent years, much emphasis has been placed on adapting the fat-water separation method first introduced by Dixon [5] to short-TR sequences such as bSSFP [6-9]. While very effective, these approaches require at least two (and typically three) acquisitions with different TE settings, essentially doubling or tripling scan time. Relatively complicated separation algorithms are typically employed at the reconstruction stage, to generate the final fat-only and water-only images. Other fat suppression methods that have been applied for bSSFP imaging create a stopband around the fat-resonance [10-13] or modulate fat signal in temporal domain [14]. However, these methods suffer from similar problems as those encountered with the Dixon method, i.e., the need for multiple acquisitions and/or specialized post-processing.
The phase detection method [15] uses the phase of the complex data to separate water and fat, and is of interest because it requires a single dataset and therefore does not increase scan time. However, along with the inconvenience of complex data manipulation, it does have some weaknesses not shared by the present method: There are field-dependent constraints on the value selected for TR, and the method may fail whenever both water and fat are found in a same voxel. The phase induced by spatially-varying coil sensitivities can also prove a limiting issue.
Another option, employing spatial-spectral (SPSP) pulses [16], has been widely employed for fat suppression in longer-TR sequences such as EPI [17], but not with the short-TR bSSFP sequence. SPSP pulses combine both spatial and spectral selectivity, and are compatible with 2D as well as 3D imaging. Compared to multiple-acquisition techniques such as the Dixon method, SPSP pulses have the valuable advantage of requiring only a single acquisition to obtain either a fat-only image or a water-only image. Furthermore, SPSP pulses do not involve any specialized reconstruction algorithm, do not prolong TR as much as using selective presaturation pulses (which employ both an RF pulse and a spoiler gradient pulse, rather than only an RF pulse), and tend to be less sensitive to B1 inhomogeneities than spectrally selective presaturation pulses [18]. Despite these advantages, SPSP pulses are not currently used for fat suppression in bSSFP imaging (with the exception of the binomial RF pulse [19]). A probable explanation is the stringent requirement for an extremely short TR (usually shorter than 5 ms) to minimize the so-called ‘dark-band’ artifacts in bSSFP images, caused by off-resonance spins. The longer duration of SPSP pulses compared to normal slice-selective RF pulses leads to an increase in the minimum TE and TR values that can be achieved.
In this study, we demonstrate that through careful SPSP pulse design, TR can be kept short enough for bSSFP imaging, and that robust fat-water separation can be achieved at 3T. The results presented here feature successful suppression of fat (or water), to achieve water-only (or fat-only) images, both in phantom and in vivo. Results obtained with SPSP pulses are compared with results obtained with the two-point Dixon method, showing that SPSP results prove superior both in terms of scan time and suppression rate.
METHODS
SPSP Pulse Design
In the present work, we have implemented an SPSP pulse that consisted of Gaussian sub-pulses following an echo-planar trajectory in excitation k-space [20], whereby a minimum of three sub-pulses were amplitude-modulated by a Gaussian envelope. The bSSFP pulse sequence was programmed to produce an SPSP pulse, replacing the normal slice-selective excitation pulse, by prescribing the sub-pulse number and duration on the scanner console for each scan. The waveform of a 5×720μs (sub-pulse number times sub-pulse duration) SPSP pulse is illustrated in Fig. 1(a). In order to minimize the duration of each sub-pulse in the SPSP pulse train, the pulse was designed to have the RF on during both ramps and plateaus of slice selection gradients. This required that the RF waveform be altered to account for the variable rate gradients as shown in Fig. 1(b) [21]. For water-only image excitation the center frequency of the pulse was auto-tuned to the water resonance or, while for a fat-only image it was shifted to the fat resonance.
Fig. 1.

(a) Diagram of a 5×720μs SPSP pulse waveform. Amplitude for each sub-pulse is modulated by a Gaussian type envelope within the main lobe. Sub-pulses are played out during both positive and negative slice selection z gradients. (b) If sub-pulses are on during gradient ramps, the standard Gaussian sub-pulse is modified to account for the time variation of the gradient. Note that the modified sub-pulse area and gradient area remain unchanged.
For effective fat or water suppression, the total pulse duration is determined by the spectral bandwidth of the SPSP pulse as well as the offset frequency between fat and water. Note that two different bandwidths apply to SPSP pulses. The bandwidth of the sub-pulses combined with the slice selection gradient determines the slice thickness, while the spectral bandwidth of the envelope of the sub-pulse amplitudes determines the spectral selectivity of the excitation. For fat-water selective excitation at 3T in this study, three types of SPSP pulses were designed, having durations of 3×720 μs, 4×800 μs and 5×720 μs. The half-width-at-half-maximum (HWHM) for these SPSP pulses were 278 Hz, 208 Hz and 198 Hz, respectively. If the transition width is defined as the frequency difference between the half width at 90% maximum and the half width at 10% maximum, the corresponding transition widths for these three pulses were 342 Hz, 256 Hz and 244 Hz, respectively. As these three transition widths were all smaller than the estimated offset frequency of 440Hz at 3T between fat and water, theoretically, any of these three SPSP pulses should be able to achieve good suppression of fat or water at 3T.
Imaging Experiments
Experiments were performed on a GE Signa 3T MRI scanner (General Electric Medical Systems, Milwaukee, WI) with echo-speed gradients (40 mT / m maximum gradient strength and a maximum slew rate of 150 T / m / s). A phantom consisting of vegetable oil and water was imaged using a standard quadrature head coil, as part of a quantitative study of fat-water suppression performance. Our bSSFP sequence was a modified version of the GE product sequence FIESTA (fast imaging employing steady-state acquisition). The maximum receiver bandwidth of 125 kHz was used for all scans to minimize TR. SPSP pulses of 3×720μs, 4×800μs and 5×720μs (sub-pulse number times sub-pulse duration) were tested for fat-water selective excitation in the phantom studies. Minimum TE was chosen, and TR was equal to two times TE. Overall fat and water suppression rates using these three SPSP pulses with different duration were evaluated.
For 2-point Dixon scans, TE values of 2.3 ms and 1.2 ms were chosen for the in-phase and out-of-phase images, respectively. Signal summation and subtraction were applied on the complex images.
For both SPSP and 2-point Dixon scans, normal imaging parameters were: FOV=15 cm, flip angle FA=35°, slice thickness Δz=8 mm and matrix size of 128×128. The performance of our 5×720μs SPSP pulse was compared to that of the 2-point Dixon method in terms of suppression rate and scan time. For human studies, abdominal images of one healthy subject were acquired under an approved Institutional Review Board protocol using an 8-channel torso array coil, to evaluate the fat-water suppression performance of our SPSP excitation bSSFP sequence in a practical context. For in vivo imaging, the imaging parameters were: FOV=34 cm, flip angle FA=35°, slice thickness Δz=5mm and matrix size of 256×256. Given the same matrix size, acceleration factor and number of slices, acquisition time was directly proportional to TR. The TE/TR was set as 2.2/4.4ms and 3.0/6.0 ms for scans using a normal RF pulse and a 5×720μs SPSP pulse, leading to a 1.1 and 1.7 s acquisition time, respectively.
RESULTS
Water-only phantom images acquired with SPSP pulses of 3×720 μs, 4×800 μs and 5×720 μs duration are shown in Fig. 2(b-d), respectively. For reference, Fig. 2(a) shows an image acquired using the unmodified FIESTA sequence without the SPSP pulse. TE/TR pairs for Fig. 2(a-d) are 2.6/5.2 ms, 2.2/4.4 ms, 2.8/5.6 ms and 2.8/5.6 ms, respectively. The fat-only (water suppressed) images are shown in Fig. 3(b-d) along with the reference image in Fig. 3(a).
Fig. 2.
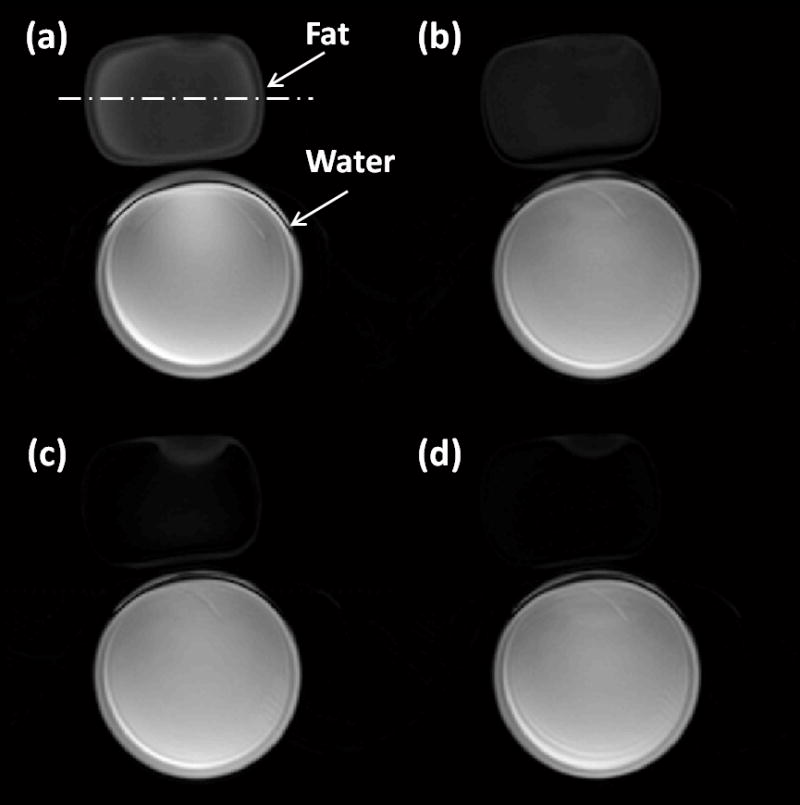
The water-only phantom images (b-d) using the SPSP pulse excitation along with the reference image (a) using the normal RF pulse in bSSFP sequence (Note that the presence of an air bubble causes a bright spot at the top of fat phantom. It also appears in Fig. 3 as a dark spot). Imaging parameters: FOV=15cm, flip angle=35°, slice thickness=8mm and matrix size=128×128. (a) reference image with TE/TR=2.6/5.2ms; (b) water-only image using the 3×720μs SPSP pulse with TE/TR=2.2/4.4ms; (c) water-only image using the 4×800μs SPSP pulse with TE/TR=2.8/5.6ms; (d) water-only image using the 5×720μs SPSP pulse with TE/TR=2.8/5.6ms.
Fig. 3.
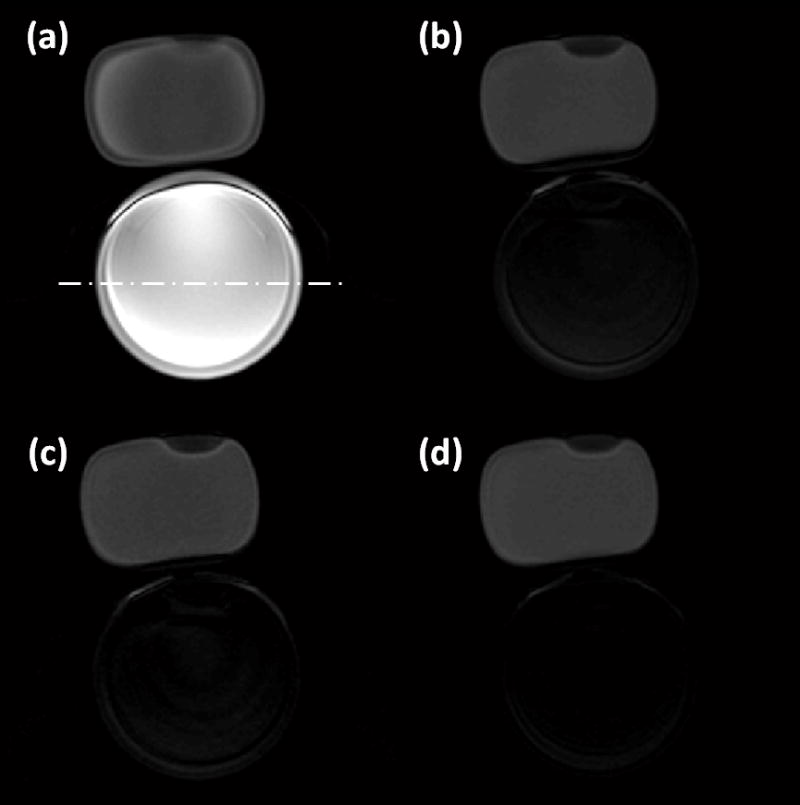
The fat-only phantom images (b-d) using the SPSP pulse excitation along with the reference image (a) using the normal RF pulse in bSSFP sequence. Identical imaging parameters are used as the corresponding counterparts in Fig. 2.
The intensities of the fat signal in Fig. 2(a-d) at the location of the dash-dot line shown in Fig. 2(a) are plotted in Fig. 4(a). The maximum intensities in the images of Fig. 2(b-d) were normalized to the maximum intensity of the reference image in Fig. 2(a). The average fat signal intensity at the location of the dash-dot line has been significantly reduced to 15.5% and 8.5% when using the 4×720μs and 5×720μs pulses, respectively. However, there is still significant fat signal (54% of the reference level) when using the 3×720μs pulse. Similarly, the water signal levels at the location of the dash-dot line are plotted in Fig. 4(b). Again, intensities in Fig. 3(b-d) were normalized to the intensity of the reference image in Fig. 3(a). The average water signal at the location of the dash-dot line has been suppressed to 8.1%, 5.6% and 3.0% for the 3×720μs, 4×720μs and 5×720μs pulses, respectively.
Fig. 4.

(a) Plot of fat signal intensities across the dash-dot line in Fig. 2. Fat signal intensities are normalized to the maximum fat signal intensity in the reference image. The average fat signal intensity is reduced to 54.1%, 15.5% and 8.5% by using the 3×720μs, 4×800μs, and 5×720μs SPSP pulses, respectively. (b) Plot of water signal intensities across the dash-dot line shown in Fig. 3. Fat signal intensities are normalized to the maximum water signal intensity in the reference image. The average water signal intensity is suppressed to 8.1%, 5.6% and 3.0% by using the 3×720μs, 4×800μs, and 5×720μs SPSP pulses, respectively.
A comparison of the images acquired using 2-point Dixon method and the 5×720μs SPSP pulse is shown in Fig. 5. The TE/TR pairs for the in-phase image (Fig. 5(a)) and the out-of-phase image (Fig. 5(b)) are 2.1/7.6 ms and 1.2/5.6 ms, respectively. Note that the relatively long TR values are automatically set by the scanner based on gradient performance limitations associated with small-FOV imaging, and that shorter TR values can be obtained for larger FOV settings. The water-only and fat-only images obtained using the Dixon method are shown in Fig. 5(c) and Fig. 5(d), respectively. The corresponding water-only and fat-only images (TE/TR=2.8/5.6ms) using the 5×720μs SPSP pulse are shown in Fig. 5(e) and Fig. 5(f), respectively. Plots comparing the water-suppression and fat-suppression levels obtained using these two methods are illustrated in Fig. 5(g) and Fig. 5(h), respectively (along with a plot of the in-phase signal level for reference). The overall fat signal intensity was suppressed to 10.7% and 8.7% of the reference level for the 2-point Dixon and the SPSP pulse, respectively, while the overall water signal was reduced to 15.6% and 3.5% of the reference level for Dixon and SPSP methods, respectively.
Fig. 5.

Comparison of fat-water separation by 2-p Dixon method and SPSP pulses. (a) In-phase image with TE/TR=2.3/7.6ms; (b) Out-of-phase image with TE/TR=1.2/5.6ms. Dixon’s water-only (c) and fat-only (d) image are obtained by summation and subtraction of in-phase and out-of-phase image in the complex domain. Water-only image (e) and fat-only image (f) using the 5×720 μs SPSP pulse with TE/TR=2.8/5.6ms. Comparison of fat and water suppression rate between 2-point Dixon method and the 5×720μs SPSP pulses are plotted in (g) and (h), respectively. The in-phase image shown in (a) is used as the reference image. The average fat signal intensity is reduced to 10.7% and 8.7% with Dixon method and the SPSP pulse in (g), respectively. The average water signal intensity is reduced to 15.6% and 3.5% with Dixon method and SPSP pulse in (h), respectively.
The bSSFP abdominal images employing a 5×720μs SPSP pulse along with a reference image employing a normal RF pulse excitation are shown in Fig. 6. Complete and homogenous fat and water suppression have been achieved successfully by SPSP excitations as shown in the water-only (Fig. 6(b)) and fat-only images (Fig. 6(c)), respectively. No apparent banding artifacts are seen in the SPSP excitation images in spite of the extention of TR. The temporal resolution was around 1.5s per image with a relatively high spatial resolution of 1.3mm/pixel without using any acceleration techniques such as partial Fourier and parallel imaging.
Fig. 6.

Fat and water suppression in bSSFP abdominal imaging using a 5×720μs SPSP pulse. A reference image by using a normal RF pulse excitation (a) is acquired with TE/TR=2.3/4.4ms. Complete and homogenous fat and water suppression are achieved by SPSP excitations (TE/TR=3.0/6.0ms) as shown in the water-only (b) and fat-only images (c), respectively. Imaging parameters: FOV=34cm, flip angle=35°, slice thickness=5mm and matrix size=256×256.
DISCUSSION
A significant issue with the adoption of SPSP pulses in bSSFP imaging relates to the total duration of the excitation pulse, and associated possible increases in banding artifacts due to the prolonged minimum TR. Therefore, for good SPSP fat-water selective excitation, performing careful shimming may prove important toward alleviating possible banding artifacts. Slightly reducing the duration of the SPSP excitation can also reduce such artifacts, at a cost in terms of suppression rate. Although the possibility of exacerbating banding artifacts is a significant limitation of the proposed approach, it may be noted that no such artifacts were observed in our results.
The minimum slice thickness achievable also imposes restriction on the duration of each sub-pulse of the SPSP pulse. For example, for a relatively thin 3 mm slice, gradient strength and slew rate restrictions could easily result in sub-pulse durations of 1 ms or more. For bSSFP sequences, where any increase in TR comes at the risk of exacerbated banding artifacts, it is important to keep sub-pulse duration as short as possible, even for thin slices. Through careful design, using both the ramp and plateau of the slice selection gradient, and using an MRI system with regular gradient strength and slew rate (40 mT / m and 150 T/m/s), the minimum achievable sub-pulse duration was 416 μs for an 8 mm slice thickness, 504 μs for a 5 mm slice thickness, and 660 μs for a 3 mm slice thickness [22].
In the present study, transition widths for the three SPSP pulses were all smaller than the offset frequency of fat, and accordingly they all proved suitable for fat-water selective excitation. However, the transition width of the 3×720 μs SPSP pulse (342Hz) was fairly close to the offset frequency for fat (~390Hz in phantom), and residual fat signal as seen in Fig. 2(b) may have been caused by a coarse center frequency setting during the pre-scan.
The performance of a SPSP pulse for spectrally selective excitation may be quite dependent on system hardware characteristics. For example, fat-water imaging for bSSFP using these pulses is difficult at low field due to the small frequency difference between fat and water, and hence the need for prolonged SPSP pulse durations. At field strengths over 3T, pulse duration can be reduced, but gradient limitations become a main factor restricting how short these pulses may get. Timing delay between RF pulse waveforms and gradient waveforms can also present problems [17]. Even a relatively small delay can result in ghost artifacts, especially for off-center slices. Uncompensated eddy currents and gradient nonlinearities may also degrade performance. Pulse calibration and correction methods [17, 23] may be employed for this purpose.
Compared with variants of the Dixon method, SPSP excitations have the advantage of requiring only a single acquisition to obtain either a water-only or a fat-only image, with no need for specialized reconstruction algorithms. Thus, it could be considered for use in dynamic imaging applications where temporal resolution and latency can be critical. Compared to a 2-point Dixon method with TR=2.4 ms (out-of-phase) and 4.6 ms (in-phase), for a total effective TR of 7.0 ms, our proposed method with a 6 ms TR as demonstrated in abdominal imaging would represent a 16.7% improvement in terms of scan time, while allowing significant improvements in terms of fat (or water) suppression. Although better results could be obtained with a 3-point Dixon method than with a 2-point method, possibly eliminating the suppression rate advantage that we demonstrated for our method, the much shorter scan time of our approach as compared to a 3-point Dixon method would be a significant advantage. It is also worth noting that fat-water selective excitation using SPSP pulses can also be implemented for 3D bSSFP imaging in a straightforward manner, and that limiting scan time may prove especially important when imaging in 3D.
In summary, experiments were performed to evaluate the use of SPSP pulses for fat-water selective excitation in conjunction with a bSSFP sequence. Compared with variants of the Dixon method, fat-water imaging using SPSP pulses has the distinct advantage of requiring only a single acquisition, and does not involve any specialized reconstruction algorithm. While there might be a general perception that SPSP pulses may not be compatible with bSSFP imaging because they would unduly prolong TR, the present work shows that through careful design, SPSP pulses short enough for practical bSSFP imaging can be successfully employed toward fat and water suppression.
Acknowledgments
This work was supported in part by NIH grant U41RR019703. The content is solely the responsibility of the authors and does not necessarily represent the official views of the NIH.
Footnotes
Publisher's Disclaimer: This is a PDF file of an unedited manuscript that has been accepted for publication. As a service to our customers we are providing this early version of the manuscript. The manuscript will undergo copyediting, typesetting, and review of the resulting proof before it is published in its final citable form. Please note that during the production process errors may be discovered which could affect the content, and all legal disclaimers that apply to the journal pertain.
References
- 1.Haacke EM, Wielopolski PA, Tkach JA, Modic MT. Steady-state free precession imaging in the presence of motion: application for improved visualization of the cerebrospinal fluid. Radiology. 1990;175:545–552. doi: 10.1148/radiology.175.2.2326480. [DOI] [PubMed] [Google Scholar]
- 2.Borthne AS, Dormagen JB, Gjesdal KI, Storaas T, Lygren I, Geitung JT. Bowel MR imaging with oral Gastrografin: an experimental study with healthy volunteers. Eur Radiol. 2003;13:100–106. doi: 10.1007/s00330-002-1528-6. [DOI] [PubMed] [Google Scholar]
- 3.Scheffler K, Heid O, Hennig J. Magnetization preparation during the steady state: fat-saturated 3D TrueFISP. Magn Reson Med. 2001;45:1075–1080. doi: 10.1002/mrm.1142. [DOI] [PubMed] [Google Scholar]
- 4.Deshpande VS, Shea SM, Laub G, Simonetti OP, Finn JP, Li D. 3D magnetization-prepared true-FISP: a new technique for imaging coronary arteries. Magn Reson Med. 2001;46:494–502. doi: 10.1002/mrm.1219. [DOI] [PubMed] [Google Scholar]
- 5.Dixon WT. Simple proton spectroscopic imaging. Radiology. 1984;153:189–194. doi: 10.1148/radiology.153.1.6089263. [DOI] [PubMed] [Google Scholar]
- 6.Reeder SB, Pelc NJ, Alley MT, Gold GE. Rapid MR imaging of articular cartilage with steady-state free precession and multipoint fat-water separation. AJR Am J Roentgenol. 2003;180:357–362. doi: 10.2214/ajr.180.2.1800357. [DOI] [PubMed] [Google Scholar]
- 7.Reeder SB, Wen Z, Yu H, Pineda AR, Gold GE, Markl M, Pelc NJ. Multicoil Dixon chemical species separation with an iterative least-squares estimation method. Magn Reson Med. 2004;51:35–45. doi: 10.1002/mrm.10675. [DOI] [PubMed] [Google Scholar]
- 8.Reeder SB, Markl M, Yu H, Hellinger JC, Herfkens RJ, Pelc NJ. Cardiac CINE imaging with IDEAL water-fat separation and steady-state free precession. J Magn Reson Imaging. 2005;22:44–52. doi: 10.1002/jmri.20327. [DOI] [PubMed] [Google Scholar]
- 9.Huang TY, Chung HW, Wang FN, Ko CW, Chen CY. Fat and water separation in balanced steady-state free precession using the Dixon method. Magn Reson Med. 2004;51:243–247. doi: 10.1002/mrm.10686. [DOI] [PubMed] [Google Scholar]
- 10.Overall WR, Nishimura DG, Hu BS. Steady-state sequence synthesis and its application to efficient fat-suppressed imaging. Magn Reson Med. 2003;50:550–559. doi: 10.1002/mrm.10542. [DOI] [PubMed] [Google Scholar]
- 11.Absil J, Denolin V, Metens T. Fat attenuation using a dual steady-state balanced-SSFP sequence with periodically variable flip angles. Magn Reson Med. 2006;55:343–351. doi: 10.1002/mrm.20766. [DOI] [PubMed] [Google Scholar]
- 12.Leupold J, Hennig J, Scheffler K. Alternating repetition time balanced steady state free precession. Magn Reson Med. 2006;55:557–565. doi: 10.1002/mrm.20790. [DOI] [PubMed] [Google Scholar]
- 13.Vasanawala SS, Pauly JM, Nishimura DG. Fluctuating equilibrium MRI. Magn Reson Med. 1999;42:876–883. doi: 10.1002/(sici)1522-2594(199911)42:5<876::aid-mrm6>3.0.co;2-z. [DOI] [PubMed] [Google Scholar]
- 14.Ababneh R, Yuan J, Madore B. Fat-water separation in dynamic objects using an UNFOLD-like temporal processing. J Magn Reson Imaging. 2010;32:962–970. doi: 10.1002/jmri.22321. [DOI] [PMC free article] [PubMed] [Google Scholar]
- 15.Hargreaves BA, Vasanawala SS, Nayak KS, Hu BS, Nishimura DG. Fat-suppressed steady-state free precession imaging using phase detection. Magn Reson Med. 2003;50:210–213. doi: 10.1002/mrm.10488. [DOI] [PubMed] [Google Scholar]
- 16.Meyer CH, Pauly JM, Macovski A, Nishimura DG. Simultaneous spatial and spectral selective excitation. Magn Reson Med. 1990;15:287–304. doi: 10.1002/mrm.1910150211. [DOI] [PubMed] [Google Scholar]
- 17.Zur Y. Design of improved spectral-spatial pulses for routine clinical use. Magn Reson Med. 2000;43:410–420. doi: 10.1002/(sici)1522-2594(200003)43:3<410::aid-mrm13>3.0.co;2-3. [DOI] [PubMed] [Google Scholar]
- 18.Schick F, Forster J, Machann J, Huppert P, Claussen CD. Highly selective water and fat imaging applying multislice sequences without sensitivity to B1 field inhomogeneities. Magn Reson Med. 1997;38:269–274. doi: 10.1002/mrm.1910380216. [DOI] [PubMed] [Google Scholar]
- 19.Nayak KS, Cunningham CH, Santos JM, Pauly JM. Real-time cardiac MRI at 3 tesla. Magn Reson Med. 2004;51:655–660. doi: 10.1002/mrm.20053. [DOI] [PubMed] [Google Scholar]
- 20.Pauly J, Nishimura D, Macovski A. A K-Space Analysis of Small-Tip-Angle Excitation. Journal of Magnetic Resonance. 1989;81:43–56. doi: 10.1016/j.jmr.2011.09.023. [DOI] [PubMed] [Google Scholar]
- 21.Conolly S, Nishimura D, Macovski A, Glover G. Variable-Rate Selective Excitation. Journal of Magnetic Resonance. 1988;78:440–458. [Google Scholar]
- 22.Yuan J, Mei C-S, Panych LP. Ultra-short 2D RF pulse for reduced field-of-view SSFP imaging. Proceedings 16th Scientific Meeting, International Society for Magnetic Resonance in Medicine. 2008:3137. [Google Scholar]
- 23.Oelhafen M, Pruessmann KP, Kozerke S, Boesiger P. Calibration of echo-planar 2D-selective RF excitation pulses. Magn Reson Med. 2004;52:1136–1145. doi: 10.1002/mrm.20248. [DOI] [PubMed] [Google Scholar]