The crystal structure of an unliganded form of CTP synthase from S. solfataricus unambiguously establishes that while the active form of the enzyme is tetrameric, a dimeric form has been crystallized. A comparison with the tetrameric form of the E. coli enzyme suggests that rather large intramolecular movements accompany tetramerization.
Keywords: CTP synthase, dimer–tetramer equilibrium, nucleotide metabolism
Abstract
CTP synthase catalyzes the last committed step in de novo pyrimidine-nucleotide biosynthesis. Active CTP synthase is a tetrameric enzyme composed of a dimer of dimers. The tetramer is favoured in the presence of the substrate nucleotides ATP and UTP; when saturated with nucleotide, the tetramer completely dominates the oligomeric state of the enzyme. Furthermore, phosphorylation has been shown to regulate the oligomeric states of the enzymes from yeast and human. The crystal structure of a dimeric form of CTP synthase from Sulfolobus solfataricus has been determined at 2.5 Å resolution. A comparison of the dimeric interface with the intermolecular interfaces in the tetrameric structures of Thermus thermophilus CTP synthase and Escherichia coli CTP synthase shows that the dimeric interfaces are almost identical in the three systems. Residues that are involved in the tetramerization of S. solfataricus CTP synthase according to a structural alignment with the E. coli enzyme all have large thermal parameters in the dimeric form. Furthermore, they are seen to undergo substantial movement upon tetramerization.
1. Introduction
CTP synthase catalyzes the last commited step in de novo pyrimidine-nucleotide biosynthesis:
Glutamine is hydrolysed in the class I glutamine amidotransferase domain and the nascent ammonia is channelled through the interior of the enzyme to the synthase domain (Levitzki & Koshland, 1971 ▶, 1972 ▶; Weeks et al., 2006 ▶; Willemoës, 2004 ▶; Iyengar & Bearne, 2003 ▶; Lunn & Bearne, 2004 ▶; Endrizzi et al., 2004 ▶). Here, ammonia reacts with the intermediate 4-phosphoryl UTP, which is obtained by ATP-dependent phosphorylation of UTP (von der Saal et al., 1985 ▶; Lewis & Villafranca, 1989 ▶; Willemoës & Sigurskjold, 2002 ▶). In this reaction the enzyme activity is regulated by GTP, an allosteric activator that strongly stimulates the hydrolysis of glutamine (Levitzki & Koshland, 1971 ▶; Willemoës et al., 2005 ▶; Bearne et al., 2001 ▶; MacDonnell et al., 2004 ▶; Lunn, MacDonnell et al., 2008 ▶; Willemoës, 2003 ▶). Alternatively, the reaction can take place using ammonia obtained from the solution in place of glutamine hydrolysis, in which case the reaction proceeds at a similar rate to that of the glutamine-dependent reaction in the presence of GTP (Willemoës, 2004 ▶; Bearne et al., 2001 ▶). The product CTP also serves as an allosteric inhibitor; the triphosphate-binding site overlaps with that of UTP, but the nucleoside moiety of CTP binds in an alternative pocket opposite the binding site for UTP (Endrizzi et al., 2005 ▶).
Active CTP synthase is a homotetrameric enzyme. The enzyme tetramer is composed of two dimers that have been shown to dissociate into monomers at dilute enzyme concentrations (Anderson, 1983 ▶; Robertson, 1995 ▶). The tetramer is favoured in the presence of the substrate nucleotides ATP and UTP; when saturated with nucleotide, the tetramer completely dominates the oligomeric state of the enzyme (Anderson, 1983 ▶; Pappas et al., 1998 ▶; Levitzki & Koshland, 1972 ▶). One exception to the observation of an unstable tetramer in the absence of nucleotides is the Lactococcus lactis enzyme, which remains a tetramer even at dilute enzyme concentrations (Wadskov-Hansen et al., 2001 ▶). While Escherichia coli CTP synthase is stabilized in the tetrameric state by increasing the ionic strength (Anderson, 1983 ▶; Robertson, 1995 ▶), the opposite effect is observed for the L. lactis enzyme (Willemoës & Larsen, 2003 ▶).
Crystal structures of apo CTP synthase from E. coli (PDB entry 1s1m; Endrizzi et al., 2004 ▶) and of the enzyme with ADP and CTP bound (PDB entry 2ad5; Endrizzi et al., 2005 ▶) both showed the tetrameric structure. In addition, the CTP synthase from Thermus thermophilus (Goto et al., 2004 ▶) crystallized as a homotetramer in the apo form (PDB entry 1vcm), with sulfate bound in the active site (PDB entry 1vcn) and with glutamine bound in the glutamine amidotransferase domain (PDB entry 1vco). These structures are all fairly similar, consisting of four almost identical subunits which interact through the N-terminal synthase domain (residues 1–266 in the E. coli structure). The C-terminal amidotransferase domains (residues 287–544 in the E. coli structure) are located far from the tetramer interfaces and are not affected by the oligomeric state. The ATP-binding site and CTP-binding site in the synthase domain are located at the tetramer interface (PDB entry 2ad5), which explains why tetramerization is stabilized by binding ATP and CTP (and also UTP) as these nucleotides interact with amino-acid residues from three subunits (Endrizzi et al., 2005 ▶). The glutamine amidotransferase domain is fully active in the dimeric form of the enzyme (Levitzki & Koshland, 1971 ▶; Willemoës & Larsen, 2003 ▶), which is in agreement with the structure of the E. coli enzyme, from which it is evident that tetramerization solely affects the synthase domain and the composite formation of the synthase active site (Endrizzi et al., 2004 ▶, 2005 ▶).
The yeast and human enzymes have been shown to be regulated by phosphorylation by protein kinases A and C (Chang & Carman, 2008 ▶; Chang et al., 2007 ▶). Phosphorylation also influences the oligomeric state of the yeast URA 7 isozyme, so that treatment with alkaline phosphatase fully dissociates the tetramer to dimers even in the presence of ATP and UTP (Pappas et al., 1998 ▶). Mutations which affect the oligomeric state and prevent tetramer formation have also been described (Lunn, Mcleod et al., 2008 ▶).
Unlike the E. coli (Endrizzi et al., 2004 ▶) and T. thermophilus (Goto et al., 2004 ▶) enzymes, which both crystallized as tetramers even in the absence of ATP and UTP, the Sulfolobus solfataricus enzyme crystallized as a dimer. This has allowed an analysis of the possible structural changes that take place upon tetramer formation of CTP synthase.
2. Materials and methods
2.1. Protein synthesis
The reading frame of S. solfataricus pyrG was obtained by PCR with chromosomal DNA from S. solfataricus P2 as a template (a gift from Dr Q. She, Department of Biology, University of Copenhagen) and using the custom-designed oligonucleotides sspyrg1, CCGGATCCAGGAGAGAACATAATGccaaacaagtacatagtcgttacagg, and sspyrg2, CGACGTCGACttaaagactagcaacagctctaatgaaccc, as primers. The sspyrg1 primer contains a synthetic start codon (indicated by underlining) and a Shine–Dalgarno sequence (indicated in bold) that are incorporated into the final PCR product. By use of the BamHI and SalI restriction endonuclease sites introduced into the PCR product by sspyrg1 and sspyrg2, respectively, and indicated in italics in the above sequences, an expression vector was constructed by cloning the S. solfataricus pyrG PCR fragment into the E. coli DNA vector pUHE23-2 (Deuschle et al., 1986 ▶), resulting in the plasmid pKDS4. CTP synthase was synthesized by growing E. coli strain NF1830 (Andersen et al., 1992 ▶) transformed with pKDS4 with vigorous shaking at 310 K in a chemically defined basic salt medium (Clark & Maaløe, 1967 ▶) supplied with 10 g tryptone, 5 g yeast extract, 1 g glucose and 100 mg ampicillin per litre. Isopropyl β-d-1-thiogalactopyranoside (0.5 mM) was added when the OD436 was equal to 0.5. Growth was continued overnight and the cells were harvested by centrifugation.
Approximately 30 g of cells was resuspended in 100 ml 100 mM Tris–HCl pH 7.6 and 2 mM EDTA and subjected to sonication. β-Mercaptoethanol was then added to a final concentration of 2.0 mM and the cell debris was removed by centrifugation.
The cell extract was heated in a water bath to 343 K for 10 min with constant stirring and was then cleared by centrifugation. Subsequent steps were performed at 277 K. Ammonium sulfate was added to 30% saturation and the protein precipitate was removed by centrifugation. The solution was then brought to 60% saturation and the precipitate was collected by centrifugation. The pellet was resuspended in buffer A (25 mM Tris–HCl pH 7.6, 0.1 mM EDTA and 2 mM β-mercaptoethanol) and dialysed overnight against the same buffer.
The dialysed protein was applied onto a 60 ml DE-52 column (DEAE-cellulose, Whatman) and washed with 50 ml buffer A. Elution of protein from the column was performed using a linear gradient (100 ml) from 0 to 0.33 M NaCl in buffer A. S. solfataricus CTP synthase eluted early from the column and the relevant fractions were pooled and dialysed for 1 h against buffer A as above.
Finally, the dialysed protein was applied onto a 30 ml Dyematrex Gel Red A column (Millipore) and eluted with a 100 ml gradient of 0–1 M NaCl in buffer A. The protein eluted as a single peak containing S. solfataricus CTP synthase. The relevant fractions were pooled and concentrated to a final volume of 11 ml on a Centriprep (Millipore). Finally, the protein was dialysed overnight against 50% glycerol in buffer A. The enzyme was stored at 253 K at a concentration of approximately 7 mg ml−1.
2.2. Analysis of the oligomeric state of S. solfataricus CTP synthase
Size determination of S. solfataricus CTP synthase by sedimentation-ultracentrifugation experiments was performed as described previously (Jensen & Mygind, 1996 ▶). The 5–20% sucrose gradients (12 ml) for the Beckman SW 41 rotor were prepared in either 50 mM Tris–HCl pH 8.0 containing 10.0 mM MgCl2 and 2.0 mM DTT or 50 mM Tris–HCl pH 8.0, 10.0 mM MgCl2, 2.0 mM DTT and UTP, ATP and GTP at a concentration of 1.0 mM each. 100 µl samples containing ∼0.1 mg purified CTP synthase and the marker enzymes bovine liver catalase (250 kDa) and yeast alcohol dehydrogenase (150 kDa) were layered on top of the gradients. Following centrifugation for 23 h at 39 000 rev min−1 and 277 K the gradients were cut into 40 equally sized fractions, which were assayed for enzyme activity. Alcohol dehydrogenase activity was measured by monitoring the increase in absorbance at 340 nm following mixing of a 50 µl fraction with 1 ml of a reaction mixture consisting of 2 mM EDTA, 0.6 M ethanol and 0.2 mM NAD in 50 mM Tris–HCl pH 7.8 at 303 K. Catalase activity was measured by monitoring the decrease in absorbance at 240 nm following mixing of a 20 µl fraction with 1 ml of a reaction mixture consisting of 0.06% H2O2 in 1 mM EDTA, 50 mM NaCl and 50 mM Tris–HCl pH 7.5 at 303 K. CTP synthase activity was determined by a radioactive assay measuring the conversion of [2-14C]-UTP to [2-14C]-CTP. To do this, a 10 µl fraction was mixed with 15 µl of a reaction mixture consisting of 2 mM dithiothreitol, 20 mM MgCl2, 10 mM glutamine, 1 mM ATP, 1 mM GTP and 1 mM [2-14C]-UTP (∼5 Ci mol−1; Moravek Biochemicals) in 50 mM HEPES buffer pH 8.0. Following incubation at 333 K for 1 h, 10 µl of the reaction mixture was mixed with 5 µl 2 M HCOOH containing GTP, ATP, CTP and UTP (1 mM each) and applied onto 20 × 20 cm polyethylene-impregnated cellulose thin-layer plates (PEI cellulose F, Merck). The plates were chromatographed in 0.85 M potassium phosphate pH 3.4, which separates the four nucleoside triphosphates from each other. The triphosphates were located by inspection of the dried chromatograms under UV light and the radioactivity from the UTP and CTP was determined by liquid-scintillation counting (Jensen et al., 1979 ▶).
2.3. Crystallization
Crystallization experiments were carried out with a protein solution consisting of approximately 10 mg ml−1 protein in 25 mM Tris–HCl pH 7.6, 2 mM β-mercaptoethanol and 0.1 mM EDTA. A solubility footprint screen (Stura et al., 1992 ▶) and Hampton Research Crystal Screen and Crystal Screen 2 (Jancarik & Kim, 1991 ▶) were set up using hanging-drop vapour diffusion in VDX plates. 2 + 2 µl drops were equilibrated against 500 µl reservoir solution. Condition Nos. 18 and 46 from Hampton Research Crystal Screen gave bunches of needles. These were optimized to give the largest crystals from drops made up of 2 µl 6% PEG 8000, 0.1 M magnesium acetate and 0.1 M sodium acetate buffer pH 4.5 and 2 µl protein solution at a concentration of 10 mg ml−1.
2.4. Data collection and processing
After having tested several cryoprotectants, the best data set was obtained from a single crystal which was mounted using a litho loop and flash-cooled directly in the nitrogen stream without adding cryoprotectant. Diffraction data were collected to be as complete as possible (360°). Integration and scaling of the data were performed using XDS and XSCALE (Kabsch, 2010 ▶). The crystals were anisotropic and a range of values were used during integration to define the apparent mosaicity. Data-collection statistics are presented in Table 1 ▶.
Table 1. X-ray data-collection and refinement statistics.
Values in parentheses are for the outermost resolution shell.
| Data collection | |
| Beamline | I911-2, MAX-lab, Sweden |
| Detector | MAR Research CCD |
| Wavelength (Å) | 1.0419 |
| Temperature (K) | 100 |
| Space group | P1 |
| Sample-to-detector distance (mm) | 200 |
| No. of images | 360 |
| Oscillation angle (°) | 1.0 |
| Unit-cell parameters (Å, °) | a = 43.45 (4), b = 76.78 (5), c = 98.87 (7), α = 100.993 (9), β = 95.36 (3), γ = 108.42 (1) |
| Resolution range (Å) | 20.00–2.50 (2.60–2.50) |
| No. of observed reflections | 152504 (15232) |
| No. of unique reflections | 39001 (3903) |
| Mosaicity (°) | 0.25–0.65 |
| Multiplicity | 3.9 (3.9) |
| Completeness (%) | 95.9 (86.4) |
| Rmerge† | 0.047 (0.285) |
| 〈I/σ(I)〉 | 19.93 (4.65) |
| Refinement | |
| Resolution range | 20.00–2.50 (2.57–2.50) |
| R factor | 0.211 (0.328) |
| Rfree | 0.2822 (0.4323) |
| No. of subunits in asymmetric unit | 2 |
| No. of protein non-H atoms | 8384 |
| No. of water molecules | 147 |
| Average B factors (Å2) | |
| Main chain | 51.9 |
| Side chain | 54.4 |
| Solvent | 45.5 |
| R.m.s.d. bond lengths (Å) | 0.009 |
| R.m.s.d. bond angles (°) | 1.182 |
| Ramachandran statistics | |
| Favoured (%) | 91.5 |
| Allowed (%) | 6.7 |
| Outliers (%) | 1.8 |
| PDB code | 3nva |

 , where 〈I(hkl)〉 is the mean intensity of a set of equivalent reflections.
2.5. Structure solution and refinement
Molecular replacement was performed using MOLREP (Vagin & Teplyakov, 1997 ▶; Vaguine et al., 1999 ▶). The search unit was one subunit of T. thermophilus CTP synthase, which shares 54% sequence identity with S. solfataricus CTP synthase; the structure with sulfate bound (PDB entry 1vcn) gave the best solution. Two molecules were found in the asymmetric unit, giving an R factor of 0.511 and a score of 0.599 (the score is the product of the correlation coefficient of intensities and the maximal value of the packing function). Rigid-body refinement was performed using phenix.refine (Afonine et al., 2005 ▶). Changes in the sequence were performed automatically using Coot (Emsley & Cowtan, 2004 ▶) and were checked manually. Structure refinement in phenix.refine with successive rounds of model building in Coot was performed. NCS was applied during most of the refinement cycles, but was loosened at the end. This had no significant impact on the R/R free values. Torsion/libration/screw (TLS) motion was applied. Six segments/chain were used as defined using the TLS server (Painter & Merritt, 2006 ▶). Molecule A was divided into residues 2–31, 32–183, 184–294, 295–361, 362–435 and 436–534 and molecule B was divided into residues 2–31, 32–169, 170–294, 295–362, 363–435 and 436–534. Water molecules were inserted in Coot and checked manually. The final R factor for the structure, consisting of a dimer with 8384 protein atoms and 147 water molecules, was 0.211 (R free = 0.282). Validation was performed using the JCSG structure-validation server. The Ramachandran plot (see Table 1 ▶) showed 1.8% outliers: Gly11 (A and B), Leu182 (B), Thr185 (A and B), Arg271 (A), Gln272 (A), Gly324 (B), Lys342 (B), Asn345 (A), Phe360 (A), Ser362 (A), Gln426 (A and B), Lys427 (A and B) and Leu432 (A and B) were found in the disallowed region. All of these residues refined with large thermal parameters and we believe that the reason that they are outliers is that they are found in areas with less well defined electron density. The average of the solvent thermal parameters is seen to be somewhat lower that the average of the protein thermal parameters. This is because the very flexible part of the protein is included in the average and water molecules were only inserted where the electron-density map was unambiguously clear.
3. Results and discussion
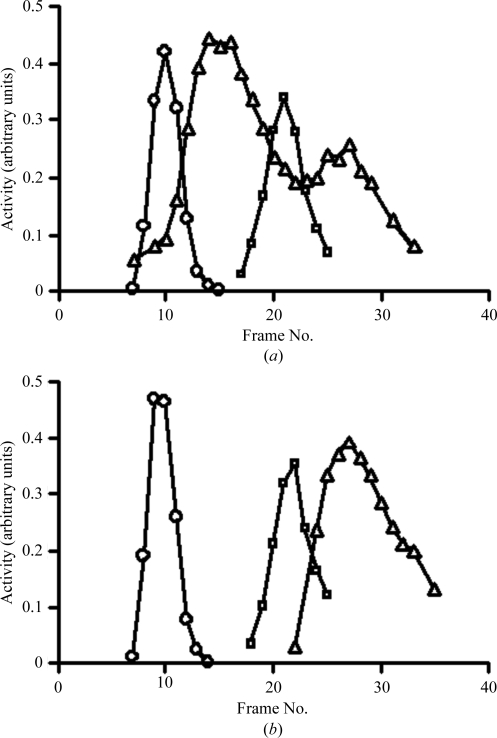
Like the other characterized CTP synthases mentioned above, the oligomeric state of the S. solfataricus enzyme is also a tetramer in the presence of ATP and UTP (Fig. 1 ▶ a). Similarly, the enzyme dissociates into dimers in the absence of substrate nucleotides (Fig. 1 ▶ b).
Figure 1.
The influence of nucleotides on the oligomeric state of CTP synthase. The molecular weights calculated for the dimer and tetramer from the sequence are 120 and 240 kDa, respectively, which are in good agreement with the molecular weights (105 and 210 kDa) calculated from the sedimentation profiles according to the formula of Martin & Ames (1961 ▶). (a) Sedimentation of CTP synthase and marker enzymes in the presence of nucleotides: diamonds, catalase activity (250 kDa); squares, alcohol dehydrogenase activity (150 kDa); triangles, CTP synthase activity. (b) Sedimentation of CTP synthase and marker enzymes in the absence of nucleotides. Symbols are the same as above.
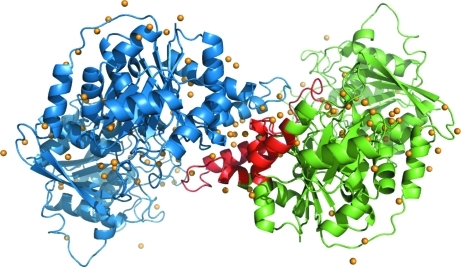
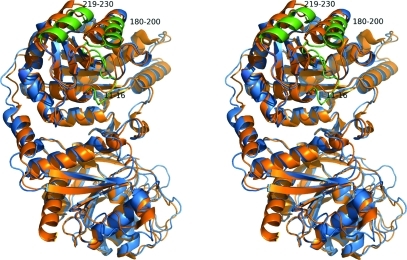
Unlike the E. coli (Endrizzi et al., 2004 ▶) and T. thermophilus (Goto et al., 2004 ▶) enzymes, which both crystallized as tetramers even in the absence of ATP and UTP, the present structure unambiguously established that the S. solfataricus enzyme had crystallized as a homodimer as shown in Fig. 2 ▶. Superposing the two peptide chains using Coot showed that they were quite similar, with an r.m.s.d. of the Cα atoms in the two chains of 0.29 Å and a maximum deviation of 1.51 Å. Analysis with LSQMAN (Kleywegt, 1996 ▶) shows that they are related by an almost pure twofold axis (179.57°) and a translation component of 0.245 Å. The overall fold of the protein is similar to the fold found in the CTP synthases from E. coli [PDB entries 1s1m (Endrizzi et al., 2004 ▶) and 2ad5 (Endrizzi et al., 2005 ▶)] and T. thermophilus (PDB entries 1vcn, 1vcm and 1vco; Goto et al., 2004 ▶). A superposition of the subunit of E. coli apo CTP synthase on the S. solfataricus structure is shown in Fig. 3 ▶. The most pronounced difference in the otherwise very conserved structure of the synthase domain is the change in the loop going from residues 11–16 termed the P-loop (Endrizzi et al., 2005 ▶), the loop and helix from residues 180 to 200 and the helix formed by residues 219–230. These areas are shown in green in the figure.
Figure 2.
Dimeric structure of S. solfataricus CTP synthase. Molecule A is diplayed in green and molecule B is displayed in blue. The dimeric contact area of the A molecule is shown in red. Water molecules are shown in orange. This figure was prepared in PyMOL (DeLano, 2002 ▶).
Figure 3.
Superposition of a subunit of tetrameric E. coli apo CTP synthase (PDB code 1s1m, shown in orange) onto a subunit from dimeric S. solfataricus CTP synthase (shown in blue). The synthase domain is in the upper part of the figure and the amidotransferase domain is in the lower part. Residues 11–16, 180–200 and 219–230 of the S. solfataricus structure are shown in green. This figure was prepared in PyMOL (DeLano, 2002 ▶).
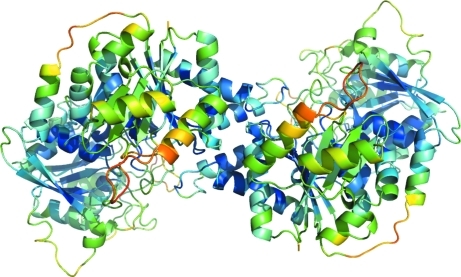
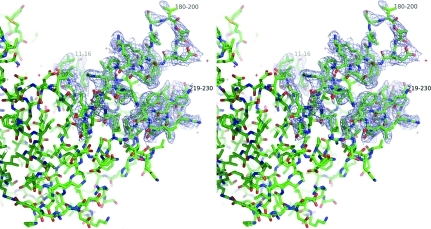
The 2F obs − F calc electron-density maps allowed the building of the complete backbone structure of S. solfataricus CTP synthase. However, some parts of the peptide chain refined with thermal parameters that were very large compared with the average, which is 60 Å2, indicating high flexibility in these regions and some uncertainty in the model (see Fig. 4 ▶). Among these are the regions that are shown in Fig. 3 ▶ to be displaced compared with the E. coli apo structure. These include the residues from Val11 to Val16 (with 〈B〉 values of 93 Å2 in chain A and 118 Å2 in chain B), the residues from Val180 to Leu200 (100 Å2 in chain A and 127 Å2 in chain B) and also to some extent the helix that runs from residues 219 to 230 (72 Å2 in chain A and 109 Å2 in chain B). In Fig. 5 ▶ these three areas are shown with a 2F o − F c OMIT map calculated using SFCHECK (Collaborative Computational Project, Number 4, 1994 ▶; Vaguine et al., 1999 ▶) contoured at a level of 0.8σ. It is clearly seen that although these amino-acid residues have large thermal parameters the chain can be traced without ambiguity.
Figure 4.
Dimeric structure of S. solfataricus CTP synthase colour-coded according to the backbone thermal parameters. Blue indicates low thermal parametes and red indicates large thermal parameters. The synthase domain is at the front. This figure was prepared in PyMOL (DeLano, 2002 ▶).
Figure 5.
Stereo figure showing part of the synthase domain. A 2F o − F c OMIT map is shown around residues 11–16, 180–200 and 219–230. The OMIT map is contoured at a level of 0.8σ. This figure was prepared in PyMOL (DeLano, 2002 ▶).
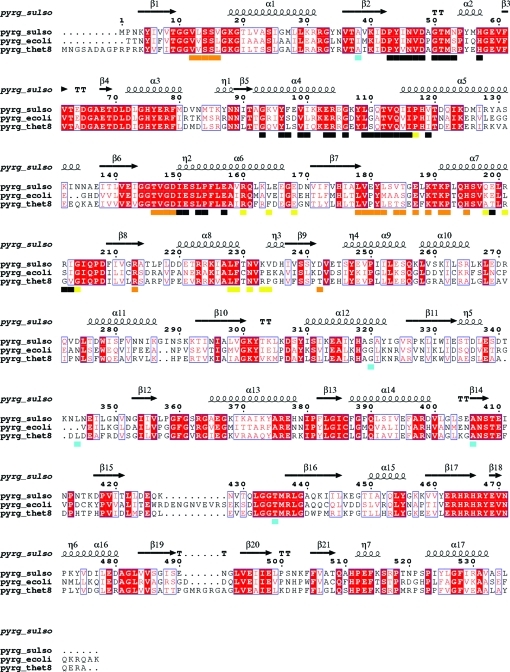
An analysis of the amino-acid residues responsible for the dimer and tetramer interactions was performed using the PISA web interface at the European Bioinformatics Institute (http://www.ebi.ac.uk/msd-srv/prot_int/pistart.html; Krissinel & Henrick, 2007 ▶). A comparison with the intermolecular interfaces in the tetrameric structures of T. thermophilus CTP synthase (PDB entry 1vcm) and E. coli CTP synthase (PDB entry 1s1m) shows that the residues responsible for dimerization are almost identical in the three systems: all are in the N-terminal domain and in highly conserved areas of the sequence (see Fig. 6 ▶ for sequence alignment and indication of the dimer interface). The only outlier is an extra salt bridge between Glu199 and Arg202 in the S. solfataricus structure. The areas in the sequences that are responsible for dimer formation are highlighted with black bars in the sequence alignment shown in Fig. 6 ▶. Similarly, the regions that are responsible for tetramer formation are almost identical and are indicated by orange bars (one of the unique tetramer interfaces formed by the dimer with a neighbouring subunit) or yellow bars (the other unique tetramer interface) in Fig. 6 ▶. From Fig. 6 ▶ it is clear that the areas pinpointed in Figs. 3 ▶ and 4 ▶ as being notably different in the S. solfataricus dimeric structure compared with the tetrameric CTP synthase structures and as having large thermal parameters in the S. solfataricus structure are indeed involved in tetramer formation. Furthermore, in the E. coli CTP synthase structures with bound ADP and CTP these areas are found to make interactions with both ADP and CTP. It may be seen from Fig. 6 ▶ that the residues that align with residues that have been established as phosphorylation sites that affect tetramerization in the yeast enzyme (Park et al., 2003 ▶) are located far from the tetramer interfaces. The dimeric S. solfataricus structure does not provide any explanation for their impact on tetramerization.
Figure 6.
Sequence alignment of CTP synthases from S. solfataricus, E. coli and T. thermophilus. Alignment rendering was performed with ESPript (Gouet et al., 1999 ▶). Black bars indicate dimer interfaces, orange bars indicate one dimer–dimer (tetramer) interface, yellow bars indicate the other tetramer interface and blue bars indicate residues that align with residues that have been established as phosphorylation sites that influence tetramerization in the yeast enzyme (Park et al., 2003 ▶). Identical residues in the alignment are marked by white characters in red boxes. Similar residues are shown in red characters, while a blue frame indicates similarity across groups.
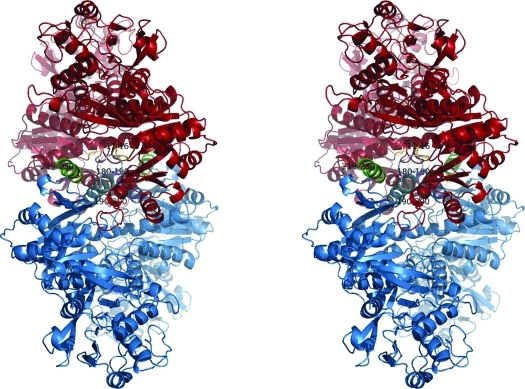
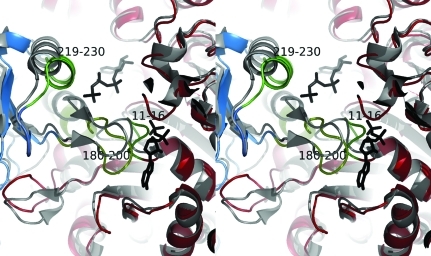
We have superposed the tetramer formed by E. coli CTP synthase (PDB entry 1s1m) with two copies of the S. solfataricus CTP synthase model to form a pseudo-tetramer of the S. solfataricus structure. The pseudo-tetramer is shown in Fig. 7 ▶. In the S. solfataricus pseudo-tetramer the helix from residues 190 to 200 clashes with the same helix from the other dimer; the loop from 180 to 190 also clashes with the loop from 11 to 16 from the other dimer. It is therefore clear that these regions of the structure have to move substantially in order to facilitate tetramerization. In Fig. 8 ▶ we have superposed the E. coli 2ad5 structure with the S. solfataricus pseudo-tetramer and zoomed in on the ADP-binding site. As mentioned above, the P-loop from residues 11 to 16 in the S. solfataricus structure would indeed clash with ADP. Hence, the binding of ADP would reposition this loop to displace the loop and helix that runs from residues 180 to 200, which in turn would reposition the neighbouring helix spanning residues 219–230. Thus, by inference, ATP binding would also induce a new conformation at the dimer–dimer interface which favours tetramerization. It is evident from a comparison of the structure of the S. solfataricus CTP synthase dimer with the structures of the E. coli tetramer, whether unliganded (Endrizzi et al., 2004 ▶) or in complex with CTP and ADP (Endrizzi et al., 2005 ▶), that while the two structures of the E. coli tetramers are very similar at the dimer–dimer interface, the loop movements and displacement of the helices that constitute the dimer–dimer interface are seen in the S. solfataricus structure (Fig. 7 ▶). The latter observation is in agreement with the effect on the oligomeric structure of binding the substrate nucleotides ATP and UTP, which in this context serve to stabilize the dimer–dimer interface of the tetramer that is formed from the more flexible area of the dimer structure.
Figure 7.
The tetramer interface that would be formed between two copies of S. solfataricus CTP synthase (red and blue). Clashes are observed between the helices running from residues 190 to 200 (the helix from the blue subunit is in cyan) and the loop running from residues 180 to 190 (emphasized in light blue) and the loop from residues 11 to 16 from the other subunit (pink). The helix running from residues 219 to 230 is emphasized in green. This figure was prepared in PyMOL (DeLano, 2002 ▶).
Figure 8.
Stereo figure showing the ADP-binding site in E. coli CTP synthase (PDB entry 2ad5, shown in grey; ADP and CTP are shown in black) superposed with the pseudo-tetramer of S. solfataricus CTP synthase (shown in red, blue and green). This figure was prepared in PyMOL (DeLano, 2002 ▶).
Supplementary Material
PDB reference: CTP synthase, 3nva
Acknowledgments
We thank Ms Karen Duus Sørensen for constructing the expression vector. We are also grateful for the beamtime provided at MAX-lab (Lund, Sweden) and for the contribution of the Danish Natural Science Research Council to DANSYNC and acknowledge the support by the European Community Research Infrastructure Action under the FP6 programme ‘Structuring the European Research Area’. This work was supported by a grant from The Danish Council for Research of Nature and Universe. The co-editor is acknowledged for valuable comments on the manuscript.
References
- Afonine, P. V., Grosse-Kunstleve, R. W. & Adams, P. D. (2005). CCP4 Newsl. 42, contribution 8.
- Andersen, J. T., Poulsen, P. & Jensen, K. F. (1992). Eur. J. Biochem. 206, 381–390. [DOI] [PubMed]
- Anderson, P. M. (1983). Biochemistry, 22, 3285–3292. [DOI] [PubMed]
- Bearne, S. L., Hekmat, O. & MacDonnell, J. E. (2001). Biochem. J. 356, 223–232. [DOI] [PMC free article] [PubMed]
- Chang, Y.-F. & Carman, G. M. (2008). Prog. Lipid Res. 47, 333–339. [DOI] [PMC free article] [PubMed]
- Chang, Y.-F., Martin, S. S., Baldwin, E. P. & Carman, G. M. (2007). J. Biol. Chem. 282, 17613–17622. [DOI] [PMC free article] [PubMed]
- Clark, D. J. & Maaløe, O. (1967). J. Mol. Biol. 23, 99–112.
- Collaborative Computational Project, Number 4 (1994). Acta Cryst. D50, 760–763.
- DeLano, W. L. (2002). PyMOL. http://www.pymol.org.
- Deuschle, U., Kammerer, W., Gentz, R. & Bujard, H. (1986). EMBO J. 5, 2987–2994. [DOI] [PMC free article] [PubMed]
- Emsley, P. & Cowtan, K. (2004). Acta Cryst. D60, 2126–2132. [DOI] [PubMed]
- Endrizzi, J. A., Kim, H., Anderson, P. M. & Baldwin, E. P. (2004). Biochemistry, 43, 6447–6463. [DOI] [PMC free article] [PubMed]
- Endrizzi, J. A., Kim, H., Anderson, P. M. & Baldwin, E. P. (2005). Biochemistry, 44, 13491–13499. [DOI] [PMC free article] [PubMed]
- Goto, M., Omi, R., Nakagawa, N., Miyahara, I. & Hirotsu, K. (2004). Structure, 12, 1413–1423. [DOI] [PubMed]
- Gouet, P., Courcelle, E., Stuart, D. I. & Métoz, F. (1999). Bioinformatics, 15, 305–308. [DOI] [PubMed]
- Iyengar, A. & Bearne, S. L. (2003). Biochem. J. 369, 497–507. [DOI] [PMC free article] [PubMed]
- Jancarik, J. & Kim, S.-H. (1991). J. Appl. Cryst. 24, 409–411.
- Jensen, K. F., Houlberg, U. & Nygaard, P. (1979). Anal. Biochem. 98, 254–263. [DOI] [PubMed]
- Jensen, K. F. & Mygind, B. (1996). Eur. J. Biochem. 240, 637–645. [DOI] [PubMed]
- Kabsch, W. (2010). Acta Cryst. D66, 125–132. [DOI] [PMC free article] [PubMed]
- Kleywegt, G. J. (1996). Acta Cryst. D52, 842–857. [DOI] [PubMed]
- Krissinel, E. & Henrick, K. (2007). J. Mol. Biol. 372, 774–797. [DOI] [PubMed]
- Levitzki, A. & Koshland, D. E. Jr (1971). Biochemistry, 10, 3365–3371. [DOI] [PubMed]
- Levitzki, A. & Koshland, D. E. Jr (1972). Biochemistry, 11, 241–246. [DOI] [PubMed]
- Levitzki, A. & Koshland, D. E. Jr (1972). Biochemistry, 11, 247–253. [DOI] [PubMed]
- Lewis, D. A. & Villafranca, J. J. (1989). Biochemistry, 28, 8454–8459. [DOI] [PubMed]
- Lunn, F. A. & Bearne, S. L. (2004). Eur. J. Biochem. 271, 4204–4212. [DOI] [PubMed]
- Lunn, F. A., MacDonnell, J. E. & Bearne, S. L. (2008). J. Biol. Chem. 283, 2010–2020. [DOI] [PubMed]
- Lunn, F. A., Macleod, T. J. & Bearne, S. L. (2008). Biochem. J. 412, 113–121. [DOI] [PubMed]
- MacDonnell, J. E., Lunn, F. A. & Bearne, S. L. (2004). Biochim. Biophys. Acta, 1699, 213–220. [DOI] [PubMed]
- Martin, R. G. & Ames, B. N. (1961). J. Biol. Chem. 236, 1372–1379. [PubMed]
- Painter, J. & Merritt, E. A. (2006). Acta Cryst. D62, 439–450. [DOI] [PubMed]
- Pappas, A., Yang, W.-L., Park, T.-S. & Carman, G. M. (1998). J. Biol. Chem. 273, 15954–15960. [DOI] [PubMed]
- Park, T.-S., O’Brien, D. J. & Carman, G. M. (2003). J. Biol. Chem. 278, 20785–20794. [DOI] [PubMed]
- Robertson, J. G. (1995). Biochemistry, 34, 7533–7541. [DOI] [PubMed]
- Saal, W. von der, Anderson, P. M. & Villafranca, J. J. (1985). J. Biol. Chem. 260, 14993–14997. [PubMed]
- Stura, E. A., Nemerow, G. R. & Wilson, I. A. (1992). J. Cryst. Growth, 122, 273–285.
- Vagin, A. & Teplyakov, A. (1997). J. Appl. Cryst. 30, 1022–1025.
- Vaguine, A. A., Richelle, J. & Wodak, S. J. (1999). Acta Cryst. D55, 191–205. [DOI] [PubMed]
- Wadskov-Hansen, S. L., Willemoës, M., Martinussen, J., Hammer, K., Neuhard, J. & Larsen, S. (2001). J. Biol. Chem. 276, 38002–38009. [DOI] [PubMed]
- Weeks, A., Lund, L. & Raushel, F. M. (2006). Curr. Opin. Chem. Biol. 10, 465–472. [DOI] [PubMed]
- Willemoës, M. (2003). J. Biol. Chem. 278, 9407–9411. [DOI] [PubMed]
- Willemoës, M. (2004). Arch. Biochem. Biophys. 424, 105–111. [DOI] [PubMed]
- Willemoës, M. & Larsen, S. (2003). Arch. Biochem. Biophys. 413, 17–22. [DOI] [PubMed]
- Willemoës, M., Mølgaard, A., Johansson, E. & Martinussen, J. (2005). FEBS J. 272, 856–864. [DOI] [PubMed]
- Willemoës, M. & Sigurskjold, B. W. (2002). Eur. J. Biochem. 269, 4772–4779. [DOI] [PubMed]
Associated Data
This section collects any data citations, data availability statements, or supplementary materials included in this article.
Supplementary Materials
PDB reference: CTP synthase, 3nva


