

Abstract
The mitochondrial membrane potential is used to generate and regulate energy in living systems, driving the conversion of ADP to ATP, regulating ion homeostasis, and controlling apoptosis, all central to human health and disease. Therefore, there is a need for tools to study its regulation in a controlled environment for potential clinical and scientific applications. For this aim, an on-chip tetraphenylphosphonium (TPP+) selective microelectrode sensor was constructed in a microfluidic environment. The concentration of isolated mitochondria (Heb7A) used in a membrane potential measurement was 0.3 ng μL−1, four orders of magnitude smaller than the concentration used in conventional assays (3 μg μL−1). In addition, the volume of the chamber (85 μL) is 2 orders of magnitude smaller than traditional experiments. As a demonstration, changes in the membrane potential are clearly measured in response to a barrage of well-known substrates and inhibitors of the electron transport chain. This general approach, which to date has not been demonstrated for study of mitochondrial function and bio-energetics in generally, can be instrumental in advancing the field of mitochondrial research and clinical applications by allowing high throughput studies of the regulation, dynamics, and statistical properties of the mitochondrial membrane potential in response to inhibitors and inducers of apoptosis in a controlled (microfluidic) chemical environment.
Introduction
In addition to being the main energy producers in eukaryotic cells, mitochondria play a crucial role in regulation of normal cellular functions such as cellular division, differentiation, and apoptosis, and thus homeostasis and carcinogenesis.1–4 In order to improve our understanding of the biochemical nature of these relationships,5–7 there is a need for improved instrumentation and methods to study and diagnosis mitochondrial properties and function. One of the most important physical properties is the mitochondrial membrane potential ΔΨm.
To date, various methods have been used to measure ΔΨm based on either fluorescent probes or electrochemical methods. Because nano-electrodes to impale the mitochondrial membrane in a patch clamp type assay are challenging, many measurements to date have been based on assays of the distribution of lipophilic probe ions across the membrane, whose concentration ratio is related to ΔΨm through the Nernst equation.8–13 The probe ion concentration ratio is either measured through changes in fluorescence intensity or electrochemically through ion selective electrodes (ISEs). The use of on-chip ISE devices has the potential for low cost, simplicity, and facile integration with lab-on-a-chip type systems, which motivates our work in this paper.
Kamo et al.14 reported an ISE membrane potential electrode using tetraphenylphosphonium (TPP+) ions, a lipid-soluble cation, and found that TPP+ can permeate through mitochondrial membranes with 15 times faster diffusion coefficient than other cations such as DDA+ (dibenzyldimethyl ammonium). Since the accumulation of TPP+ ions into the mitochondrial matrix is related to ΔΨm through the Nernst equation and volumetric factors, its value can be determined from the concentration of TPP+ ions.
In this paper, we present the first on-chip TPP+ ISE and demonstrate its application in the measurement of membrane potential in isolated mitochondria. Details of the fabrication of the microfluidic TPP+ selective sensor and preparation of a TPP+ selective membrane and liquid junction reference electrode are described. A sensor test with isolated mitochondria is performed by adding different bioactive compounds successively. The results show that our device can feasibly be applied to analyze mitochondrial bioenergetics in sample concentrations as low as 0.3 ng μL−1 (four orders of magnitude lower than previously published results) and volumes as small as 85 μL (two orders of magnitude smaller than industry standard measurements). Furthermore, by integrating this microsensor into a controlled microfluidic environment, this approach will eventually be instrumental in advancing the field of mitochondrial research and clinical diagnostic applications by allowing high throughput studies of the regulation, dynamics, and statistical properties of the mitochondrial membrane potential in response to inhibitors and inducers of apoptosis in a controlled (microfluidic) chemical environment.
Methods
Theory of operation
The proton motive force generated by the oxidation steps of the electron transport chain subsequently drives the proper functioning of the mitochondria. The relationship between the proton motive force Δp and the mitochondrial membrane potential ΔΨm is given by
| (1) |
where R is the universal gas constant (R = 8.314472 J K−1 mol), T the absolute temperature, and F the Faraday constant (F = 96485.3 C mol−1). Δp depends on both the electrical difference across the inner membrane (ΔΨm) and the pH difference (ΔpH) between the matrix and inner membrane space. The contribution of ΔΨm to the overall value of Δp is much larger than that of the pH changes because of the high buffering capacity of the matrix. Therefore, our experimental design focuses solely on ΔΨm as a valid indicator of Δp and, thus, the overall metabolic status of the mitochondria.
Potentiometry was used as the fundamental electrochemical analysis for the TPP+ ion selective electrode (Fig. 1). The potentiometric sensor consists of two electrodes: a reference and a working electrode, which is the ISE. The ISE has a permselective membrane that can selectively measure the activity of target ions. Target ions in the sample solution diffuse through the ISE membrane into the inner filling solution developing a potential gradient across the ISE membrane. By measuring this potential difference, the TPP+ concentration can be monitored using a voltmeter. Once the TPP+ concentration is known, the membrane potential ΔΨm can be determined using volumetric factors described below.
Fig. 1.

Sensing scheme of TPP+ ISE. The TPP+ ions in the sample medium can freely diffuse through both the ion selective membrane (black) and the mitochondrial inner membrane to reach equilibrium. After the introduction of mitochondria, TPP+ ions are accumulated in the matrix causing changes in the equilibrium concentrations. This change leads to potential differences between the reference and working electrodes. The TPP+ concentration in the medium can be monitored by measuring the potential differences.
Fabrication
The microfluidic TPP+ selective sensor was constructed on a microscope cover glass with PDMS layers. The fabrication steps are schematically illustrated in Fig. 2. Cover glasses were cleaned in Piranha solution (mixture of sulfuric acid and hydrogen peroxide with the ratio of 7 to 3) overnight followed by organic solvent cleaning. First, a thin film of Ti (30 nm) was deposited as a seed layer and then Pd (50 nm) and Ag (2.5 μm) were deposited on the cleaned glass substrate using an electron-beam evaporator (Airco/Temescal CV-8) (Fig. 2(a)). Photolithography was performed with positive photoresist (Shipley 1827) for patterning silver electrodes on the glass substrate. Shipley 1827 was spread out by using a spin coater at 3500 rpm for 30 s with 3 μm thickness and soft-baked at 90 °C for 10 min. The spin-coated glass substrate was exposed to UV-light for 30 s at 6 mW cm−2. After a post-bake at 120 °C for 3 min, the exposed photoresist was removed in developer (MF-319, Microposit).
Fig. 2.
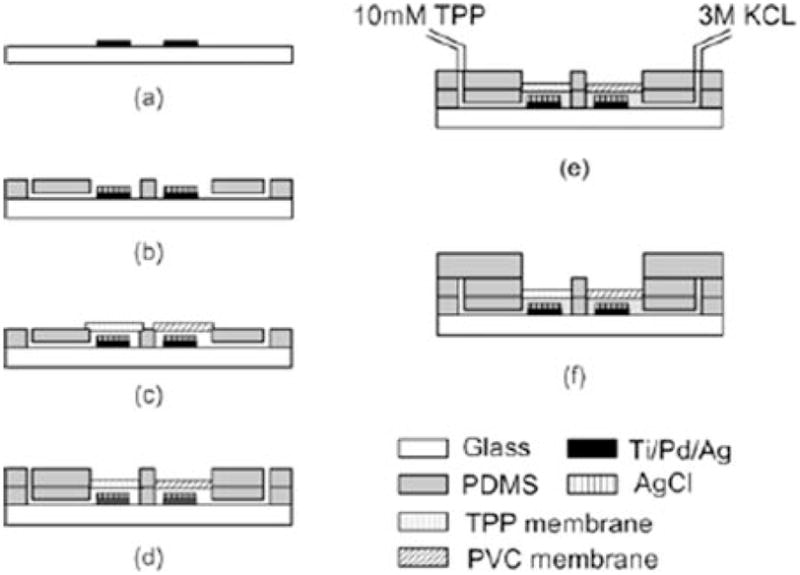
Microfabrication process of microelectrode. (a) Ti/Pd/Ag is deposited and patterned by photolithography on the glass substrate. (b) AgCl is deposited chemically on top of the sensing area, and the 1st PDMS layer with filling solution channels is placed. (c) TPP ion selective membrane and reference protective PVC membrane deposition. (d) The 2nd PDMS layer for secure bonding between membranes and the 1st PDMS layer. (e) Inner filling solutions (10 mM TPP, 3 M KCl) injection through access holes. (f) Assembly of open-ended sensing chamber with volume of 85 μL.
Chlorination of silver (for Ag/AgCl electrode formation) was carried out electrochemically or chemically for both the reference and working electrodes (Fig. 2(b)). The former was performed in 0.1 M HCl solution at a constant current of 5 mA cm−2 for 4 min, and for the latter the silver coated glass substrate was dipped into 0.1 M FeCl3 solution for 40 s without current flow. It was found that the electrode chlorinated with the chemical method in 0.1 M FeCl3 solution works best in terms of robustness and surface morphology. For the sensor characterization and test, only the sensor chlorinated by the chemical method was employed through the study.
The PDMS layer was prepared by a mixture of PDMS pre-polymer (Sylgard 184, Microchem) and a curing agent at a ratio of 10:1. A 7 g mixture was poured onto a 4″ silicon wafer used as a substrate. After curing PDMS in a hot oven at 90 °C for 15 min, the cured PDMS with thickness of 1 mm was cut into the size of a cover glass and stripped out from the wafer. With a surgical blade and a flat-end needle, two L shaped inner filing solution reservoirs were cut in accordance with electrode sensing areas on the glass substrate. For the liquid junction Ag/AgCl reference electrode, polyvinyl chloride (PVC) protective membrane was constructed to keep the concentration of chloride ions in the 3 M KCl inner filling solution constant.15 The PVC membrane solution prepared with 50 wt% PVC powder and 50 wt% 2-nitrophenyl-octylether was dissolved in tetrahydrofuran (THF, Fa. Fluka) and the mixture was dropped onto a cleaned glass substrate followed by curing at room temperature (Fig. 2(c)). The cured membrane was transferred onto the top of the L-shaped reservoir and glued with THF. The TPP+ selective membrane was prepared with a mixture of 4.4 mL of THF, 0.36 mL of dioctyl phthalate, 0.15 g of PVC and 6 mg of Na+TPB− (tetraphenylboron), and poured onto a glass substrate. The mixture was evaporated slowly at room temperature for a few hours. The membrane was carefully glued to the top of the TPP+ reservoir with THF. The 2nd PDMS layer having two openings and four access holes was placed on top of the membranes to secure the bonding of membranes between PDMS layers by pressing down the membranes (Fig. 2(d)). Two inner filling solutions (10 mM TPP+Cl−, 3 M KCl) were introduced into two L-shaped reservoirs through access holes by means of syringes and rubber tubes (Fig. 2(e)). Care should be taken during the introduction of the inner filling solution to avoid air bubbles, which lead to an open sensing circuit. The membranes in the two opening areas are exposed to the medium. For the sensing chamber, the 3rd PDMS layer (4 mm thick) was bonded to the top of the 2nd layer with a chamber volume of 85 μL (Fig. 2(f)).
Experimental set up
The TPP+ selective working electrode and Ag/AgCl reference electrode were connected to the positive and negative input of a voltmeter (Agilent 34401A digital multimeter). The voltmeter was linked to the computer via a GPIB interface (National Instrument, GPIB-USB-HS) for data communication. The voltage signal from the voltmeter was acquired using Labview software, so that simultaneous monitoring of the mitochondrial membrane potential could be achieved.
Isolation of mitochondria
Analysis of mitochondrial membrane potential was carried out with isolated human mitochondria (Heb7A). Heb7A is a HeLa cell-derived line which is commonly used for analytical study in research labs for their unique growth and molecular characteristics. These adherent cells were maintained in log growth phase and cultured in media consisting of MEM-e (Gibco, 11090) supplemented with 10% FCS (Hyclone, SH30072.03), 2 mM L-glutamine (Gibco, 25030), and NEAA (Gibco, 11140). Our mitochondrial isolation protocol was modified from Trounce et al.16 Approximately 107 cells were pelleted and washed in PBS (phosphate buffered saline). Ice-cold H-buffer (210 mM mannitol, 70 mM sucrose, 1 mM EGTA, 5 mM HEPES, 0.5% BSA) was used for all of the subsequent steps of mitochondrial isolation. The cells were physically sheared with 15–20 passes in a cold dounce and centrifuged at low speed (800×g for 5 min) at 4 °C in an Eppendorf 5417R centrifuge. The cell lysate suspension was incrementally clarified to remove the large cell debris through 4 rounds of low speed spins and the mitochondria were then pelleted with 2 rounds of high speed spins (10 000×g for 20 min). An aliquot was washed in BSA-free H-buffer for protein determination using the BCA Protein Assay Kit (Thermo Scientific, Prod# 23227). The isolated mitochondrial sample was diluted in ice-cold respiration buffer for immediate analysis.
Modulation of mitochondrial membrane potential
Using the appropriate substrates and inhibitors, it is possible to modulate the activity of individual OXPHOS (oxidative phosphorylation) complexes to measure the effect on the membrane potential. In our study, we treated isolated mitochondria with compounds specifically targeting complexes I and II in order to measure their effect on ΔΨm. Our strategy was to first add the appropriate substrate to stimulate the activity of the complex, thereby increasing ΔΨm, and follow it with the specific inhibitor which quells the proton pump and diminishes ΔΨm. The substrate combination, pyruvate and malate (PM), feed separately into the Krebs cycle to reinforce each other’s contribution of electrons to complex I (via NADH) thereby stimulating the ejection of protons from the matrix. We then add the potent compound rotenone (Rot), which irreversibly binds and inhibits complex I activity and leads to a cessation of proton pumping with subsequent loss of membrane potential. After inhibition of complex I by rotenone, the addition of succinate (Suc) supports the electron flux through complex II exclusively and channels electrons through this pathway of the electron transport chain (ETC) to allow for the generation of the proton gradient. To inhibit this activity, we then add the substrate analogue malonate (Mal), which binds competitively and specifically to the active site of complex II and shuts down the proton pumping.
Results
Calibration of TPP+ selective electrode
The sensor calibration was performed at various concentrations of TPP+Cl− solution ranging from 10 μM to 10 mM in both respiratory buffer and 0.1 M NaCl solutions at 25 °C while monitoring potential differences between working electrode and reference electrodes. The layer-by-layer sensor design and the fabricated sensor are shown in Fig. 3. Three working electrodes were integrated in the same chip for the future use of parallel measurements with oxygen respiration, demonstrating the potential for the integration of different kind of sensors in the same chip. In the test, one of the three electrodes was used for the measurement. After filling the test chamber with 71 μL of 0.1 M NaCl (or respiration buffer), 2 μL of various concentrations of TPP+Cl− solution were added into the test chamber successively using micropipettes. The measured potential from the fabricated sensors is plotted vs. time in Fig. 4(a) and the arrows indicate the addition of 2 μL TPP+ solution. Upon the addition of solutions, signal spikes were recorded due to the physical impact of dropping solutions into the chamber medium. Once the potential signal stabilized, it maintained a constant level showing that no significant evaporation effect occurred during the test. The signal stabilized within 25 s, which is considered to be the response time (t90) of the electrode.
Fig. 3.
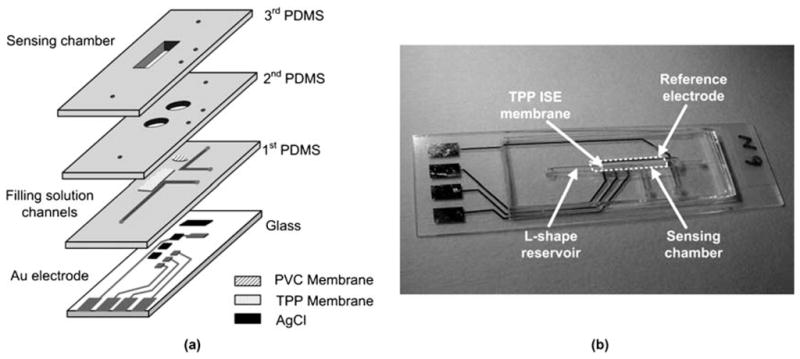
Sensor design. (a) Illustration of layer-by-layer sensor construction. (b) Photograph of the fabricated microfluidic TPP sensor showing assembled PDMS layers with filling solution reservoirs and membranes on top of the glass substrate.
Fig. 4.

Calibration curve of TPP sensor. (a) Characterization was performed in respiration buffer solution (25 °C, pH 7.2) using fabricated TPP+ microelectrode sensors with successive additions (arrows) of 2 μL TPP+ solution (10 μM to 10 mM) resulting in final concentration of 0.3 μM, 3 μM, 30 μM, 300 μM, 600 μM, 900 μM respectively. (b) Sensor response in log scale.
Potential differences increased logarithmically with increase in the concentration of TPP+Cl− solution. Fig. 4(b) shows a linear relationship of measured potential on a logarithmic scale from 3 ×10⁻⁶ M TPP+Cl− with the slope of 53 mV dec−1, close to Nernstian response of 59 mV dec−1. No interfering effect was found during the calibration, representing the high selectivity of the sensor to TPP+ ions. The TPP+ selective electrode was soaked in 10 mM TPP+Cl− solution overnight before calibration and the reference electrode was conditioned in 3 M KCl solution.
After each measurement, the sensing chamber including TPP+ selective membrane was cleaned with DI water several times. When inhibitors and substrates are used during the mitochondrial measurement, 50% ethanol was used to rinse the chamber to avoid interferences from residues on the membranes.
Measurement of mitochondrial membrane potential with isolated mitochondria
The evaluation of the mitochondrial membrane potential was performed with human mitochondria (Heb7A) in respiration buffer (225 mM mannitol, 75 mM sucrose, 10 mM KCl, 10 mM Tris–HCl, 5 mM KH2PO4, pH 7.2). The measurements were repeated 4 times with freshly prepared mitochondria to confirm the performance and the reproducibility of the sensor. The results of the measurements showed reproducible responses under similar conditions. We used 25 ng of isolated mitochondria in 85 μL for the test resulting in a final concentration of 0.29 ng μL−1. The mitochondrial membrane potential (ΔΨm) can be determined using:17
| (2) |
where [TPP+]o, [TPP+]t represent TPP+ concentration in the test chamber before the addition of mitochondria and at time t respectively. Vo is the initial buffer volume in the chamber and Vt represents the final volume in the chamber which includes the total mass (in mg) of mitochondrial protein (P) added in the assay. For our purposes, the mitochondrial matrix volume (Vm) was assumed to be equal to 1 μL mg−1 protein. The partition coefficients describe the innate binding and accumulation of the cationic TPP+ ion to the matrix (Ki) and external (Ko) faces of the inner membrane and are given values of 7.9 μL mg−1 and 14.3 μL mg−1, respectively.18
The results of a typical assay are shown in Fig. 5. The respiration chamber was filled with an initial volume of 71 μL respiration buffer. Once the plot baselined to zero, we introduced 100 μM TPP+Cl− solution to provide a working concentration. We purposely kept the working concentration of [TPP+] ≈ 10 μM to prevent inhibition of respiration.19 After stabilization, isolated mitochondria (5 ng μL−1) were added to the chamber. The fresh mitochondria quickly took in TPP+ from the chamber due to its value of ΔΨm, resulting in a lower TPP+ concentration in the chamber as measured by the ISE. However, as the mitochondria consumed substrates in the respiration buffer, the substrate concentration became depleted, and the magnitude of ΔΨm began to decrease slowly as a result, causing a slow increase in [TPP+] in the chamber.
Fig. 5.
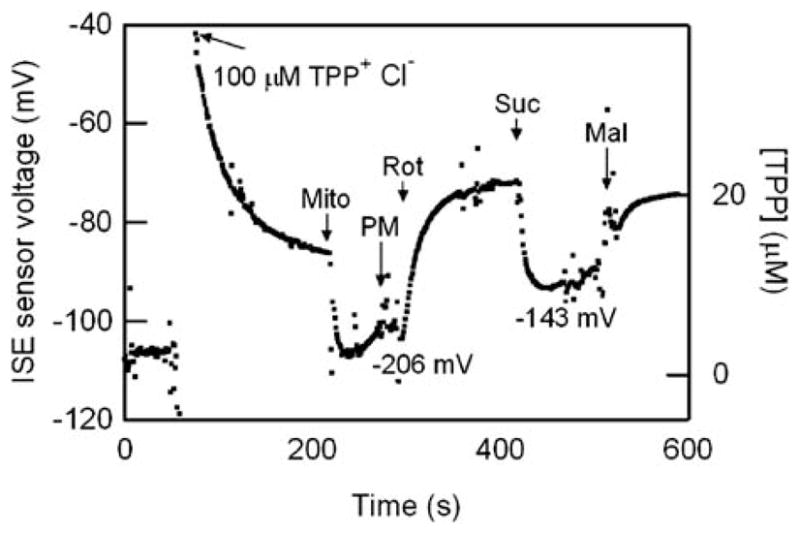
Measurement of [TPP+] and inferred ΔΨm with isolated mitochondria. Arrows indicate successive addition of 100 μM TPP+Cl−, 5 μL of 5 ng μL−1 isolated mitochondria (mito), 10 mM pyruvate (P), 5 mM malate (M), 4 μM rotenone (Rot), 10 mM succinate (Suc), 5 μM malonate (Mal). See text for discussion. (Note the [TPP] scale is not linear).
This slow decrease in the magnitude of ΔΨm was temporarily halted by the addition of complex I substrate PM, which allowed the mitochondria to increase the magnitude of ΔΨm through consumption of these substrates. While there are transients in the data, the slow decrease in the magnitude of ΔΨm is clearly halted by the addition of PM. The complex I inhibitor Rot halts the mitochondrial consumption of PM, leading again to a slow decline in the magnitude of ΔΨm (hence an increase in [TPP]).
The addition of complex II substrate Suc allows the mitochondria again to increase the magnitude of ΔΨm (hence decreasing [TPP]). The addition of complex II inhibitor Mal stops the consumption of Suc, causing again a slow decrease in the magnitude of ΔΨm (thus increasing [TPP]).
These measurements clearly demonstrate the ability of the on-chip ISE to assay meaningful mitochondrial responses to various biochemical stimulants in a controlled, microfluidic environment. We turn next to the device reliability, reproducibility, and sensitivity.
Device-to-device variations, drift, and sensitivity
In Fig. 6, we plot the measured calibration curve for 5 different devices made using identical fabrication techniques. The figure shows there are some device to device variations, but that qualitatively the calibration curves match. Thus, there is still a need to calibrate each devices for each measurement, but the general properties are very reproducible from device to device.
Fig. 6.
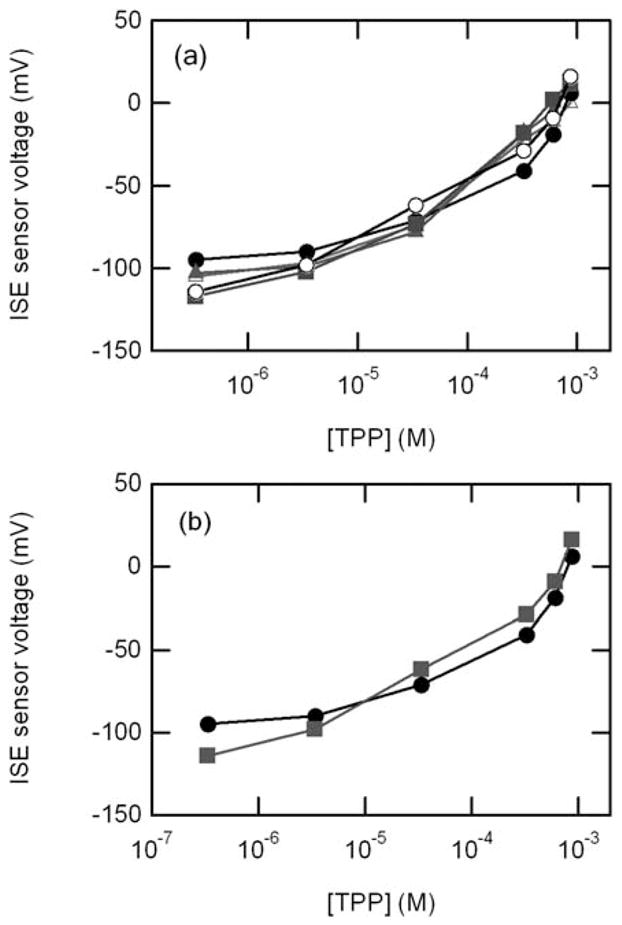
(a) Calibration curves of 5 separate devices. (b) Two different calibration curves for same device indicating drift.
The sensors remain fully functional for over 2 months and after 20 tests. In Fig. 6b, we show that the calibration curve has drifted slightly during these experiments. These drifts indicate that it is important to calibrate the sensor before each experiment if absolute measurement of ΔΨm are important. However, in many experiments it is the changes in ΔΨm that one wants to assay in response to various chemical stimuli, which we discuss next.
While we do not have a complete theoretical accounting of the various statistical noise sources, we can easily quantify the fluctuations in the measured sensor voltage. Using this method, we find the measurement of the sensor voltage gives a statistical uncertainty (standard deviation under steady state conditions) of ~1 mV. This gives rise statistical uncertainty of ~0.1–1 μM on the TPP+ concentration, which corresponds to a statistical uncertainty of ~1 to 10 mV on the inferred value of ΔΨm.
The data have a statistical uncertainty somewhat larger than that of systems with larger electrodes, larger sample volumes, and higher analyte concentration. At present we believe the increased statistical noise is related to the small sensor size, and this will be investigated further in future work. The sensitivity is more than adequate for most biochemical assays, but since this is the first ever on-chip TPP+ sensor, we anticipate that further improvements in sensitivity are possible with additional effort.
Discussion
In order to put our work into perspective, for comparison, various results of mitochondrial membrane potential measurements acquired by other research groups are listed in Table 1.14,17,20,21
Table 1.
Comparison of mitochondrial membrane potential measurements
Clearly, our sensors are applicable for the analysis of mitochondrial bioenergetics and the respiratory chain using sample concentrations and volumes that are 4 and 2 orders of magnitude smaller than prior studies. We used 25 ng of isolated mitochondria in 85 μL for the test resulting in a final concentration of 0.29 ng μL−1. For comparison, 0.5 to 5 μg μL−1 of mitochondria are normally used for membrane potential measurements. This indicates thus a significant advance in technology for mitochondrial potential measurements.
Future generations will incorporate enclosed microfluidic chambers, as well as improved, automated techniques to fabricate the TPP+ sensitive membrane. This approach will be instrumental in advancing the field of mitochondrial research and clinical applications by allowing high throughput studies of the regulation, dynamics, and statistical properties of the mitochondrial membrane potential in response to inhibitors and inducers of apoptosis in a controlled microfluidic chemical environment.
Conclusions
We successfully constructed a microfluidic mitochondrial membrane potential sensor by using microfabrication techniques. The fabricated TPP+ selective electrode showed excellent Nernstian response to changes in the concentration of TPP+ ions. The continuous measurement of mitochondrial membrane potential using isolated mitochondria demonstrates that this sensor can be a useful analytic tool for studies of mitochondrial energetics. Our assay requires four orders of magnitude less concentration and two orders of magnitude less volume than standard methods, indicating the potential of microtechnology and nanotechnology for ultra-sensitive diagnostic and scientific studies of mitochondrial membrane potential, eventually even down to the level of assaying a single mitochondrion.
Acknowledgments
This work was supported in part by the following grants awarded to D.C.W.: NIH-AG24373, NS21328, AG13154, DK73691, CIRM Comprehensive Grant RC1-00353, and a Doris Duke Clinical Interface Grant 2005057. P.B. acknowledges support of this work from NIH National Cancer Institute Grant 1R21CA143351-01. Antonio Davila is supported by the National Science Foundation Lifechips Integrative Graduate Education and Research Traineeship 0549479.
Contributor Information
Douglas C. Wallace, Email: dwallace@uci.edu.
Peter Burke, Email: pburke@uci.edu.
Notes and references
- 1.Wallace DC, Lott MT, Procaccio V. Mitochondrial Genes in Degenerative Diseases, Cancer and Aging. In: Rimoin DL, Connor JM, Pyeritz RE, Korf BR, editors. Emery and Rimoin’s Principles and Practice of Medical Genetics. 5. Churchill Livingstone Elsevier; Philadelphia, PA: 2007. pp. 194–298. [Google Scholar]
- 2.Wallace DC. A mitochondrial paradigm of metabolic and degenerative diseases, aging, and cancer: a dawn for evolutionary medicine. FASEB J. 2006;20:A1474. doi: 10.1146/annurev.genet.39.110304.095751. [DOI] [PMC free article] [PubMed] [Google Scholar]
- 3.Wallace DC. A mitochondrial paradigm of metabolic and degenerative diseases, aging, and cancer: a dawn for evolutionary medicine. Annu Rev Genet. 2005;39:359–407. doi: 10.1146/annurev.genet.39.110304.095751. [DOI] [PMC free article] [PubMed] [Google Scholar]
- 4.Apte SP, Sarangarajan R. Cellular Respiration and Carcinogenesis. Humana Press Springer; New York City: 2009. [Google Scholar]
- 5.Kroemer G, Galluzzi L, Brenner C. Mitochondrial membrane permeabilization in cell death. Physiol Rev. 2007;87:99–163. doi: 10.1152/physrev.00013.2006. [DOI] [PubMed] [Google Scholar]
- 6.Galluzzi L, Larochette N, Zamzami N, Kroemer G. Mitochondria as therapeutic targets for cancer chemotherapy. Oncogene. 2006;25:4812–4830. doi: 10.1038/sj.onc.1209598. [DOI] [PubMed] [Google Scholar]
- 7.Rustin P, Kroemer G. Ernst Schering Foundation Symposium Proceedings. Springer-Verlag; Berlin: 2008. Mitochondria and Cancer; pp. 1–21. [DOI] [PubMed] [Google Scholar]
- 8.Galluzzi L, Vitale I, Kepp O, Seror C, Hangen E, Perfettini JL, Modjtahedi N, Kroemer G. Programmed Cell Death, General Principles for Studying Cell Death, Pt A. Elsevier Academic Press Inc; San Diego: 2008. Methods to Dissect Mitochondrial Membrane Permeabilization in the Course of Apoptosis; pp. 355–374. [DOI] [PubMed] [Google Scholar]
- 9.Galluzzi L, Zamzami N, de La Motte Rouge T, Lemaire C, Brenner C, Kroemer G. Methods for the assessment of mitochondrial membrane permeabilization in apoptosis. Apoptosis. 2007;12:803–813. doi: 10.1007/s10495-007-0720-1. [DOI] [PubMed] [Google Scholar]
- 10.Lemasters JJ, Ramshesh VK. Imaging of Mitochondrial Polarization and Depolarization with Cationic Fluorophores. Methods Cell Biol. 2007;80:283–295. doi: 10.1016/S0091-679X(06)80014-2. [DOI] [PubMed] [Google Scholar]
- 11.Nicholls DG, Ward MW. Mitochondrial membrane potential and neuronal glutamate excitotoxicity: mortality and millivolts. Trends Neurosci. 2000;23:166–74. doi: 10.1016/s0166-2236(99)01534-9. [DOI] [PubMed] [Google Scholar]
- 12.Solaini G, Sgarbi G, Lenaz G, Baracca A. Evaluating mitochondrial membrane potential in cells. Biosci Rep. 2007;27:11–21. doi: 10.1007/s10540-007-9033-4. [DOI] [PubMed] [Google Scholar]
- 13.Baracca A, Sgarbi G, Solaini G, Lenaz G. Rhodamine 123 as a probe of mitochondrial membrane potential: evaluation of proton flux through F0 during Atp synthesis. Biochim Biophys Acta, Bioenerg. 2003;1606:137–146. doi: 10.1016/s0005-2728(03)00110-5. [DOI] [PubMed] [Google Scholar]
- 14.Kamo N, Muratsugu M, Hongoh R, Kobatake Y. Membrane potential of mitochondria measured with an electrode sensitive to tetraphenyl phosphonium and relationship between proton electrochemical potential and phosphorylation potential in steady state. J Membr Biol. 1979;49:105–121. doi: 10.1007/BF01868720. [DOI] [PubMed] [Google Scholar]
- 15.Simonis A, Lüth H, Wang J, Schöning M. New concepts of miniaturised reference electrodes in silicon technology for potentiometric sensor systems. Sens Actuators, B. 2004;103:429–435. [Google Scholar]
- 16.Trounce IA, Kim YL, Jun AS, Wallace DC. Assessment of mitochondrial oxidative phosphorylation in patient muscle biopsies, lymphoblasts, and transmitochondrial cell lines. Methods Enzymol. 1996;264:484–508. doi: 10.1016/s0076-6879(96)64044-0. [DOI] [PubMed] [Google Scholar]
- 17.Labajova A, Vojtiskova A, Krivakova P, Kofranek J, Drahota Z, Houstek J. Evaluation of mitochondrial membrane potential using a computerized device with a tetraphenylphosphonium-selective electrode. Anal Biochem. 2006;353:37–42. doi: 10.1016/j.ab.2006.03.032. [DOI] [PubMed] [Google Scholar]
- 18.Rottenberg H. Membrane potential and surface potential in mitochondria: uptake and binding of lipophilic cations. J Membr Biol. 1984;81:127–138. doi: 10.1007/BF01868977. [DOI] [PubMed] [Google Scholar]
- 19.Brown G, Cooper C. Bioenergetics: A Practical Approach. Oxford University Press; USA: 1995. [Google Scholar]
- 20.Zolkiewska A, Zabocka B, Duszynski J, Wojtczak L. Resting state respiration of mitochondria: reappraisal of the role of passive ion fluxes. Arch Biochem Biophys. 1989;275:580–590. doi: 10.1016/0003-9861(89)90404-9. [DOI] [PubMed] [Google Scholar]
- 21.Rottenberg H. The measurement of transmembrane electrochemical proton gradients. J Bioenerg. 1975;7:61–74. doi: 10.1007/BF01558427. [DOI] [PubMed] [Google Scholar]