

Abstract
Context
It is well-documented that the financial burden of out-of-pocket expenditures for prescription drugs often leads people with medication-sensitive chronic illnesses to restrict their use of these medications. Less is known about the extent to which such cost-related medication underuse is associated with increases in subsequent hospitalizations and deaths.
Objective
We compared the risk of hospitalizations among 5401 and of death among 6135 middle-aged and elderly adults with one or more cardiovascular diseases (diabetes, coronary artery disease, heart failure, and history of stroke) according to whether participants did or did not report restricting prescription medications because of cost.
Design and Setting
A retrospective biannual cohort study across 4 cross-sectional waves of the Health and Retirement Study, a nationally representative survey of adults older than age 50. Using multivariate logistic regression to adjust for baseline differences in sociodemographic and health characteristics, we assessed subsequent hospitalizations and deaths between 1998 and 2006 for respondents who reported that they had or had not taken less medicine than prescribed because of cost.
Results
Respondents with cardiovascular disease who reported underusing medications due to cost were significantly more likely to be hospitalized in the next 2 years, even after adjusting for other patient characteristics (adjusted predicted probability of 47% compared with 38%, P < 0.001). The more survey waves respondents reported cost-related medication underuse during 1998 to 2004, the higher the probability of being hospitalized in 2006 (adjusted predicted probability of 54% among respondents reporting cost-related medication underuse in all 4 survey waves compared with 42% among respondents reporting no underuse, P < 0.001). There was no independent association of cost-related medication underuse with death.
Conclusions
In this nationally representative cohort, middle-aged and elderly adults with cardiovascular disease who reported cutting back on medication use because of cost were more likely to report being hospitalized over a subsequent 2-year period after they had reported medication underuse. The more extensively respondents reported cost-related underuse over time, the higher their adjusted predicted probability of subsequent hospitalization.
Keywords: insurance, health care expenditures, prescription medications, chronic illness, health services accessibility
As the US population ages, the prevalence of chronic disease increases, and clinical trials establish the effectiveness of a growing number of medications for chronic conditions, prescription drug use and costs are increasing dramatically. From 1997 to 2007, the number of prescriptions filled increased by 72%, to 3.8 billion in 2007.1 During this same period, the percentage of Americans taking at least one prescription medication rose to more than 50%, and the average number of prescriptions per person more than doubled.2 Nine in 10 adults 65 years or older use prescription medications, half of whom use 5 or more prescriptions simultaneously.3 Over the past decade, patients themselves are bearing more of the costs of these prescription medications; the proportion of personal health expenses going to prescription medications has increased more than 10% annually in every year since 1997.4,5
For eligible adults, the introduction of Medicare part D greatly increased rates of prescription medication coverage–leading to decreases in many Medicare D enrollees’ out-of-pocket spending for medications.6,7 Yet, adults who are enrolled in Medicare part D still pay on average $83 a month out-of-pocket for prescription medications, leaving cost pressures a significant barrier to medication adherence for these patients.8
Significant rates of under-use of medications due to the burden of out-of-pocket cost have been documented, especially among vulnerable populations.9–12 In addition, both cross-sectional studies4,10,13–15 and prospective cohort studies16–18 have found associations between medication cost restriction and adverse health outcomes. Time-series analyses have shown that public sector measures limiting drug coverage lead to fewer filled prescriptions of essential medications (such as insulin)19,20 and to increased nursing home admissions21 and utilization of acute care services.22–24
More generally, poor medication adherence has been associated with higher rates of hospitalization both among Medicare beneficiaries aged 65 and older13 as well as among adults under age 65.25 One study found that the number of hospital bed-days associated with medication underuse increased most rapidly for those diagnoses that have experienced the greatest increase in prescriptions.26 To date, however, less is known about the association between medication underuse due to cost and subsequent hospitalizations and death, especially among adults at higher risk for hospitalization and death due to medication-sensitive conditions such as cardiovascular disease.
To address these gaps in knowledge, we examined reported cost-related medication underuse and subsequent hospitalizations and deaths among individuals aged 51 to 85 years with cardiovascular disease (coronary artery disease, heart failure, prior stroke, or diabetes). We conducted a cohort study using Health and Retirement Study (HRS) data collected between 1998 and 2006 to answer the following research question: Is cost-related medication restriction among middle aged and older adults with cardiovascular disease associated with subsequent increased rates of hospitalizations or death? We hypothesized that restricting medication use because of out-of-pocket costs would contribute to higher rates of hospitalizations and death even after controlling for socio-demographic characteristics in the baseline year. We then examined whether any independent effects of restricting medication use due to cost on hospitalization and death remained significant after controlling for reported health status, number of comorbidites, and psychiatric diagnoses in the baseline year. The longitudinal nature of the HRS further enabled us to explore the association between the number of years with medication restriction reported and the probability of hospitalization in later survey waves.
METHODS
Overall Study Population
The HRS is a nationally representative, longitudinal study of over 30,000 individuals.16 The HRS over-samples blacks and Latinos and gathers in-depth economic, financial, and health information from respondents. Telephone or in-person interviews are conducted every 2 years.8
We used data from the 1998 to 2006 biannual surveys. Since 1998, the HRS represents the US population over age 50 (Appendix 1, Supplemental Digital Content 1, available online at: http//links.lww.com/MLR/A55). HRS respondents were asked about cost-related medication restriction in the 1998 wave and then in each subsequent 2-year survey wave. A total of 21,384 respondents participated in 1998, 19,580 in 2000, 18,167 in 2002, 20,147 in 2004, and 18,469 in 2006.
We limited our analyses to the 6389 respondents who reported having at least one cardiovascular disease (diabetes, coronary artery disease, heart failure, history of stroke) and who were 51 to 85 years old in the 1998 baseline year. Of these, 36 (0.6%) had missing values in at least one of the baseline covariates. Among 6353 respondents, 952 (15.0%) were excluded from the analysis sample for the outcome of hospitalization due to death or missing responses (See Fig. 1 for detail) and 218 (3.4%) were excluded from the analysis sample for the outcome of death due to missing responses. There were no significant differences in baseline characteristics other than race between respondents who never had missing responses during 2000 to 2006 and those who did not respond at least once during 2000 to 2006 (Appendix 2, Supplemental Digital Content 2, available online at: http//links.lww.com/MLR/A56). Our final sample for the main analyses consisted of 5401 respondents for the analyses of hospitalization and 6135 for the analyses of death (Appendix 3, Supplemental Digital Content 3, available online at: http//links.lww.com/MLR/A57).
FIGURE 1.

Sample distribution of outcome variables.
Dependent Variables
Each respondent was asked to answer “yes” or “no” in each wave to the following question “In the last 2 years, have you been a patient in a hospital overnight?” If the response to this question was “Don’t know,” “Refused” or “missing,” we considered that response as missing for the analyses. Our dependent variable for hospitalization was coded 0 “Not hospitalized” versus 1 “Hospitalized.”
We ascertained deaths using the information on year or month of death in the HRS exit file. HRS conducts exit interviews for deceased respondents through proxy informants, often a spouse or other family member. We created a dichotomous dependent variable for death coded 0 “did not die” versus 1 “died.” Participants who died were assigned to the category of “Died” for all subsequent years after the death year.
Independent Variables
In each survey wave, HRS respondents were asked: “At any time in the last 2 years have you ended up taking less medication than was prescribed for you because of the cost?” Participants were then classified into whether they answered, “yes,” (coded 1) or “no” (coded 0) to this question. This was our principal independent variable. We adjusted multivariable models for age, sex, race (white vs. minority), household net worth (quintile) using the net value of total wealth excluding second home, which is calculated as the sum of all wealth components less all debt,27 living arrangement, educational level, number of cardiovascular comorbidities, presence of a psychiatric diagnosis, and self-reported health-status (assessed with the question, “Would you say your health is excellent, very good, good, fair, or poor?”). We did not include out-of-pocket prescription drug costs or insurance coverage as covariates to avoid over adjustment for these factors, both of which were highly correlated with medication restriction.
In the baseline year, 1998, 36 eligible respondents were missing values in any baseline covariates. However, for the following years (2000–2004), there were missing values for the variable of medication restriction associated with death: If respondents died in year T (prior to interview point in year T) those subjects dropped out of the analysis sample in year T and subsequent years, due to missing values in medication restriction. If we limited the sample to only those with nonmissing values for baseline covariates (age, gender, race, living arrangement, education, net wealth, number of cardiovascular comorbidities, psychiatric diagnosis, self-reported health status in 1998), the numbers of respondents were 5401 for analyses of hospitalization and 6135 for death. If we also restricted the sample to include only those respondents with nonmissing values for cost-related medication restriction and other covariates, the analysis sample size ranged from 3495 to 5280 across survey years for the analyses of hospitalization and from 3959 to 5997 for the analyses of death.
Analyses
When survey weights are included, the 1998 HRS sample we used is representative of the US community-dwelling population over age 50. For this reason and to account for the complex sample design of the HRS, we included baseline survey weights for longitudinal analyses and the complex sample design variables for all analyses. We summarized baseline characteristics of respondents using descriptive statistics. We then performed separate bivariate and multivariate logistic regression analyses to assess the relationship between cost-related medication restriction and subsequent hospitalization or death.
We employed 2 separate estimation strategies with logistic regression models. First, to examine more proximate effects of cost-related medication restriction, we examined whether medication restriction in survey year T, is associated with probabilities of hospitalization during the next survey wave (T + 1), conducted 2 years after survey year T. Second, to view the cumulative effects of cost-related medication underuse we estimated odds ratios of hospitalization in 2006 by medication restrictions during 4 prior survey years (1998, 2000, 2002, and 2004). In our multivariate models, we used 2 sets of controls: control I contains information on respondents’ sociodemographic characteristics (age, gender, race, living arrangement, education, and wealth). Control II contains information on health (number of cardiovascular diseases, indicator of having psychiatric problems diagnosed, and self-reported health status) in the baseline survey year. We repeated all of the above analyses including an interaction term between age and medication restriction because we hypothesized that older adults may be more vulnerable to negative health consequences of cost-related underuse. We also examined the interaction of health status and decreased use of medication because of cost.
To make interpretation of our logistic regression estimate results easier, we present predicted probabilities of ‘Hospitalized’ and ‘Died’ with respect to restricting medication. Predicted probabilities were calculated with STATA 10, which uses the cdf for logistic distribution with variance π2/3. Parameters were estimated from multivariate logistic regression and covariates were evaluated at mean values with the exception of the dichotomized medication restriction variable.28
Regression diagnostic procedures yielded no evidence of substantive multicollinearity, heteroscedasticity, or overly influential outliers in any of the models. We performed all analyses with STATA 10,29 using publicly available data files from the surveys, which were approved by an institutional review board at the University of Michigan. The data used for this study contained no unique identifiers, so respondent anonymity was maintained.
RESULTS
Of the 6353 respondents with cardiovascular disease who participated in the 1998 study wave, 1241 (19.5%) reported cutting back on medication use because of cost in at least one survey wave during 1998 to 2004. A total of 3994 (62.9%) respondents were hospitalized. Figure 1 presents sample distributions of the outcome variables for each wave between 1998 and 2006. Of the 6353 subjects with cardiovascular disease between the ages of 51 and 85 in 1998, 9% died during 2000, and 34% died by 2006.
Table 1 presents baseline characteristics of respondents by medication restriction in the baseline year (1998). A total of 9.5% of respondents reported having restricted medication use due to cost during the prior 2 years. The table indicates that respondents who reported restricting medication use due to cost were relatively more likely to be younger, female, black, unmarried, and less educated, in lower income. Restrictors tended to have more comorbidities, presence of a psychiatric diagnosis and to report poor health status in the baseline year.
TABLE 1.
Baseline Year Sample Summary (N = 6353)
| Variable | Nonrestrictor (N = 5802) | Restrictor (N = 551) | P |
|---|---|---|---|
| Age | <.001 | ||
| ≤64 | 2123 (38.6) | 274 (52.2) | |
| 65–74 | 1997 (34.5) | 179 (31.1) | |
| 75–84 | 1682 (27.0) | 98 (16.7) | |
| Gender | <.001 | ||
| Men | 2934 (51.5) | 188 (38.3) | |
| Women | 2868 (48.5) | 363 (61.7) | |
| Race | <.001 | ||
| White | 4666 (85.8) | 365 (73.5) | |
| Black | 934 (10.6) | 145 (19.7) | |
| Other | 202 (3.6) | 41 (6.9) | |
| Living arrangement | <.001 | ||
| Married | 3678 (62.4) | 289 (48.5) | |
| Unmarried living w/other | 714 (13.2) | 117 (21.2) | |
| Unmarried living | 1410 (24.4) | 145 (30.3) | |
| Education (yr) | <.001 | ||
| <12 | 2078 (32.3) | 291 (49.0) | |
| 12 | 1921 (33.8) | 148 (26.4) | |
| >12 | 1803 (33.9) | 112 (24.7) | |
| Net worth | <.001 | ||
| ≤42,900 | 1783 (28.8) | 325 (58.2) | |
| 42,901–129,000 | 1532 (26.3) | 126 (23.2) | |
| 129,001–310,900 | 1259 (22.6) | 65 (12.2) | |
| ≥310,901 | 1228 (22.3) | 35 (6.4) | |
| No. comorbidities | <.001 | ||
| 1 | 4291 (75.2) | 362 (66.6) | |
| 2 | 1147 (18.8) | 137 (24.1) | |
| ≥3 | 364 (6.0) | 52 (9.3) | |
| Psychiatric problem diagnosed | .005 | ||
| No | 4743 (82.8) | 363 (66.1) | |
| Yes | 1059 (18.3) | 188 (33.9) | |
| Self-reported health status | <.001 | ||
| Excellent | 166 (3.3) | 7 (1.4) | |
| Very good | 823 (15.2) | 24 (5.2) | |
| Good | 1840 (32.5) | 97 (17.9) | |
| Fair | 1817 (30.7) | 191 (32.2) | |
| Poor | 1156 (18.4) | 232 (43.3) |
Association Between Medication Restriction, T and Subsequent Hospitalization, T + 1
Table 2 presents the predicted probabilities of hospitalized and died in the first follow-up survey (T + 1) after cost-related medication underuse was reported in survey year T. Respondents reporting cost-related medication restriction in year T were significantly more likely to report having been hospitalized at the next survey wave T + 1. For example, in bivariate analysis, the predicted probability of “Hospitalized” was 37.3% among respondents reporting no cost-related medication underuse, compared with 49.9% among respondents who reported experiencing cost-related medication underuse. Controlling for baseline health characteristics (control II) as well as demographic/socio-economic variables (control I), the difference in reported hospitalizations between the 2 groups became smaller but remained significant (37.8% vs. 47.0%, P < 0.001). Figure 2 presents the predicted probabilities of hospitalization by cost-related medication restriction and age, without controlling for baseline mental and physical health conditions (panel A), and in the fully adjusted model (panel B).
TABLE 2.
Cost-Related Medication Restriction Reported at Year T and Hospitalization Reported at Next Survey Wave T + 1 (Age 51–85, N = 17,290 Observations*, Weighted)
| Bivariate | Control I | Control I + II | |
|---|---|---|---|
| Odds ratio (95% CI) | 1.67 (1.41–1.99) | 1.67 (1.42–1.96) | 1.46 (1.24–1.72) |
| Predicted probability (%) | |||
| Not restrictor | 37.3 | 37.6 | 37.8 |
| Restrictor | 49.9 | 50.1 | 47.0 |
Logistic models are used to estimate odds ratios and obtain predicted probabilities of being hospitalized in the next survey wave.
Control I includes respondent’s age, gender, race, education, living arrangement and net worth in 1998. Control II includes number of cardiovascular comorbidities, indicator of having psychiatric problems diagnosed and self reported health status in 1998.
This number of observations comes from 5,401 respondents who met the following criteria: (i) age 51–85 in 1998, (ii) at least one cardiovascular disease in 1998, (iii) non-missing covariates in 1998, (iv) non-missing values for the variable of cost-related medication underuse in T (1998–2004), and (v) non-missing outcome variable in T + 1 (2000–2006), and (vi) alive in T + 1.
FIGURE 2.
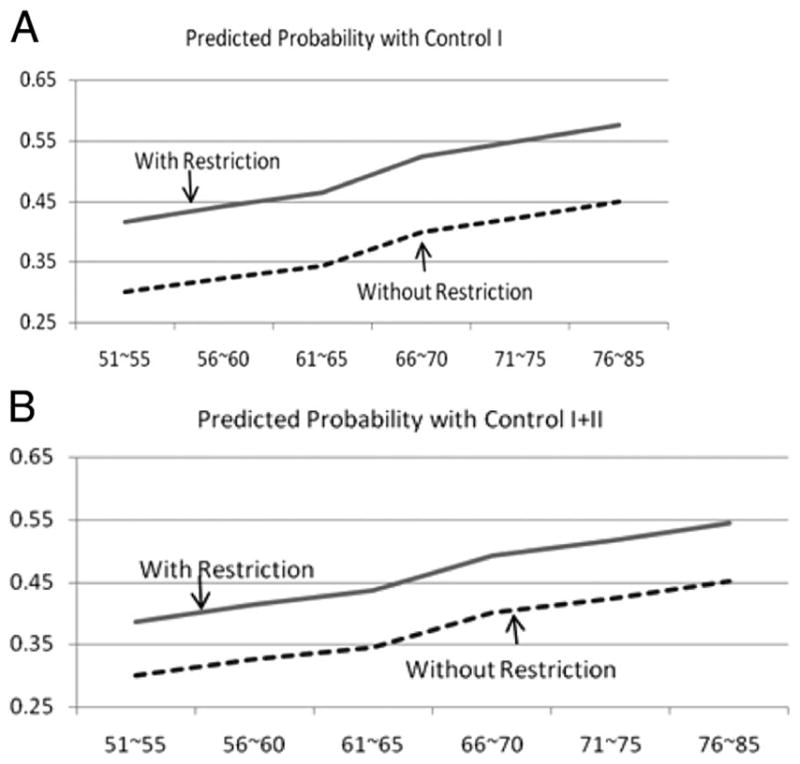
Predicted probability of subsequent hospitalization in the next survey wave T + 1 by age, cost-related medication underuse, and self-reported health status. Multivariate logistic models are used to obtain predicted probabilities of being hospitalized during the next survey wave. Control I includes respondent’s age, gender, race, education, living arrangement, and net worth in 1998. Control II includes number of cardiovascular comorbidities, indicator of having psychiatric problems diagnosed and self-reported health status in 1998.
There were no significant interactions between age and cost-related medication restriction or between health status and medication restriction in these or any of our analyses.
Association Between Prior Medication Restrictions, 1998 to 2004, and Subsequent Hospitalization, 2006
To examine in which years during 1998 to 2004 reporting cost-related medication restriction was associated with rates of hospitalization in 2006, we restricted the sample to those who were alive in 2004 and included all 4 indicators of restricting medication due to cost in each survey wave in the logistic regression. Results are summarized in Table 3. Reporting cost-related medication underuse in the most recent wave prior to 2006 (2004) was significantly related with greater odds of hospitalization in 2006. Moreover, the predicted probability of hospitalization in 2006 was 53.7% if an individual had never reported cost-related medication underuse from 1998 to 2004 and 41.7% if an individual had reported medication restriction in all survey waves, 1998 to 2004.
TABLE 3.
Cost-Related Medication Restriction During 1998–2004 and Hospitalization in 2006 (Age 51–85, N = 3389*, Weighted)
| Bivariate | Control I | Control I + II | |
|---|---|---|---|
| Odds ratio (95% CI) | |||
| Restricted, 1998 | 1.16 (0.87–1.53) | 1.15 (0.87–1.53) | 1.07 (0.80–1.44) |
| Restricted, 2000 | 1.35 (0.97–1.88) | 1.28 (0.92–1.79) | 1.22 (0.88–1.68) |
| Restricted, 2002 | 0.82 (0.59–1.14) | 0.81 (0.58–1.13) | 0.77 (0.54–1.10) |
| Restricted, 2004 | 1.63† (1.20–2.21) | 1.67‡ (1.25–2.21) | 1.62† (1.20–2.18) |
| Predicted probability (%) | |||
| Never restricted, 1998–2004 | 40.6 | 41.2 | 41.7 |
| Restricted in all survey waves, 1998–2004 | 58.7 | 58.1 | 53.7 |
Logistic models are used to estimate odds ratios and obtain predicted probabilities of being hospitalized in 2006.
Control I includes respondent’s age, gender, race, education, living arrangement and net worth in 1998. Control II includes number of cardiovascular comorbidities, indicator of having psychiatric problems diagnosed and self-reported health status in 1998.
This number is based on the following sample restrictions: (i) age 51– 85 in 1998; (ii) at least one cardiovascular disease in 1998; (iii) non-missing covariates in 1998; (iv) non-missing in the variable for cost-related medication underuse for 1998 –2004; (v) non-missing in the outcome variables in 2006; and (vi) alive in 1998 –2006.
Association Between Medication Restriction and Subsequent Death
In contrast to hospitalization, after controlling for baseline health status, there was no statistically significant difference in deaths between respondents who did and those who did not report underusing medications due to cost (Table 4). Conditional on being alive in 2004, medication restriction between 1998 and 2004 was not a significant predictor of death in 2004.
TABLE 4.
Cost-Related Medication Restriction Reported at Year T and Death at Each of Next Four Survey Waves* (Age 51–85)
| Bivariate | Control I | Control I + II | |
|---|---|---|---|
| T + 1 (N = 19,651) | |||
| Odds ratio | 1.00 (0.82–1.22) | 1.13 (0.92–1.39) | 0.92 (0.75–1.13) |
| Predicted probability | |||
| Not restrictor | 10.7% | 9.2% | 8.6% |
| Restrictor | 10.6% | 10.4% | 8.0% |
| T + 2 (N = 15,554) | |||
| Odds ratio | 0.99 (0.80–1.22) | 1.09 (0.88–1.36) | 0.89 (0.72–1.10) |
| Predicted probability | |||
| Not restrictor | 19.3% | 17.2% | 16.5% |
| Restrictor | 19.1% | 18.6% | 14.9% |
| T + 3 (N = 11,142) | |||
| Odds ratio | 1.08 (0.89–1.31) | 1.20 (0.97–1.48) | 0.96 (0.77–1.19) |
| Predicted probability | |||
| Not restrictor | 27.5% | 25.7% | 25.1% |
| Restrictor | 29.0% | 29.4% | 24.3% |
| T + 4 (N = 6245) | |||
| Odds ratio | 1.05 (0.82–1.34) | 1.23 (0.94–1.62) | 0.94 (0.72–1.22) |
| Predicted probability | |||
| Not restrictor | 34.7% | 34.4% | 34.6% |
| Restrictor | 35.9% | 39.3% | 33.1% |
Logistic models are used to estimate odds ratio and obtain predicted probabilities of death.
Control I includes respondent’s age, gender, race, education, living arrangement and net worth in 1998. Control II includes number of cardiovascular comorbidities, presence of psychiatric diagnosis, and self-reported health status in 1998.
This number of observations comes from 6153 respondents who met the following criteria: (i) age 51–85 in 1998; (ii) at least one cardiovascular disease in 1998; (iii) non-missing covariates in 1998; (iv) non-missing values for variable of cost-related medication underuse during 1998–2004; and (v) non-missing outcome variables in 2000–2006.
Sensitivity Analyses
To address potential bias due to missing responses in hospitalization, we conducted 2 sensitivity analyses to test the robustness of our findings of a significant, independent association between reporting cost-related medication underuse and subsequent hospitalizations. First, using the Markov Chain Monte Carlo method, we examined the distribution of odds ratios of hospitalization based on the analysis sample with all subjects, including those with missing values in the outcome variables. At each step, missing values were drawn based on the posterior distributions. With 5000 sampling, results are summarized in Table 5. To address possible endogeneity of missing responses, we investigated the sensitivity of restricting medication on hospitalization by using a selection model. To implement this, we specified another multivariate logistic regression model for the selection equation with an indicator of nonmissing responses in hospitalization. Then we estimated parameters using multiprocess maximum likelihood estimators by varying correlations of residuals in 2 equations. A greater correlation means that selected (nonmissing) subjects are more likely to be hospitalized controlling for covariates. Table 6 summarizes the odds ratios of hospitalization under different correlations. In sum, results from these sensitivity analyses suggest our result in the analysis of hospitalization is robust.
TABLE 5.
Distribution of Odds Ratios of Hospitalization (Control I + II) Using Markov Chain Montecarlo Simulation* (N = 18,253, Sample = 5000)
| Mean | Std | 2.5%–97.5% | MC Error |
|---|---|---|---|
| 1.276 | 0.071 | (1.143–1.415) | 0.001 |
For these analyses, we used the analysis sample with all subjects, including those with missing values in the outcome variable. At each step, missing values were drawn based on the posterior distributions.
TABLE 6.
Odds Ratios of Hospitalization Setting Missing Values to Different Likelihoods of Being Hospitalized* Using Multi-Process Maximum Likelihood Estimators (N = 18,253, Weighted)
| Correlations of Residuals Between Selection and Main Equations (Control I + II) |
|||||
|---|---|---|---|---|---|
| −0.75 | −0.5 | 0 | 0.5 | 0.75 | |
| Odds ratio | 1.548 | 1.548 | 1.548 | 1.547 | 1.547 |
| Standard error | 0.002 | 0.002 | 0.002 | 0.002 | 0.002 |
A greater correlation means that selected (non-missing) subjects are more likely to be hospitalized controlling after covariates.
We repeated these analyses with our analytic sample with death as an outcome and continued to find no significant independent association between cost-related medication restriction and death.
DISCUSSION
In this nationally representative cohort, after adjusting for baseline sociodemographic and health characteristics, we found significantly increased hospitalization rates among middle-aged and older adults with cardiovascular disease who reported restricting medication use due to cost. Respondents who reported cutting back on medication use because of cost were significantly more likely to report being hospitalized in the 2-year period after they had reported medication underuse, and the more survey waves in which respondents reported cutting back on medication use because of cost, the higher the adjusted predicted probability of being hospitalized in 2006.
By following a nationally representative cohort of adults with baseline cardiovascular disease over an 8-year period and examining hospitalization rates subsequent to reported cost-related medication underuse, this study builds on prior work showing a cross-sectional association between self-reported cost-related medication underuse and health outcomes.4,10,13–15 Our findings also complement recent studies assessing the association between overall medication adherence and subsequent health outcomes and use for adults with a range of different chronic conditions.30 Sokol et al, for example, found that among adults with diabetes and hypercholesterolemia, overall medication adherence was associated with lower disease related medical costs. For those conditions, higher prescriptions medication costs among those who were most adherent to medications were more than offset by medical cost reductions from decreased emergency room use and hospitalizations, leading to a net reduction in overall health care costs. For all medication-sensitive conditions they examined—diabetes, hypertension, hypercholesterolemia, and heart failure—hospitalization rates were significantly lower for patients with high medication adherence. In their analyses of health care costs, they found that adherence-based savings in medical costs were driven by reductions in hospitalization rates at higher levels of medication adherence.25
Multiple studies have found relatively low adherence with medication therapy for chronic diseases such as cardiovascular disease: with some studies finding rates as low as 50%.25 Poor adherence due to out-of-pocket medication costs—in this study approximately 10% of respondents and in other national studies up to 20%—represents a relatively small subset of patients with poor medication adherence.31,32 However, addressing cost barriers is less complex and potentially more effective than addressing the other often multi-factorial barriers to medication adherence, such as treatment complexity, unpleasant side effects, and cognitive barriers to regular medication use that many older patients face.31,33
Indeed, recognizing that increased cost-sharing—the predominant market trend in health care today—may present a barrier to the management of chronic diseases, payers are increasingly lowering beneficiary costs for high value medications—particularly in cases where evidence suggests the potential to prevent costly complications.34,35 This is, in essence, the core concept behind value-based insurance design,36 which posits that making certain essential therapies more affordable can increase adherence, resulting in improved patient outcomes and subsequent reductions in long-term medical costs. Although several employers and insurers have adopted value-based insurance design-type benefit packages and are reporting favorable results in the lay press,37,38 the results of rigorous evaluations are only just starting to be published, but appear promising.39
Our study adds to the growing body of evidence suggesting that reducing out-of-pocket medication costs may have both clinical and economic value for high-risk, medication-sensitive conditions such as cardiovascular disease. As drug costs continue to escalate and the numbers of adults with chronic illnesses grow, a central challenge for public and private payers will be to craft benefit packages that provide appropriate coverage, while taking into account both the cost of prescription coverage and downstream costs of medication-preventable complications.10,23,36,40,41 Longitudinal analyses will need to track the effects of different cost-sharing approaches to prescription coverage to compare how they affect use of essential medicines, health outcomes, and costs. Moreover, future research should continue to probe the question of whether more extensive prescription medication coverage among adults with chronic illnesses might in fact be associated not only with clinical benefit but with greater costs savings.42–45 It will also be important to better quantify the extent to which programs that reduce patients’ out-of-pocket costs differentially affect the medication adherence, health care use and costs, and health outcomes of patients with different demographic and clinical characteristics. When increased drug use is driven by guideline-concordant therapy, it may provide a net economic return.
Several limitations may affect interpretation of our results. First, the study is based on survey data and therefore subject to errors associated with self-report. Previous studies, however, have evaluated the validity and reliability of self-reported health information and shown excellent agreement between administrative or medical records and self-reports for conditions such as hypertension, diabetes, and stroke, medications use, and hospitalizations.46–50 Second, as noted above, the differences we found may be due to other unmeasured factors associated with medication restriction (eg, lifestyle risk factors, other health differences between the groups). If this were the case, however, one might expect cost-related medication underuse also to be independently associated with higher odds of death, which was not the case. Third, although this study represents one of the longest follow-up periods of to date (with the longest possible interval between cost-related medication underuse and outcomes of 8 years), the time of follow-up for the longitudinal outcomes we assessed was still relatively short. One could hypothesize that the long-term effects of sustained cost-related medication restriction would be even more severe than those we found in this study.
In conclusion, middle-aged and older adults with cardiovascular disease who reported cutting back on their medication use because of costs were significantly more likely to report being hospitalized in the subsequent 2 years than those who had no cost-related medication underuse. Moreover, there was an incremental increase in probability of being hospitalized in 2006 according to the number of prior survey waves from 1998 to 2004 that respondents reported cost-related medication under-use. Our findings contribute to the evidence that costs of potentially avoidable hospitalizations among high-risk patients may outweigh the costs associated with broadening insurance coverage for clinically essential medications, thereby minimizing patients’ out-of-pocket cost pressures.
Supplementary Material
Acknowledgments
The National Institute on Aging (NIA) provided funding for the Health and Retirement Study (HRS) (U01 AG09740), data from which were used for this analysis.
Footnotes
Supplemental digital content is available for this article. Direct URL citations appear in the printed text and are provided in the HTML and PDF versions of this article on the journal’s Web site (www.lww-medicalcare.com).
References
- 1. [Accessed December 17, 2008];IMS Health Website. 2008 Available at: http://www.imshealth.com.
- 2.Press TA. [Accessed December 14, 2008];Americans Taking Prescription Drugs in Greater Numbers. 2008 Available at: http://www.globalaging.org/health/us/2008/drugs.htm.
- 3.Safran DG, Neuman P, Schoen C, et al. Prescription drug coverage and seniors: findings from a 2003 national survey. Health Aff (Millwood) 2005;(Suppl Web Exclusives):W5–152. W155–166. doi: 10.1377/hlthaff.w5.152. [DOI] [PubMed] [Google Scholar]
- 4.Steinwachs DM. Pharmacy benefit plans and prescription drug spending. JAMA. 2002;288:1773–1774. doi: 10.1001/jama.288.14.1773. [DOI] [PubMed] [Google Scholar]
- 5.Foundation TKF. [Accessed December 14, 2008];Prescription Drug Trends. 2008 Available at: http://www.kff.org/rxdrugs/upload/3057_07.pdf.
- 6.Lichtenberg FR, Sun SX. The impact of Medicare Part D on prescription drug use by the elderly. Health Aff (Millwood) 2007;26:1735–1744. doi: 10.1377/hlthaff.26.6.1735. [DOI] [PubMed] [Google Scholar]
- 7.Yin W, Basu A, Zhang JX, et al. The effect of the Medicare Part D prescription benefit on drug utilization and expenditures. Ann Intern Med. 2008;148:169–177. doi: 10.7326/0003-4819-148-3-200802050-00200. [DOI] [PubMed] [Google Scholar]
- 8.Aging NIo. The Health and Retirement Study. [Accessed December 14, 2008];A Longitudinal Study of Health, Retirement, and Aging. Available at: http://hrsonline.isr.umich.edu/
- 9.Strickland WJ, Hanson CM. Coping with the cost of prescription drugs. J Health Care Poor Underserved. 1996;7:50–62. doi: 10.1353/hpu.2010.0014. [DOI] [PubMed] [Google Scholar]
- 10.Cox ER, Jernigan C, Coons SJ, et al. Medicare beneficiaries’ management of capped prescription benefits. Med Care. 2001;39:296–301. doi: 10.1097/00005650-200103000-00009. [DOI] [PubMed] [Google Scholar]
- 11.Stuart B, Grana J. Ability to pay and the decision to medicate. Med Care. 1998;36:202–211. doi: 10.1097/00005650-199802000-00009. [DOI] [PubMed] [Google Scholar]
- 12.Lillard LA, Rogowski J, Kington R. Insurance coverage for prescription drugs: effects on use and expenditures in the Medicare population. Med Care. 1999;37:926–936. doi: 10.1097/00005650-199909000-00008. [DOI] [PubMed] [Google Scholar]
- 13.Mojtabai R, Olfson M. Medication costs, adherence, and health outcomes among medicare beneficiaries. Health Affairs. 2003;22:220–229. doi: 10.1377/hlthaff.22.4.220. [DOI] [PubMed] [Google Scholar]
- 14.Kennedy J, Erb C. Prescription noncompliance due to cost among adults with disabilities in the United States. Amer J Public Health. 2002;92:1120–1124. doi: 10.2105/ajph.92.7.1120. [DOI] [PMC free article] [PubMed] [Google Scholar]
- 15.Piette JD, Heisler M, Wagner TH. Problems paying out-of-pocket medication costs among older adults with diabetes. Diabetes Care. 2004;27:384–391. doi: 10.2337/diacare.27.2.384. [DOI] [PubMed] [Google Scholar]
- 16.Baker DW, Sudano JJ, Durazo-Arvizu R, et al. Health insurance coverage and the risk of decline in overall health and death among the near elderly, 1992–2002. Medical Care. 2006;44:277–282. doi: 10.1097/01.mlr.0000199696.41480.45. [DOI] [PubMed] [Google Scholar]
- 17.Heisler M, Langa KM, Eby EL, et al. The health effects of restricting prescription medication use because of cost. Med Care. 2004;42:626–634. doi: 10.1097/01.mlr.0000129352.36733.cc. [DOI] [PubMed] [Google Scholar]
- 18.Baker DW, Sudano JJ, Albert JM, et al. Loss of health insurance and the risk for a decline in self-reported health and physical functioning. Med Care. 2002;40:1126–1131. doi: 10.1097/00005650-200211000-00013. [DOI] [PubMed] [Google Scholar]
- 19.Martin BC, McMillan JA. The impact of implementing a more restrictive prescription limit on Medicaid recipients. Effects on cost, therapy, and out-of-pocket expenditures. Med Care. 1996;34:686–701. doi: 10.1097/00005650-199607000-00003. [DOI] [PubMed] [Google Scholar]
- 20.Soumerai SB, Avorn J, Ross-Degnan D, et al. Payment restrictions for prescription drugs under Medicaid. Effects on therapy, cost, and equity. N Engl J Med. 1987;317:550–556. doi: 10.1056/NEJM198708273170906. [DOI] [PubMed] [Google Scholar]
- 21.Soumerai SB, Ross-Degnan D, Avorn J, et al. Effects of Medicaid drug-payment limits on admission to hospitals and nursing homes. N Engl J Med. 1991;325:1072–1077. doi: 10.1056/NEJM199110103251505. [DOI] [PubMed] [Google Scholar]
- 22.Tamblyn R, Laprise R, Hanley JA, et al. Adverse events associated with prescription drug cost-sharing among poor and elderly persons. JAMA. 2001;285:421–429. doi: 10.1001/jama.285.4.421. [DOI] [PubMed] [Google Scholar]
- 23.Soumerai SB, Ross-Degnan D. Inadequate prescription-drug coverage for Medicare enrollees–a call to action. N Engl J Med. 1999;340:722–728. doi: 10.1056/NEJM199903043400909. [DOI] [PubMed] [Google Scholar]
- 24.Soumerai SB, McLaughlin TJ, Ross-Degnan D, et al. Effects of a limit on Medicaid drug-reimbursement benefits on the use of psychotropic agents and acute mental health services by patients with schizophrenia. N Engl J Med. 1994;331:650–655. doi: 10.1056/NEJM199409083311006. [DOI] [PubMed] [Google Scholar]
- 25.Sokol MC, McGuigan KA, Verbrugge RR, et al. Impact of medication adherence on hospitalization risk and healthcare cost. Med Care. 2005;43:521–530. doi: 10.1097/01.mlr.0000163641.86870.af. [DOI] [PubMed] [Google Scholar]
- 26.Lichtenberg FR. Do (more and better) drugs keep people out of the hospitals? Am Econ Rev. 1996;86:384–388. [PubMed] [Google Scholar]
- 27.Soldo BJ, Hurd MD, Rodgers WL, et al. Asset and health dynamics among the oldest old: an overview of the AHEAD Study. J Gerontol B Psychol Sci Soc Sci. 1997;52(Spec No):1–20. doi: 10.1093/geronb/52b.special_issue.1. [DOI] [PubMed] [Google Scholar]
- 28.Long SW, Freese J. Regression Models For Categorical Dependent Variables Using Stata. STATA Press; 2006. [Google Scholar]
- 29.Stata Longitudinal/panel Data Reference Manual Release 10 [computer program] College Station, Texas: StataCorp LP; 2007. [Google Scholar]
- 30.Goldman DP, Joyce GF, Zheng Y. Prescription drug cost sharing: associations with medication and medical utilization and spending and health. JAMA. 2007;298:61–69. doi: 10.1001/jama.298.1.61. [DOI] [PMC free article] [PubMed] [Google Scholar]
- 31.Piette JD, Heisler M, Wagner TH. Cost-related medication underuse among chronically ill adults: the treatments people forgo, how often, and who is at risk. Am J Public Health. 2004;94:1782–1787. doi: 10.2105/ajph.94.10.1782. [DOI] [PMC free article] [PubMed] [Google Scholar]
- 32.Heisler M, Faul JD, Hayward R, et al. Mechanisms for racial and ethnic disparities in glycemic control in middle-aged and older Americans in the health and retirement study. Arch Intern Med. 2007;167:1–8. doi: 10.1001/archinte.167.17.1853. [DOI] [PubMed] [Google Scholar]
- 33.Piette JD, Heisler M, Wagner TH. Cost-related medication underuse: do patients with chronic illnesses tell their doctors? Arch Intern Med. 2004;164:1749–1755. doi: 10.1001/archinte.164.16.1749. [DOI] [PubMed] [Google Scholar]
- 34.Rosen AB. Grounding coverage in value: a paradigm for linking quality and costs. Med Care. 2006;44:389–391. doi: 10.1097/01.mlr.0000216191.86056.a1. [DOI] [PubMed] [Google Scholar]
- 35.Braithwaite RS, Rosen AB. Linking cost sharing to value: an unrivaled yet unrealized public health opportunity. Ann Intern Med. 2007;146:602–605. doi: 10.7326/0003-4819-146-8-200704170-00011. [DOI] [PubMed] [Google Scholar]
- 36.Chernew ME, Rosen AB, Fendrick AM. Value-based insurance design. Health Aff (Millwood) 2007;26:W195–W203. doi: 10.1377/hlthaff.26.2.w195. [DOI] [PubMed] [Google Scholar]
- 37.Freudenheim M. To save later, some employers are offering free drugs now. New York Times. 2007 February 21;2007:A1. [Google Scholar]
- 38.Fuhrmans V. New track on copays: cutting them. Wall Street Journal. 2007 May 8;2007:D1. [Google Scholar]
- 39.Chernew ME, Shah MR, Wegh A, et al. Impact of decreasing copayments on medication adherence within a disease management environment. Health Aff (Millwood) 2008;27:103–112. doi: 10.1377/hlthaff.27.1.103. [DOI] [PubMed] [Google Scholar]
- 40.Joyce GF, Escarce JJ, Solomon MD, et al. Employer drug benefit plans and spending on prescription drugs. JAMA. 2002;288:1733–1739. doi: 10.1001/jama.288.14.1733. [DOI] [PubMed] [Google Scholar]
- 41.Fendrick AM, Smith DG, Chernew ME, et al. A benefit-based copay for prescription drugs: patient contribution based on total benefits, not drug acquisition cost. Amer J Manag Care. 2001;7:861–867. [PubMed] [Google Scholar]
- 42.Lichtenberg FR. Are the benefits of newer drugs worth their cost? Evidence from the 1996 MEPS. Health Affairs. 2001;20:241–251. doi: 10.1377/hlthaff.20.5.241. [DOI] [PubMed] [Google Scholar]
- 43.Rosen AB, Hamel MB, Weinstein MC, et al. Cost-effectiveness of full medicare coverage of angiotensin-converting enzyme inhibitors for beneficiaries with diabetes. Ann Intern Med. 2005;143:89–99. doi: 10.7326/0003-4819-143-2-200507190-00007. [DOI] [PubMed] [Google Scholar]
- 44.Goldman DP, Joyce GF, Karaca-Mandic P. Varying pharmacy benefits with clinical status: the case of cholesterol-lowering therapy. Am J Manag Care. 2006;12:21–28. [PubMed] [Google Scholar]
- 45.Choudhry NK, Patrick AR, Antman EM, et al. Cost-effectiveness of providing full drug coverage to increase medication adherence in post-myocardial infarction Medicare beneficiaries. Circulation. 2008;117:1261–1268. doi: 10.1161/CIRCULATIONAHA.107.735605. [DOI] [PMC free article] [PubMed] [Google Scholar]
- 46.Sjahid SI, van der Linden PD, Stricker BH. Agreement between the pharmacy medication history and patient interview for cardiovascular drugs: the Rotterdam elderly study. Brit J Clin Pharmacol. 1998;45:591–595. doi: 10.1046/j.1365-2125.1998.00716.x. [DOI] [PMC free article] [PubMed] [Google Scholar]
- 47.Rost K, Roter D. Predictors of recall of medication regimens and recommendations for lifestyle change in elderly patients. Gerontologist. 1987;27:510–515. doi: 10.1093/geront/27.4.510. [DOI] [PubMed] [Google Scholar]
- 48.West SL, Savitz DA, Koch G, et al. Recall accuracy for prescription medications: self-report compared with database information. Am J Epidemiol. 1995;142:1103–1112. doi: 10.1093/oxfordjournals.aje.a117563. [DOI] [PubMed] [Google Scholar]
- 49.Norrish A, North D, Kirkman P, et al. Validity of self-reported hospital admission in a prospective study. Am J Epidemiol. 1994;140:938–942. doi: 10.1093/oxfordjournals.aje.a117182. [DOI] [PubMed] [Google Scholar]
- 50.Brown JB, Adams ME. Patients as reliable reporters of medical care process. Recall of ambulatory encounter events. Med Care. 1992;30:400–411. doi: 10.1097/00005650-199205000-00003. [DOI] [PubMed] [Google Scholar]
Associated Data
This section collects any data citations, data availability statements, or supplementary materials included in this article.