

Abstract
The presence of antimicrobial chemicals triclocarban (TCC) and triclosan (TCS) in municipal biosolids has raised concerns about the potential impacts of these chemicals on soil ecosystems following land application of municipal biosolids. The relative persistence of TCC and TCS in agricultural fields receiving yearly applications of biosolids at six different loading rates over a three-year period was investigated. Soil and biosolids samples were collected, extracted, and analyzed for TCC and TCS using liquid chromatography tandem mass spectrometry. In addition, the potential for bioaccumulation of TCC and TCS from the biosolids-amended soils was assessed over 28 d in the earthworm Eisenia foetida. Standard 28-d bioaccumulation tests were conducted for three biosolids loading rates from two sites, representing agronomic and twice the agronomic rates of biosolids application plots as well as control plots receiving no applications of biosolids. Additional bioaccumulation kinetics data were collected for the soils receiving the high biosolids loadings to ensure attainment of quasi-steady state conditions. The results indicate that TCC is relatively more persistent in biosolids-amended soil than TCS. In addition, TCC bioaccumulated in E. foetida, reaching body burdens of 25 ± 4 and 133 ± 17 ng/gww in worms exposed for 28 d to the two soils amended with biosolids at agronomic rates. The 28-d organic carbon and lipid-normalized biota soil accumulation factors (BSAFs) were calculated for TCC and ranged from 0.22 ± 0.12 to 0.71 ± 0.13. These findings suggest that TCC bioaccumulation is somewhat consistent with the traditional hydrophobic organic contaminant (HOC) partitioning paradigm. However, these data also suggest substantially reduced bioavailability of TCC in biosolids-amended soils when compared to HOC partitioning theory.
Keywords: Antimicrobials, Biosolids, Earthworm, Bioaccumulation, Persistence
INTRODUCTION
Due to their ubiquitous presence in many personal care products, the antimicrobial chemicals triclocarban (TCC) and triclosan (TCS) continuously enter wastewater treatment plants (WWTPs) via domestic wastewater. These chemicals are commonly used in many household products including toothpaste, soaps, cosmetics, and deodorants [1, 2]. Upon entry into WWTPs, these chemicals are typically efficiently removed from the aqueous phase through partitioning to biological flocs and/or microbially-mediated transformation processes. Recent studies have demonstrated aqueous removal rates as high as 97% for TCC [3] and 98% for TCS [4]. However, for both TCC and TCS, a large fraction of the mass entering the WWTPs (50% for TCS; 76% for TCC) was shown to persist in sludge, resulting in median concentrations of 21.9 mg/kgdw for TCC and 6.5 mg/kgdw for TCS in U.S. treated sewage sludge (biosolids) [5]. Potential concerns regarding TCC and TCS in sludge arise when biosolids are land applied. In particular, depending on their persistence and bioaccumulative potential in biosolids-amended soils, these antimicrobial chemicals have the potential to adversely impact terrestrial ecosystems through bioaccumulation and trophic transfer in terrestrial food webs. These potential impacts are in addition to any adverse impacts these chemicals may have on soil microorganisms. As studies examining the effects of these chemicals on microbially-controlled biogeochemical processes have generally demonstrated minimal impacts [6–9], the potential development of microbial resistance in biosolids-amended soils remains the primary concern [10].
Given the concentrations measured in biosolids, it is not surprising that several investigators have reported measureable concentrations of both TCC and TCS in biosolids-amended soils [11–14]. Once applied to soils via biosolids application, the concentrations of TCC and TCS may decrease over time as a result of a variety of dissipation processes, the most important of which are likely biotransformation and leaching to deeper soils. Aerobic transformation of TCS and TCC using spiked soils has been observed [9], with reported half-lives of 108 and 18 d for TCC and TCS, respectively. However, a field-based study estimated a half-life of TCS in biosolids-amended soils of 107 d [13]. In a separate study, leaching of TCS but not TCC to deeper soils was observed [12]. The aforementioned study and a separate report [14] generally concluded that TCC is more persistent than TCS based on concentrations measured in the soils, though data on the relative levels of TCC and TCS in the biosolids actually applied to the soils were not available. Usage of these two chemicals exceeds several hundred thousand to one million pounds per year in the U.S. alone [15]. Due to difference in usage volume and differential fates during wastewater treatment [3, 4], their relative concentrations in biosolids may vary from site to site and year to year.
Several studies provided evidence for the toxicity of TCC and TCS to aquatic organisms [16, 17], and demonstrated interference of these substances with biological receptors in vitro [18]. In contrast, much less is known about their toxicity to terrestrial organisms. Though not directly relevant to biosolids-amended soils, TCC may act as an endocrine disrupting compound in rats through amplification of testosterone-induced androgen receptor-mediated transcriptional activity [19]. Due to their confirmed presence in biosolids-amended soils, TCC and TCS may have the potential to bioaccumulate in soil-dwelling organisms and thus exert toxic effects on higher organisms through trophic transfer. Both TCC and TCS have been shown to bioaccumulate in algae and snails exposed to WWTP effluent, with TCC generally bioaccumulating to a greater extent than either TCS or methyl-triclosan (MeTCS), a microbial transformation product of TCS [20, 21]. Methyl-triclosan has also been detected in fish, suggesting it may undergo trophic transfer [22]. In a recent laboratory-based study, TCC appears to bioaccumulate in the freshwater worm Lumbriculus variegatus in a manner consistent with the traditional hydrophobic organic contaminant (HOC) partitioning paradigm [23]. An estimated steady-state lipid and organic-carbon normalized biota-sediment accumulation factor (BSAF) of 2.2 ± 0.2 goc/glip was estimated for TCC using a biokinetic modeling approach, while a TCC BSAF value of 1.6 ± 0.6 was measured directly. Unfortunately, to date, little data are available regarding the bioaccumulation of TCC and TCS in soil-dwelling organisms. Triclosan has been detected in earthworms collected from biosolids-amended soil, though bioaccumulation was sporadic and variable [11].
The objective of the present study was to determine the extent to which the antimicrobial chemicals TCC and TCS persist in and bioaccumulate from biosolids-amended agricultural soils. The relative persistence of TCC and TCS was assessed through analysis of biosolids and biosolids-amended soils collected from field sites, while laboratory-based bioaccumulation assays were conducted with earthworms exposed to biosolids-amended soils collected from these same field sites. The levels of TCS and TCC in the biosolids, biosolids-amended soils, and worms exposed to biosolids-amended soils were determined by extraction and analysis by liquid chromatography/tandem mass spectrometry (LC-MS/MS). The earthworm Eisenia foetida was used because of its continuous contact with and ingestion of soil and because earthworms serve as the basis of many terrestrial food webs. Earthworms can comprise as much as 60 to 80% of the biomass of a terrestrial soil in some areas and can comprise as much as 90% of the diet of some birds [24, 25]. The uptake kinetics in E. foetida were modeled with a standard biokinetic model. In addition, differences in bioaccumulation potential between soils were evaluated using the equilibrium-based BSAF approach. [26]
MATERIALS AND METHODS
Chemicals
Triclocarban (TCC) and 13C6-TCC and d7-TCC were obtained from Sigma-Aldrich and Cambridge Isotope Laboratories, respectively. Triclosan (TCS), and 13C6-TCS and 13C12-TCS were obtained from Sigma Aldrich, Ciba Specialty Chemicals, and Cambridge Isotope Laboratories, respectively. Standard synthetic freshwater was prepared from MilliQ™ water (Millipore Corporation). Unless otherwise noted, all other chemicals and solvents were of reagent grade and purchased from Sigma-Aldrich.
Study site characterization
In fall 2004, the Metropolitan Water Reclamation District of Greater Chicago initiated a three-year field scale research experiment at two farms in Illinois, Ashkum silty clay loam (fine, mixed, mesic Typic Haplaquolls) and Chelsea fine sand (mixed, mesic, Alfic Udipsamments) representing a heavy textured clay soil (W) and a light textured sandy soil (K), respectively, to evaluate the potential effects of Class B biosolids application on soil fertility and corn yield. Class B biosolids were applied to the W plots in fall of 2004, 2005, and 2006, whereas biosolids were applied to the K plots in spring of 2005, 2006, and 2007. Specifically, both sites received biosolids application at six target rates (W soil: 0, 5.0, 7.5, 10, 12.5 and 20 dry tons of biosolids per acre per year; K soil: 0, 2.5, 5.0, 7.5, 10 and 15.0 dry tons of biosolids per acre per year) for three consecutive years. As biosolids were applied using farm-scale equipment in concordance with typical farming practices, the total zinc (Zn) concentrations in biosolids and soils were used to determine the actual loading rates for biosolids at both sites.Total Zn was extracted from biosolids, biosolids-amended soils, and control plots by concentrated nitric acid digestion (U.S. Environmental Protection Agency Method 3050B) and subsequently quantified by inductively coupled plasma-atomic emission spectrometry (ICP-AES; U.S. EPA Method 6010)[27]. Loading rates were then calculated using biosolids incorporation depths of 20 cm for the K plots and 15 cm for the W plots and a measured soil bulk densities (ρbulk) of 1.6 and 1.3 g/cm3 for the K and W soils, respectively. These calculations assume that the only source of Zn to the soils (above the measured background levels) was from the application of biosolids and any losses of Zn from soil over time were insignificant. The actual loading rates for both sites differed substantially from the targeted loading rates: these data, as well as other geochemical data for these plots, are provided as Supplemental Information.
Biosolids and biosolids-amended soil sample collection
Composite (10 sub-samples) samples of the original Class B biosolids that were applied at both sites for the duration of the project were collected in glass jars at the time of application and stored at −20°C until extraction and analysis. Surface soil samples used for the present study were collected in May 2005 and October 2007 by compositing five sub-samples from 0 to 15-cm depths from each of the treatments. Soil samples were ground and passed through a 2-mm pore size sieve to minimize sample heterogeneity. Additional soil samples from the control, agronomic rate, and twice the agronomic rate plots (control, low, and high) were collected in May 2008 from both sites for use in the laboratory-based Eisenia foetida bioaccumulation assays. For the W soils, this corresponded to 0, 12, and 24 dry tons of biosolids per acre per year, while for the K soils, this corresponded to 0, 6, and 18 dry tons per acre per year, respectively. These additional soil samples were dry sieved (2.54 mm) to aid in homogenization and eliminate any large particles (roots, pebbles etc.), characterized for the fraction of organic carbon (foc) by a commercial laboratory using the Walkley-Black method, and stored at 4°C until use. Bioaccumulation experiments were initiated within one month following sample collection.
Organisms
Adult specimens of Eisenia foetida were obtained from the Carolina Biological Supply Company. Before experimentation, worms were maintained at room temperature in hydrated peat moss and were fed twice a week using worm food (Magic Products). Prior to placing worms in the treatment jars, the worms were separated, rinsed, and weighed in groups of four individuals (approximately 1 to 1.5 g wet weight of worms per aliquot).
Bioaccumulation Assay
Bioaccumulation assays were conducted in solvent-rinsed 150-ml glass beakers, with all time points and controls prepared and terminated in triplicate. Initial soil moisture content for these soils was determined to be 9 and 15% for the K soils and W soils, respectively. Preliminary tests suggested significant avoidance of the W soil by the worms, but after adjustment of the soil moisture content to 30%, no avoidance was observed. Moisture content of the K soils was not adjusted, as no avoidance of the soil by the worms was observed for these soils. After sieving, approximately 120 g of soil was placed in each beaker. Triplicate beakers were prepared for each soil and biosolids loading rate and for each time interval. The beakers were kept in a water bath under constant temperature (22–24°C) and lighting. Worm aliquots were then added to each beaker, with additional worm aliquots reserved for time zero samples. After addition of the worms, a thin laboratory tissue was secured over each beaker using rubber bands. The tissue was then moistened with MilliQ water and was kept moist for the duration of the experiment. The beakers were periodically checked to ensure worm survival and that the worms remained burrowed in the soil. For the control and low biosolids loading rates (K Control, K Low, W Control, W Low), only 28-d exposures were conducted. For the High biosolids loading rates (K High, W High), additional beakers were prepared for days 1, 5, 7, 9, 14, and 21 to enable evaluation of bioaccumulation kinetics. At each time interval, the beakers were removed from the water bath and the worms and soil prepared for analyses. Approximately 5 g of soil from each beaker was saved for chemical analysis by transferring to 20-ml glass vials which were subsequently frozen at −20°C. Worms were individually removed from the soil, rinsed with synthetic freshwater, and the individuals from each beaker grouped and placed on moistened filter paper within plastic Petri dishes. The worms were allowed to depurate for 24 h in the dark. After depuration, worms were again rinsed with synthetic freshwater, weighed, placed in 20-ml glass vials, and frozen at −20°C until further analysis.
Biosolids and Biosolids-Amended Soil Extraction
Immediately prior to extraction, biosolids and biosolids-amended soil samples were thawed and 100 to 500 ng of 13C6-TCC and 13C6-TCS in a surrogate standard solution was added to each sample to monitor extraction efficiency. Approximately 3 to 5 g of soil and 500 mg of biosolids were extracted and analyzed for antimicrobial content. For each sample, 10 ml of a 50:50 methanol:acetone mixture was added to the 20-ml glass vials containing soil or biosolids, and the sample was vortexed before being transferred to 50-ml polypropylene centrifuge tube. After shaking for 60 min, the mixture was centrifuged at 3000 relative centrifugal force (rcf) for 5 min, the supernatant decanted into a clean 20-ml glass vial, and the process was repeated twice (for a total of three extractions). All extracts were combined and evaporated to dryness under nitrogen prior to reconstitution in 2 ml of high performance liquid chromatography (HPLC) grade methanol. For each sample, the reconstituted extract was transferred to a 2-ml microcentrifuge tube, centrifuged at 18,000 rcf for 30 min, and a 1.4 ml aliquot transferred to a second microcentrifuge tube and diluted with 600 μL of MilliQ™ water to achieve a final methanol:water ratio of 70:30 (v/v). The extracts were centrifuged a final time for 18,000 rcf for 30 min prior to dilution and transfer to glass autosampler vials for LC-MS/MS analysis. All biosolids and biosolids-amended soil samples were extracted and analyzed in triplicate. To enable reporting of all soil and biosolids data on a dry weight basis, separate aliquots of each soil and biosolids samples were analyzed for moisture content in triplicate by drying overnight in an oven at 105°C.
Worm Extraction
Prior to extraction and analysis for TCC and TCS content via LC-MS/MS, the frozen worms were thawed and homogenized. Homogenization was performed by addition of 1 ml of MilliQ water to each thawed worm aliquot. The worms were then homogenized with a Model PT 10/35 Polytron Kinematic homogenizer, with 2 ml of MilliQ water used to rinse the homogenizer and collect worm tissue in the 20-ml glass vial. The homogenization probe was also thoroughly rinsed with water and methanol between each worm aliquot. After homogenization, approximately 100 mg of worm homogenate was transferred to a pre-weighed 2-ml glass vial for lipid analysis. Lipid content was determined using a method previously described [28]. The remainder of the worm homogenate was extracted for TCC and TCS content. Prior to extraction, 100–500 ng of 13C6-TCC and 13C6-TCS in a surrogate standard solution was added to the homogenate to monitor extraction efficiency. The antimicrobials were extracted from the worms in triplicate using acetonitrile. This was performed by adding 5 ml of acetonitrile to the worm homogenate, vortexing, transferring the mixture to a 50-ml polypropylene centrifuge tube, and shaking the mixture for 60 min. After shaking, the mixture was centrifuged at 3000 rcf for 5 min, the supernatant decanted into a clean 20-ml glass vial, and the process repeated twice (for a total of three extractions). All extracts were combined and evaporated to dryness under nitrogen prior to reconstitution in 2 ml of HPLC-grade methanol. Reconstituted extracts were then processed in a manner identical to that described above for biosolids and soil extracts.
Analysis via LC-MS/MS
All biosolids, soil, and worm extracts were transferred to glass autosampler vials and diluted with 70/30 (v/v) methanol/water as needed. For all samples and standards, an internal standard solution of d7-TCC and 13C12-TCS was added to each vial. Triclocarban and TCS were then quantified by LC-MS/MS using protocols similar to those previously described [15, 23]. Briefly, chromatography was performed using an aqueous ammonium acetate (2 mM) and methanol gradient delivered at a flow rate of 200 μL/min by a Waters 2795 LC system. Samples and standards were injected (50 μL) onto an Ultra IBD C18 column (5 μm particle size, 150 mm × 2.1 mm; Restek Corporation). Initial eluent conditions were 70% methanol. The percent methanol was increased to 100% at 5 min, held 100% for 3 min, decreased to 70% over 2 min, and held at 70% for the remaining 5 min. A Waters Quattro Micro triple quadrupole mass spectrometer operating in negative electrospray ionization multiple reaction monitoring (MRM) mode was employed for sample analysis. The MRM transitions monitored for each analyte, surrogate, and internal standard are listed in Table 1. A dwell time of 100 ms was used for each transition. Nitrogen was provided by a Parker-Balston N2-14 generator. Quantitation was performed using Waters QuanLynx™, with all calibration curves having R2 values greater than 0.99 and the accuracy of each calibration point within 30% of its expected value. The limits of quantitation (LOQs) were matrix and run-dependent, but were approximately 25 ng/glip and 250 ng/glip for TCC and TCS in worms and 0.1 ng/gdw and 2 ng/gdw for TCC and TCS in soil, respectively. All values reported are corrected for recovery of the 13C6-TCC and 13C6-TCS surrogate standards, as appropriate, which were generally greater than 60% for all samples in all matrices.
Table 1.
Mass transitions monitored by liquid chromatography tandem mass spectrometry
| Chemical | Transitions (m/z → m/z) |
|---|---|
| Triclocarban (TCC) | 313 → 160 |
| 13C6-TCC | 319 → 160 |
| d7-TCC | 322 → 165a |
| Triclosan (TCS) | 287 → 35 |
| 13C6-TCS | 293 → 35 |
| 13C12-TCS | 299 → 35 |
Due to overlap from the 13C6-TCC transition, the 37Cl isotope transition was used for the internal standard d7-TCC
Bioaccumulation Data Analysis
Modeling of worm accumulation was performed using Origin 8. Bioaccumulation data were fitted using non-linear regression to a first-order kinetic model [29]:
| Eqn. 1 |
where Corg is the lipid-normalized concentration of chemical in the worm (μg/glip), Csoil,0 is the initial organic-carbon normalized concentration of chemical in the soil (μg/goc), ks is the uptake rate constant (goc/gliphr), ke is first-order elimination rate constant (hr−1), and λ is a rate constant (hr−1) that allows for decreasing levels of contaminant and/or decreasing contaminant bioavailability over the course of the experiment [29]. The biota-soil accumulation factor (BSAF; goc/glip) was calculated by dividing the lipid-normalized worm concentrations by the organic-carbon normalized soil concentrations measured for the day 28 samples as follows:
| Eqn. 2 |
RESULTS AND DISCUSSION
Relative antimicrobial persistence in soil
Levels of TCC and TCS in Biosolids
As determined by analytical measurements, the concentration of TCC and TCS in the biosolids applied to both the K and W soils were quite variable over the three year period (Figure 1). As shown in Figure 1, the levels in the biosolids applied to the W soils were generally less variable than those applied to the K soils: the average concentrations of TCC and TCS in these biosolids were 9200 ± 1600 ng/gdw and 6400 ± 300 ng/gdw, respectively. As reported in Table 2, the average TCC/TCS concentration ratio (and standard deviation) for all of the biosolids applied to soils was 1.3 ± 0.4, whereas the TCC/TCS ratio for the biosolids applied only to W soils was 1.4 ± 0.2. As will be discussed, the variability in the concentrations in the biosolids applied to the K soils, coupled with the variable application rates, resulted in limited utility of field data from the K soils. The TCC and TCS levels measured in the biosolids applied to both soils are well within the range of values reported for both TCC (mean of 39,400 ng/gdw; range of 187 to 441,000 ng/gdw) and TCS (mean of 16,100 ng/gdw; range of 430 to 133,000 ng/gdw) in the recently completed Targeted National Sewage Sludge Survey conducted by the U.S. EPA [5].
Figure 1.

Concentrations of triclocarban (TCC) and triclosan (TCS) in biosolids applied to light textured sandy soil (K) and heavy textured clay soil (W) over the three-year period.
Table 2.
Triclocarban (TCC) to triclosan (TCS) concentration ratios for biosolids and soils after a single biosolids application (May 2005) or after multiple applications (October 2007).
| Matrix | Samples | Average TCC/TCS Ratio (± standard deviation) |
|---|---|---|
| Biosolids | All biosolids | 1.3 ± 0.4 |
| Biosolids | Applied to W Soil | 1.4 ± 0.2 |
| Biosolids | Applied to K Soil | 1.1 ± 0.6 |
| Biosolids-Amended Soil | W Soils (May 2005) | 4.7 ± 2.3 |
| Biosolids-Amended Soil | W Soils (October 2007) | 9.4 ± 0.6 |
Levels of TCC and TCS in Biosolids-Amended Soils
Both TCS and TCC were detected in all biosolids plots. Trace levels of TCC (overall average of 9 ± 6 ng/gdw) and TCS (overall average of 2 ± 1 ng/gdw) were also detected in the W Control plots, likely as a result of small transfers of soil from the biosolids-amended soils to the control soils during standard soil tilling. For the October 2007 soil samples, TCC and TCS levels in the K Control plots were below the limits of quantitation (LOQ) of 0.1 and 2 ng/gdw, respectively. As is apparent in Figure 2, the levels of TCC and TCS in soil generally increased with biosolids application rate in the W plots. For the W soils, linear regressions were performed for the May 2005 and for the October 2007 sampling events for both TCC and TCS. All regressions include a zero intercept and were statistically-significant at the p <0.05 level. The slopes for the TCC regressions were 4.1 ± 0.6 and 17.4 ± 0.8 (ng/gdw per dry ton/acre/year) for the 2005 and 2007 sampling events, respectively, while the slopes for the TCS regressions were 1.05 ± 0.19 and 1.84 ± 0.10 for the 2005 and 2007 sampling events, respectively. The poorer fit for the May 2005 regressions is likely due to the fact that these soils had only received one application of biosolids approximately six months prior to sampling and the measured biosolids application rate (x-axis in Figure 2) is the cumulative (average) application rate measured after three years of biosolids application. Unfortunately, analysis of the K soil samples revealed highly-variable rates of loading rates and levels of TCC and TCS (data not shown). No statistically-significant correlations between intended or measured biosolids loading rates and either TCC or TCS soil concentrations were evident from the K soil data in the field study. Thus, no additional chemical or statistical analyses were conducted related to the persistence of TCC and TCS in the K soil samples.
Figure 2.

Concentrations of triclocarban (TCC) and triclosan (TCS) in biosolids-amended soils (W soils) plotted against the cumulative biosolids loading rates. Each data point represents an individual sample collected and analyzed for TCC and TCS content. The slopes for the fitted regressions are provided in the text.
Despite the approximately equal levels of TCS and TCC in the biosolids applied to the W soils (Figure 1), substantially higher levels of TCC compared to TCS were present in the soil, suggesting higher persistence of TCC. This is reflected in the rising concentration ratio of TCC to TCS from a value near unity in the applied biosolids to a value of 9.4 ± 0.6 calculated from the October 2007 concentrations in the W soils (Table 2). Even for the May 2005 W soil samples, the average TCC/TCS concentration ratio had risen to 4.7 ± 2.3 within six months following a single application of biosolids. Unfortunately, due to the limited time points available, the variability of the biosolids application rates, and the repeated application of biosolids to these plots, calculations of precise TCC and TCS half-lives in these soils were not possible. For example, using a single time point after a single application to the W soils (i.e., the May 2005 data), a one-compartment first-order attenuation model yielded half-lives of 68 d for TCC and 42 d for TCS for the W soil in which biosolids were applied at the agronomic rate. For TCC, this half-life is smaller than the one reported value of 108 d [9], while the value for TCS falls between the laboratory-derived value of 18 d [9] and the field-derived value 107 d [13]. However, when estimating half-lives for TCC and TCS in soils amended at higher and lower biosolids loading rates, the estimated half-lives varied by up to an order of magnitude, suggesting limited utility of data derived from a single time point. While attenuation half-lives of TCC and TCS in biosolids-amended soils are essential data for risk assessments, the present study was simply not designed to generate such data. Clearly, additional field and modeling studies, such as that conducted by Lozano et al. [13], are needed to accurately estimate the half-lives of these chemicals, particularly for TCC, if meaningful human or ecological risk assessments are to be performed. Furthermore, the present study did not assess whether the TCS metabolite, MeTCS, was formed in these soils, and if so, if it persisted in the soils to a greater extent than TCS or TCC.
Antimicrobial Bioaccumulation from Biosolids-Amended Soil
Measures of Worm Health
No acute mortality of worms due to exposure to biosolids-amended soils was apparent. No discernable temporal trends of increasing or decreasing worm weights were observed in either the W or K soils receiving high biosolids applications: the average worm weight recovered over the 28-day experiments (compared to the initial mass of worms added) was 104 ± 16% for Soil K and 110 ± 17% for W soil. After 28 d of exposure, no statistical differences in recovered worm masses were observed between the soils or biosolids loading rates, though the recovered worm masses from the Control plots (no biosolids added) tended to be slightly lower than those recovered from the high biosolids loading plots. Lower weights might be expected in the Control soils if the biosolids were a significant source of food for the worms. Similarly, no temporal trends or statistically-significant differences were evident for the worm lipid content, which averaged 0.96 ± 0.27% on a wet-weight basis. To account for variability between replicates and the potential impacts on chemical body burdens, all tissue concentrations were normalized for lipid content on a per-sample basis.
Accumulation of TCC and TCS in E. foetida. Despite previous reports showing detectable levels of TCS in snails, algae [20], and worms collected from biosolids-amended soils [11], data on TCS bioaccumulation in E. foetida were inconclusive. In worms exposed to soils receiving the highest loads of biosolids (K High, W High), TCS was generally only quantifiable in worm tissues beginning on days 7 and 9, respectively (see Supplemental Data). Concentrations of TCS were variable, with relative standard deviations (RSDs) from triplicate measurements at each time interval in the 9 to 88% range. Of particular note, after 28 d of exposure to the W High soil, TCS levels were below the limit of quantitation (LOQ; 0.5 μg/glip) for one of the experimental triplicates. Triclosan body burdens in the worms exposed to K High, K Low, and W Low soils for 28 d were 2.8 ± 1.0, 2.2 ± 0.6, and 1.8 ± 0.9 μg/glip, respectively, suggesting TCS accumulation was not directly linked to the level of TCS exposure (TCS levels in K High, K Low, and W Low soils were 3.3 ± 1.4, 6.9 ± 1.5, and 1.5 ± 0.2 μg/goc respectively). However, unlike previous studies [11], TCS was not detected in either the time-zero worms or worms exposed to the Control soils (data not shown). The variable results and the lack of a clear relationship between TCS exposure levels and chemical accumulation in worms suggests that additional studies will be needed to fully assess the extent to which TCS can bioaccumulate from biosolids-amended soils. It is possible that the TCS, once taken up by the worms, was being transformed into daughter products (MeTCS), which were not analyzed in the present study.
However, TCC rapidly and consistently accumulated in E. foetida exposed to biosolids-amended soils (Figure 3). For the K High and W High soils, the body burden of TCC appeared to reach steady state within the first ten days of the experiment. TCC bioaccumulation was also higher in the K High soil, which was likely due to higher TCC levels in the K soil (Figure 4). The generic biokinetic model provided an excellent fit to the TCC data for both soils. The fitted model parameters are provided in Table 3. For the K High bioaccumulation data, the best fit was obtained when λ, the fitting parameter meant to account for temporal changes in bioavailability during the course of the bioaccumulation assay, was set to zero. In contrast, for the W High bioaccumulation data, the best fit was obtained when λ was set to 8.3 ± 4.2 (× 10−4; hr−1), suggesting that the bioavailability of TCC in the heavy textured clay soil may have decreased over the 28-d exposure. However, the difference between the model-predicted body burdens at 28 d is relatively minimal (5.3 μg/glip vs. 6.9 μg/glip with λ set to zero). No statistically-significant temporal changes in the TCC or TCS concentrations were observed in any of the W or K soils during the course of the bioaccumulation assay. Collectively, these data suggest that 28-d BSAF values based on measured body burdens and soil levels could be a useful parameter to compare TCC bioaccumulation from different soils at different biosolids loading rates.
Figure 3.
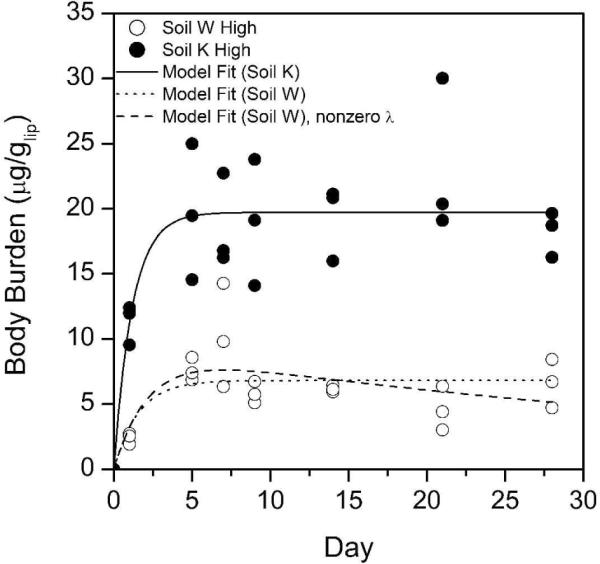
Uptake kinetics of triclocarban (TCC) in E. foetida exposed to biosolids-amended soils. Data were fit using a biokinetic model discussed in the text with parameters listed in Table 3. K = light textured sandy soil; W = heavy textured clay soil.
Figure 4.

Triclocarban (TCC) concentrations on day 28 for the six soil samples (Panel A; expressed on both a dry weight and organic carbon (OC)-normalized basis) and E. foetida exposed to these six soil samples (Panel B). The biota-soil accumulation factors (BSAFs) for these six soil samples, normalized to both soil OC and worm lipid content, are presented in Panel C. Organic carbon contents for the soils were 0.28, 0.44, 1.34% for the K Control, K Low, K High soil samples and 3.08, 2.91, and 3.43 % for the W Control, W Low, W High soil samples, respectively. K = light textured sandy soil; W = heavy textured clay soil.
Table 3.
Biokinetic model parameters for triclocarban (TCC) bioaccumulation in Eisenia foetida.
| Parameter (units) | Description | W High Soil | W High Soil (λ = 0) | K High Soil (λ = 0) |
|---|---|---|---|---|
| ks (goc/gliphr) × 104 | Uptake rate constant | 120 ± 50 | 130 ± 70 | 220 ± 60 |
| λ (hr−1) × 104 | Change in bioavailability | 8.3 ± 4.2 | -- | -- |
| ke (hr−1) × 104 | Elimination rate constant | 200 ± 100 | 270 ± 150 | 350 ± 100 |
| Adjusted R2 | Goodness of fit | 0.61 | 0.56 | 0.79 |
K = light textured sandy soil; W = heavy textured clay soil.
Biota Soil Accumulation Factors
As discussed, the toxicokinetic profile of TCC in E. foetida exposed to the W High and K High soils indicated that steady-state was likely reached within the 28-d exposure window. The fact that steady-state was reached within this timeframe suggests that comparisons of the body-burdens of E. foetida exposed for 28 d to the soils from other treatments such as K Control, K Low, W Control, and W Low will be useful in predicting the body-burdens of TCC in E. foetida exposed to soils with varying levels of soil organic carbon (OC) and TCC contents. TCC bioaccumulation appeared to be relatively consistent with traditional hydrophobic organic chemical (HOC) partitioning theory in that normalization to organism lipids and soil OC leads to relatively consistent biota-soil accumulation factors (Figure 4). This appears to be true regardless of very large differences in soil TCC concentrations (0.9 ± 0.5 ng/gdw to 480 ± 80 ng/gdw) and soil OC contents (foc values ranging from 0.0028 to 0.034).
Comparison with Other Studies
While direct comparison between soil and sediment systems is difficult, previous work on TCC bioaccumulation from spiked sediment into Lumbriculus variegatus revealed a steady-state BSAF value (goc/glip) of 2.2 ± 0.2 [23]. For sediment systems, HOC partitioning theory predicts a theoretical organic carbon and lipid-normalized steady-state BSAF value of 1.6 for non-metabolized HOCs, if the log of the octanol/water partition coefficient (log KOW) is less than 6 [30]. The lower BSAF values for TCC (0.22 ± 0.12 to 0.71 ± 0.13 goc/glip) in the present study may reflect substantially decreased bioavailability of TCC in biosolids-amended soils when compared to spiked sediments.
Conclusions
The commonly used antimicrobial chemical TCC appears to persist and bioaccumulate in biosolids-amended soils. Though a one-compartment first-order attenuation model was unable to predict the TCC and TCS soil concentrations after multiple years of biosolids application nor their concentration ratio, our data clearly demonstrate that TCC is much more persistent in biosolids-amended soils than TCS. At present, no conclusions can be drawn with respect to the TCS bioaccumulation due to the high variability observed. However, TCC was shown to bioaccumulate into the earthworm Eisenia foetida in a manner consistent with HOC theory. Slight variations were observed in organic-carbon and lipid-normalized BSAFs between the different biosolids-amended soils, though the generally low BSAF values measured suggest relatively low bioavailability of TCC in biosolids-amended soils when compared to HOC partitioning theory. Further research is needed to evaluate the bioaccumulation potential of TCS from soils as well as to more accurately measure and model the persistence of TCC and TCS in biosolids-amended soils under field conditions.
Supplementary Material
Acknowledgement
Support for this project was provided by the National Institute of Environmental Health Sciences (NIEHS) Training Grant ES 07141for CPH, NIEHS research grant 1R01ES015445, and the JHU Center for a Livable Future. The authors would like to thank Lynn Roberts and Joseph Bressler for granting access to instrumentation.
References
- [1].Sabaliunas D, Webb SF, Hauk A, Jacob M, Eckhoff WS. Environmental fate of Triclosan in the River Aire Basin, UK. Water Res. 2003;37:3145–3154. doi: 10.1016/S0043-1354(03)00164-7. [DOI] [PubMed] [Google Scholar]
- [2].Scientific Committee on Consumer Products . Opinion on Triclocarban for other uses than as a preservative. European Commission, Health and Consumer Protection Directorate-General; Brussels, Belgium: 2005. [Google Scholar]
- [3].Heidler J, Sapkota A, Halden RU. Partitioning, persistence, and accumulation in digested sludge of the topical antiseptic triclocarban during wastewater treatment. Environ Sci Technol. 2006;40:3634–3639. doi: 10.1021/es052245n. [DOI] [PMC free article] [PubMed] [Google Scholar]
- [4].Heidler J, Halden RU. Mass balance assessment of triclosan removal during conventional sewage treatment. Chemosphere. 2007;66:362–369. doi: 10.1016/j.chemosphere.2006.04.066. [DOI] [PubMed] [Google Scholar]
- [5].U.S. Environmental Protection Agency . Targeted National Sewage Sludge Survey. EPA-822-R-08-016. Office of Water; Washington, DC: 2009. [Google Scholar]
- [6].Stasinakis AS, Petalas AV, Mamais D, Thomaidis NS, Gatidou G, Lekkas TD. Investigation of triclosan fate and toxicity in continuous-flow activated sludge systems. Chemosphere. 2007;68:375–381. doi: 10.1016/j.chemosphere.2007.01.047. [DOI] [PubMed] [Google Scholar]
- [7].Federle TW, Kaiser SK, Nuck BA. Fate and effects of triclosan in activated sludge. Environ Toxicol Chem. 2002;21:1330–1337. [PubMed] [Google Scholar]
- [8].Gledhill WE. Biodegradation of 3,4,4'-Trichlorocarbanilide, TCC, in Sewage and Activated-Sludge. Water Res. 1975;9:649–654. [Google Scholar]
- [9].Ying GG, Yu XY, Kookana RS. Biological degradation of triclocarban and triclosan in a soil under aerobic and anaerobic conditions and comparison with environmental fate modelling. Environ Pollut. 2007;150:300–305. doi: 10.1016/j.envpol.2007.02.013. [DOI] [PubMed] [Google Scholar]
- [10].McMurry LM, Oethinger M, Levy SB. Overexpression of marA, soxS, or acrAB produces resistance to triclosan in laboratory and clinical strains of Escherichia coli. FEMS Microbiol Lett. 1998;166:305–309. doi: 10.1111/j.1574-6968.1998.tb13905.x. [DOI] [PubMed] [Google Scholar]
- [11].Kinney CA, Furlong ET, Kolpin DW, Burkhardt MR, Zaugg SD, Werner SL, Bossio JP, Benotti MJ. Bioaccumulation of pharmaceuticals and other anthropogenic waste indicators in earthworms from agricultural soil amended with biosolid or swine manure. Environ Sci Technol. 2008;42:1863–1870. doi: 10.1021/es702304c. [DOI] [PubMed] [Google Scholar]
- [12].Xia K, Hundal LS, Kumar K, Armbrust K, Cox AE, Granato TC. Triclocarban, triclosan, polybrominated diphenyl ethers, and 4-nonylphenol in biosolids and in soil receiving 33-year biosolids application. Environ Toxicol Chem. 2010;29:597–605. doi: 10.1002/etc.66. [DOI] [PubMed] [Google Scholar]
- [13].Lozano N, Rice CP, Ramirez M, Torrents A. Fate of triclosan in agricultural soils after biosolid applications. Chemosphere. 2010;78:760–766. doi: 10.1016/j.chemosphere.2009.10.043. [DOI] [PubMed] [Google Scholar]
- [14].Cha JM, Cupples AM. Detection of the antimicrobials triclocarban and triclosan in agricultural soils following land application of municipal biosolids. Water Res. 2009;43:2522–2530. doi: 10.1016/j.watres.2009.03.004. [DOI] [PubMed] [Google Scholar]
- [15].Miller TR, Heidler J, Chillrud SN, Delaquil A, Ritchie JC, Mihalic JN, Bopp R, Halden RU. Fate of triclosan and evidence for reductive dechlorination of triclocarban in estuarine sediments. Environ Sci Technol. 2008;42:4570–4576. doi: 10.1021/es702882g. [DOI] [PMC free article] [PubMed] [Google Scholar]
- [16].Orvos DR, Versteeg DJ, Inauen J, Capdevielle M, Rothenstein A, Cunningham V. Aquatic toxicity of triclosan. Environ Toxicol Chem. 2002;21:1338–1349. [PubMed] [Google Scholar]
- [17].Davis HC, Hidu H. Effects of pesticides on embryonic development of clams and oysters and on survival and growth of the larvae. Fish Bull. 1969;67:393–404. [Google Scholar]
- [18].Ahn KC, Zhao B, Chen J, Cherednichenko G, Sanmarti E, Denison MS, Lasley B, Pessah IN, Kultz D, Chang DPY, Gee SJ, Hammock BD. In vitro biologic activities of the antimicrobials triclocarban, its analogs, and triclosan in bioassay screens: Receptor-based bioassay screens. Environ Health Persp. 2008;116:1203–1210. doi: 10.1289/ehp.11200. [DOI] [PMC free article] [PubMed] [Google Scholar]
- [19].Chen J, Ki CA, Gee NA, Ahmed MI, Duleba AJ, Zhao L, Gee SJ, Hammock BD, Lasley BL. Triclocarban enhances testosterone action: A new type of endocrine disruptor? Endocrinology. 2008;149:1173–1179. doi: 10.1210/en.2007-1057. [DOI] [PMC free article] [PubMed] [Google Scholar]
- [20].Coogan MA, Edziyie RE, La Point TW, Venables BJ. Algal bioaccumulation of triclocarban, triclosan, and methyl-triclosan in a North Texas wastewater treatment plant receiving stream. Chemosphere. 2007;67:1911–1918. doi: 10.1016/j.chemosphere.2006.12.027. [DOI] [PubMed] [Google Scholar]
- [21].Coogan MA, La Point TW. Snail bioaccumulation of triclocarban, triclosan, and methyltriclosan in a North Texas, USA, stream affected by wastewater treatment plant runoff. Environ Toxicol Chem. 2008;27:1788–1793. doi: 10.1897/07-374.1. [DOI] [PubMed] [Google Scholar]
- [22].Balmer ME, Poiger T, Droz C, Romanin K, Bergqvist PA, Muller MD, Buser HR. Occurrence of methyl triclosan, a transformation product of the bactericide triclosan, in fish from various lakes in Switzerland. Environ Sci Technol. 2004;38:390–395. doi: 10.1021/es030068p. [DOI] [PubMed] [Google Scholar]
- [23].Higgins CP, Paesani ZP, Chalew TEA, Halden RU. Bioaccumulation of Triclocarban in Lumbriculus variegatus. Environ Toxicol Chem. 2009;28:2580–2586. doi: 10.1897/09-013.1. [DOI] [PMC free article] [PubMed] [Google Scholar]
- [24].Bouche A. Earthworm species and ecotoxicological studies. In: Greig-Smith PW, Becker H, Edwards PJ, Heimbach F, editors. Ecotoxicology of Earthworms. Intercept; Andover, UK: 1992. pp. 20–35. [Google Scholar]
- [25].Cuendet G. Predation on earthworms by the black-headed gull (Larus ridibndus L.) In: Satchell JE, editor. Earthworm Ecology. Chapman and Hall; London, UK: 1983. pp. 415–424. [Google Scholar]
- [26].Connell DW, Markwell RD. Bioaccumulation in the Soil to Earthworm System. Chemosphere. 1990;20:91–100. [Google Scholar]
- [27].U.S. Environmental Protection Agency . Test Methods for Evaluating Solid Wastes: Physical/Chemical Methods. 3rd ed. Office of Solid Waste and Emergency Response; Washington, D.C: 1996. Method 3050B. Acid Digestion of Sediments, Sludges, and Soils; pp. 3050B-3051–3050B-3012. EPA SW-846. [Google Scholar]
- [28].Van Handel E. Rapid-Determination of Total Lipids in Mosquitos. J Am Mosquito Control Assoc. 1985;1:302–304. [PubMed] [Google Scholar]
- [29].Landrum PF. Bioavailability and toxicokinetics of polycyclic aromatic-hydrocarbons sorbed to sediments for the amphipod Pontoporeia-Hoyi. Environ Sci Technol. 1989;23:588–595. [Google Scholar]
- [30].Morrison HA, Gobas FAPC, Lazar R, Haffner GD. Development and verification of a bioaccumulation model for organic contaminants in benthic invertebrates. Environ Sci Technol. 1996;30:3377–3384. [Google Scholar]
Associated Data
This section collects any data citations, data availability statements, or supplementary materials included in this article.