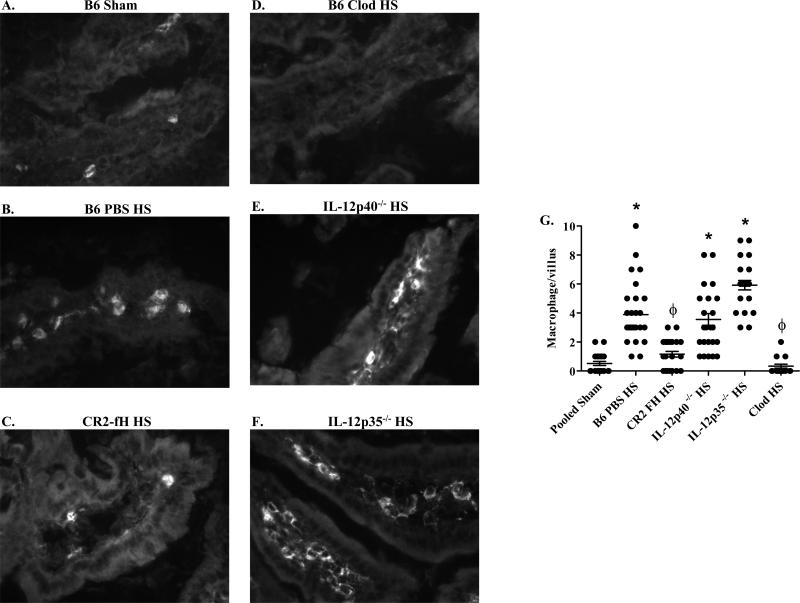
FIGURE 2. Macrophages infiltrate into the intestinal tissue following hemorrhage.
Mid-jejunal tissue sections from C57Bl/6 (B6) (A-D), IL-12p40-/- (E) or IL-12p35-/- (F) mice after Sham (A) or hemorrhage (HS) (B-F) treated with liposomes containing PBS (B), CR2-fH (C) or liposomes containing clodronate (Clod) (D) were stained for F4/80. Photomicrographs original magnification of 400X (A-C) or 200X (D-F) are representative of three individual experiments with 5-7 photos per treatment group in each experiment. The number of macrophages per villus was quantitated from 3-4 mice per treatment group with 20-30 villi per mouse (G). (*) Indicates p ≤ 0.05 compared to respective pooled Sham treatment; (ϕ) indicates p ≤ 0.05 compared to C57Bl/6 HS-treated animals.

