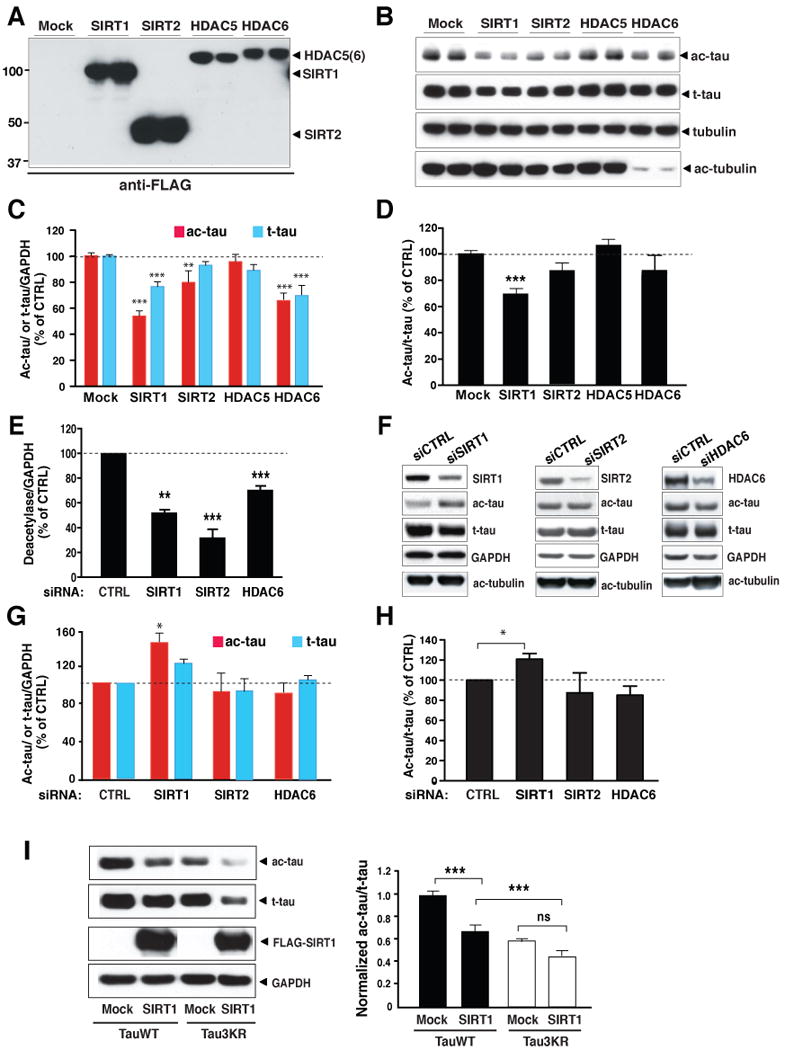
Figure 3. SIRT1 Deacetylates Tau in Culture.

(A–D) SIRT1 overexpression lowered ac-tau levels in HEK293T cells. (A) Western blot showing expression of FLAG-tagged SIRT1, SIRT2, HDAC5, or HDAC6 with an anti-FLAG antibody. Blots are representative of 2–3 experiments. (B) Western blot showing levels of ac-tau, t-tau, tubulin, and ac-tubulin in cells overexpressing SIRT1, SIRT2, HDAC5, or HDAC6. Blots are epresentative of 2–3 experiments. (C) Overexpression of SIRT1, SIRT2 or HDAC6 significantly reduced levels of ac-tau/GAPDH. Levels of t-tau were also reduced by SIRT1 or HDAC6 overexpression. n=9–18 from 6–10 independent experiments. ***, P < 0.001 (Mock vs. SIRT1 or Mock vs. HDAC6); **, P < 0.01 (Mock vs. SIRT2) (two-way ANOVA and Bonferroni posthoc test). (D) Overexpression of SIRT1 significantly reduced ac-tau/t-tau. n=9–18 from 6–10 independent experiments, ***, P<0.001 (Mock vs. SIRT1) (one-way ANOVA and Tukey-Kramer posthoc test).
(E–H) Inhibition of SIRT1 elevated ac-tau in HEK293T cells. (E) Inhibition of SIRT1, SIRT2, or HDAC6 expression mediated by siRNA transfections. n=4–6 from 2–3 experiments. **, P =0.0015; ***, P=0.0001 (SIRT2 vs. control) or P=0.001 (HDAC6 vs. control) (paired t test). (F) Western blot showing levels of ac-tau, t-tau, tubulin, and ac-tubulin in cells transfected with control siRNA or siRNA targeting SIRT1, SIRT2, or HDAC6. Blots are representative of 2–3 experiments. (G–H) Inhibition of SIRT1, significantly elevated levels of ac-tau/GAPDH (G) or ac-tau/t-tau (H). n=4–6 from 2–3 experiments. *, P<0.05 (paired t test). Levels of deacetylase/GAPDH (E), ac-tau or t-tau/GAPDH (G), and ac-tau/t-tau (H) in control siRNA-transfected cells were set as 1. Also see Figure S3 for comparison of levels of ac-tau in MEFs with (SIRT1+/+) or without SIRT1 (SIRT1−/−).
(I) Deacetylation of Tau3KR by SIRT1. Left: Representative western blot showing levels of ac-tau, t-tau, FLAG-tagged SIRT1, and GAPDH. Right: Ac-tau/t-tau levels in mock-transfected cells expressing wildtype tau were set as 1. n=10–20 from 4–10 independent experiments. ***, P<0.001; ns, not significant (one-way ANOVA and Tukey-Kramer posthoc analysis). Values are means ± SEM (C–E, G–I)
