

Summary
Background and Aims
An epidemiological link between an increased body mass index and complaints of typical heartburn symptoms has been identified. It appears that increasing waist circumference, rather than overall weight is most important. Studies to date have not included minority, impoverished communities. Our aim was to determine the impact of obesity on the prevalence of reflux disease in an impoverished community while controlling for known confounders.
Methods: Design
Cross-sectional survey delivered by in-home interviews, convenience sampling, and targeted mailing. Data queried include demographics, medical history, lifestyle habits, and symptoms of reflux disease. Height, weight, hip and waist circumference measured in participating subjects.
Participants
503 subjects living in the zip code immediately surrounding Temple University Hospital. Included only adults living in the hospital’s zip code for at least 3 years.
Results
The highest quartile of waist circumference (≥42 in.) demonstrated a strong association with GERD (AOR = 2.15; 95% CI 1.18–3.90). Smoking increased the odds by 1.72 (95% CI 1.13–2.62). There was no relationship between body mass index, waist—hip ratio, or diet and reflux classification.
Conclusions
Increasing waist circumference, but not overall body mass index or waist—hip ratio, and smoking are risk factors for prevalent GERD. No association between reflux disease and lifestyle choices such as coffee drinking and fast food dining were found.
Limitations
Potential for recall bias and disease misclassification. Possible methodological errors in self-measurement of waist and hip circumference.
Keywords: Gastroesophageal reflux disease, Minority, Body mass index, Obesity
Introduction
Many studies conducted throughout the world have found an epidemiological link between obesity and an increased prevalence of gastroesophageal reflux disease (GERD), Barrett’s esophagus, and esophageal adenocarcinoma [1–5]. Data on this epidemiological link from the US and Europe are primarily from Caucasian populations, although there is emerging data from Asia [6,7]. There is an increasing recognition that central obesity, rather than overall body mass index (BMI) is a particularly strong risk factor for GERD and its complications [8,9].
Data on the prevalence of GERD in African Americans residing in impoverished communities is limited. Even less is known about the prevalence of GERD and its relationship to obesity in this population group. Published studies that have included minorities thus far have been methodologically limited by bias related to referral and recruitment. For example, endoscopic studies which have reported the prevalence of GERD and its relationship to obesity in minorities have used groups which included hospital employees or those referred for the evaluation of symptoms [10,3,11]. Other studies have used large groups of patients already enrolled in a healthcare system, not the general population [12,13].
Our purpose was to overcome potential bias by recruiting a large random sample of subjects who are representative of the whole population of interest. Our purpose was to determine whether obesity and its anatomical distribution would also be an important risk for GERD in this population. Potential confounders to this relationship such as diet, alcohol, and smoking were explored.
Patients and methods
Patients
Temple University Hospital is located in the Southwestern portion of the 19140 zip code, a 3.1 mi2 region of North Philadelphia, PA. In census data from 2000, there were 57,125 citizens of which 74.3% were ≥18 years (www.city-data.com/zips/19140). The population density for this region was 17,792 people/mi2 residing in a total of 22,188 individual households. As of 2000, there were 34,703 (60.7%) black and 19,720 (34.5%) Hispanic citizens, primarily first and second generation individuals from Puerto Rico in this zip code. The median age of the entire zip code was 30.1 years and 46.2% were males. It is an impoverished region with a median family income is $20,077, and median home value of $30,200. For decades our hospital has been the only hospital providing care for adults in this zip code.
Survey methodology
Our survey consists of demographic questions, self-collected anthropometric data (height, weight, waist and hip circumference), alcohol and tobacco use, medical problems, medications, exercise habits, and dietary habits. In addition, detailed questions on GERD including frequency, severity, episodes of regurgitation, and nocturnal symptoms are included. Treatment for GERD and physician visits for GERD are queried.
Because our survey requires self-measurement of height, weight, waist circumference, and hip circumference, we first sampled 24 consecutive patients, from the same targeted zip code (19140), in our gastroenterology offices to assess both feasibility and validity of these self-collected measures. The survey provides a diagram illustrating where to measure waist and hip circumference. Patients measured these four anthropometric parameters themselves in an exam room equipped with a scale and stadiometer following the survey’s directions. Self-measurement was then followed by a physician assessment. The correlation coefficients for height, weight, hip circumference, and waist circumference were excellent at 0.79, 1.00, 0.92 and 0.95 respectively.
Mailed surveys
Our initial sample collection effort was a mailing to random households throughout the 19140 zip code. A cover letter provided details of the study and participant eligibility. Only individuals ≥18 years residing in the zip code for ≥3 years were eligible to participate. We used a cutoff of ≥3 years to avoid ecological confounding. That is, we attempted to capture residents who were members of the targeted community for a considerable period of time. Up to three eligible subjects could complete the survey at each household. We mailed 750 self-addressed envelopes, each containing three surveys (total surveys mailed, 2250) and paper tape measures. Due to an insufficient response (n = 149 completed surveys from 82 unique households were returned), alternative strategies were developed.
Convenience sampling
In the second phase of our study, a convenience sample was recruited at a retail pharmacy located two blocks from our hospital. A booth was placed in the front of the store staffed by a member of the research team between 9 am and 3 pm on one to two days per week. Subjects had the same eligibility requirements and were required to produce a picture identification (e.g. drivers license) confirming they resided in the 19140 zip code and over 18 years. All subjects were eligible regardless of race. Subjects were directed to a private location within the pharmacy where they completed the survey and anthropometrics measurements unaided. A scale and tape measure were provided. A total of 264 interviews were completed in this manner.
At-home interviews
In order to minimize bias related to convenience sampling and meet recruitment requirements, a third and final phase was performed. Using a map of the zip code, the residence location of completed surveys was examined for distribution. The area east of the hospital was underrepresented by respondents using the two methods described above and this was targeted for in-home interviews. The research team began two blocks east of the hospital staying within the 19140 zip code area and walked down each successive street in an eastward direction until 90 at-home surveys were completed. Again, subjects had to be residents for ≥3 years. Administration of the questionnaire was approved by our Institutional Review Board.
Data collection and statistical analysis
The primary outcome, the presence of GERD, was considered categorically. The global definition of GERD developed by the modified Delphi process (i.e. the “Montreal classification”) was used to classify GERD status [14]. Subjects were considered to be GERD positive if they met one of the following:
GERD symptoms ≥2 days per week that the subject considers troublesome. Our survey asks subjects on a 0 (none)–5 (severe) Likert scale to assess how their heartburn affected overall health and well-being. Subjects with a score of 3–4 were felt to have “troublesome” GERD.
Severe GERD symptoms ≥1 day per week that the subject considers troublesome. For this we only included subjects who had 1 day of symptoms but circled 5 for effect on health.
Statistical analysis
After assessing distributional assumptions, comparisons of categorical and continuous variables were accomplished using the χ2 statistic and the two-sample independent t-test, one-way analysis of variance, or non-parametric Wilcoxon rank test, respectively. Multivariate analysis of predictors of GERD status was performed using binary logistic regression modeling. Explanatory risk factors of interest including those found to be significant (P < 0.05) by unadjusted analysis were entered into the model. In developing the model we planned a priori that BMI would be entered as a potential predictor variable of an individual’s GERD status. This variable was considered in hypothesis generation and sample size calculation. After reviewing the univariate results, we evaluated waist circumference for colinearity with BMI. Colinearity with BMI was not established (r2 = 0.40) and therefore waist circumference was included in a separate model. For the regression analysis, BMI was stratified into four categories (≤25, 25.1–29.9, 30.0–34.9, and ≥35). Waist circumference was categorized by quartiles using the measurements of the entire sample group to derive the quartile values. The odds ratios from the regression were adjusted for age. Gender was analyzed as an effect modifier by examining the Wald χ2 statistic stratified by this variable. The Wald χ2 statistic differed by <10% in the stratified model and gender was not included as an effect modifier. All respondent data was recorded using Microsoft Access (Microsoft™, Redmond, WA) and downloaded into IBM SPSS Statistics 18 (IBM, Chicago, IL) for analysis.
Sample size calculation
To determine the necessary sample size, we hypothesized that obesity would be important in the causal pathway. We powered the study to determine whether BMI, considered as a continuous value, had an independent relationship (considered 2-tailed) with GERD (HA). The null hypothesis (H0) was that BMI would not be associated independently with GERD. In order to detect a mean BMI difference of at least 3 units between individuals with and without GERD, assuming the mean BMI of the study group resembles that of the US population in 2003–2006 (BMI = 28, standard deviation = 1.1), with α set at 0.05, β at 0.20, and standard deviation equal for both groups, a minimum of 100 GERD positive and 100 GERD negative subjects needed to be surveyed [15]. We estimated that the prevalence of GERD in our surveyed population would be 20% [16] and therefore a total of 500 surveys needed to be completed.
Results
Overall, 503 subjects were recruited for study participation. There were n = 129 (25.6%) subjects who met the clinical criteria for GERD. As shown in Table 1, females outnumbered males and the number of African American participants was high as expected. Most participants were high school graduates who had health insurance. Many in our study group approached or exceeded unhealthy thresholds for waist—hip ratio [17]. The average BMI of all participants (29.6 ± 9.1) was very high, and both those with and without GERD reported gaining considerable weight since age 18. The prevalence of cardiovascular disease (primarily hypertension), pulmonary disease (primarily asthma and COPD), and diabetes were similar in both groups as was the use of NSAID’s/ASA and calcium channel blockers.
Table 1.
Characteristics of the study group.
| Variables | GERD+n = 129 | GERD− n = 374 | P-value |
|---|---|---|---|
| Age, mean (SD) | 44.9 (15.9) | 42.3 (17.2) | 0.13 |
| Males, n (%) | 48 (37.2) | 147 (39.3) | 0.72 |
| African American, n (%) | 106 (82.2) | 324 (86.6) | 0.54 |
| High school graduate, n (%) | 95 (73.6) | 304 (81.3) | 0.06 |
| Health insurance, n (%) | 97 (75.2) | 282 (75.4) | 0.96 |
| Anthropometrics | |||
| BMI, mean (SD) | 31.4 (11.3) | 29.0 (8.1) | 0.01 |
| BMI gained since age 18, mean (SD) | 7.6 (8.0) | 6.3 (6.5) | 0.08 |
| Male: waist: hip ratio, mean (SD) | 0.96 (0.13) | 0.95 (0.12) | 0.69 |
| Female: waist: hip ratio, mean (SD | 0.92 (0.15) | 0.89 (0.13) | 0.15 |
| Waist circumference (in.), mean (SD) | 39.4 (7.2) | 37.0 (6.2) | <0.001 |
| Medical problems | |||
| Cardiovascular disease, n (%) | 51 (39.5) | 133 (35.6) | 0.42 |
| Chronic pulmonary disease, n (%) | 14 (10.9) | 38 (10.2) | 0.82 |
| Diabetes, n (%) | 17 (13.2) | 36 (9.6) | 0.26 |
| Medications | |||
| Current calcium channel blocker, n (%) | 13 (10.1) | 18 (4.8) | 0.03 |
| Current on NSAID/ASA, n (%) | 27 (20.9) | 60 (16.0) | 0.21 |
| Lifestyle behaviors | |||
| Current smoker, n (%) | 63 (51.2) | 140 (37.9) | 0.03 |
| ≥4 alcoholic beverages per week, n (%) | 26 (20.2) | 67 (17.9) | 0.57 |
| Coffee drinks per day, mean (SD) | 0.91 (1.1) | 0.78 (1.1) | 0.22 |
| Fresh fruit servings per day, mean (SD) | 2.2 (1.5) | 2.3 (1.5) | 0.42 |
| Cooked vegetable servings per day, mean (SD) | 2.5 (1.4) | 2.4 (1.4) | 0.55 |
| Daily salad intake, n (%) | 19 (15.0) | 73 (19.9) | 0.21 |
| Soda beverage drinks per day, mean (SD) | 1.8 (1.4) | 1.7 (1.5) | 0.50 |
| “Fast food” meals per week, mean (SD) | 1.5 (1.2) | 1.6 (1.4) | 0.49 |
BMI—body mass index (kg/m2).
The table also reviews the data for lifestyle habits among the groups. The prevalence of current alcohol use was high and eating at fast food restaurants was common. On average, respondents consumed about one coffee drink per day and two servings each of fresh fruit and cooked vegetables. About one of five participants ate a salad on a daily basis.
Potential predictor variables associated with prevalent GERD from Table 1 included BMI, waist circumference, use of calcium channel blockers, and smoking. Current use of tobacco was associated with GERD, however prior use was not. Attaining a high school degree was not associated (P = 0.06). Unlike a previous study weight gained since age 18 was not associated [18].
All three survey methods yielded nearly identical demographic, medical history, and lifestyle practices (data not shown). There was no statistical difference (P = 0.26) in the prevalence of GERD between the three groups. The only noteworthy difference was those completing mailed surveys had a higher prevalence of hypertension (46.9%, P = 0.003 compared to other two groups) and more frequent use of calcium channel blockers.
Table 2 highlights the prevalence and impact of reflux symptoms as well as treatment choices of the study group stratified by survey method. It illustrates that while 25.6% of the respondents met the Montreal classification for GERD, an additional 16.5% experienced some degree of reflux symptoms. Of those with heartburn, approximately one third experienced nocturnal symptoms “sometimes”, and about one in fifteen experienced this complaint “all the time”. Patients who were interviewed at their home suffered from nocturnal GERD more often than the other groups (P = 0.04). Of those with heartburn, about one third had discussed this symptom with their physician. About 25% of participants with heartburn symptoms were taking medication for relief. Those interviewed at home were more likely to be on some type of antacid remedy (P = 0.01).
Table 2.
GERD-related symptoms and treatment by method of recruitment.
| Variable | Overall | Mailed survey | Convenience sample | In-home interview | P-value |
|---|---|---|---|---|---|
| n = 149 | n = 264 | n = 90 | |||
| Do you ever experience heartburn? n (%) | 212 (42.1) | 72 (48.3) | 106 (40.2) | 34 (38.9 | 0.71 |
| If yes, how many days per week? (mean, SD) | 2.8 (2.0) | 2.6 (1.7) | 2.8 (2.0) | 3.2 (2.3) | 0.66 |
| If yes, how much does heartburn affect your overall well-being? (mean, SD)a | 2.0 (1.5) | 1.5 (1.4) | 2.2 (1.5) | 2.1 (1.6) | 0.54 |
| If yes, have you discussed heartburn problem with your doctor? n (%) | 67 (31.6) | 25 (34.7) | 30 (28.3) | 12 (35.3) | 0.11 |
| Meet Montreal classification, n (%) | 129 (25.6) | 32 (21.5) | 69 (26.1) | 28 (31.1) | 0.25 |
| Do you experience heartburn after you lay down for sleep?b | |||||
| Never, n (%) | 133 (62.7) | 42 (58.3) | 71 (67.0) | 20 (58.8) | 0.11 |
| Sometimes, n (%) | 65 (30.7) | 26 (35.7) | 29 (27.0) | 10 (30.0) | 0.21 |
| All the time, n (%) | 14 (6.6) | 4 (5.5) | 6 (5.7) | 4 (11.8) | 0.04 |
| Take medicines for heartburn?b n (%) | 58 (27.7) | 17 (23.6) | 27 (25.5) | 14 (41.2) | 0.01 |
| Proton pump inhibitor/H2 blockers, n (%) | 24 (41.4) | 9 (52.9) | 12 (44.4) | 3 (21.4) | 0.04 |
| Days per week (mean, SD) | 5.3 (3.3) | 5.4 (2.4) | 4.6 (2.5) | 6.7 (4.6) | 0.10 |
On a 0 (none) to 5 (severe) scale.
Reflects only patients who stated they had heartburn.
Regression model
The final model, using potential predictor variables from Table 1 included BMI, waist circumference (considered separately and together with BMI), calcium channel blockers, and smoking. As seen in Table 3, there was no relationship between BMI and GERD classification. Smoking was independently associated with GERD, however calcium channel blockers had no relationship. The analysis was repeated, substituting waist circumference as a measure of obesity categorized by quartiles derived from the study subjects. The highest quartile of waist circumference (≥42 in.) demonstrated a strong association with GERD (AOR = 2.15; 95% CI 1.18–3.90). Substituting waist circumference for BMI had little impact on the relationships between smoking, calcium channel blockers and GERD. In the final model, including both waist circumference and BMI, the highest quartile of waist circumference remained closely associated with GERD status (AOR = 2.46; 95% CI 1.06–5.75). Smoking remained associated (AOR = 1.77; 95% CI 1.15–2.72), while BMI and calcium channel blockers remained unassociated. For those individuals who smoked and were in the highest quartile of waist circumference, the AOR = 1.99; 95% CI 1.08–3.70: P = 0.03 for the interaction of these risk factors.
Table 3.
Odds ratios for the prediction of patients meeting the Montreal classification for reflux disease using body mass index as measure of obesity.
| Variables | Unadjusted odds ratio | 95% CI | Adjusteda odds ratio | 95% CI | P-valueb |
|---|---|---|---|---|---|
| Calcium channelBlocker intake | |||||
| No | Reference | ||||
| Yes | 1.82 | 0.84–3.96 | 1.52 | 0.68–3.41 | 0.31 |
| Current smoking | |||||
| No | Reference | ||||
| Yes | 1.73 | 1.14–2.63 | 1.74 | 1.15–2.65 | 0.01 |
| Body mass index | |||||
| ≤25 | Reference | ||||
| 25.1–29.9 | 0.89 | .50–1.58 | 0.87 | .49–1.55 | 0.64 |
| 30.0–34.9 | 1.72 | .98–3.01 | 1.63 | .93–2.87 | 0.09 |
| ≥35 | 1.67 | .89–3.14 | 1.71 | .91–3.20 | 0.10 |
Adjusted for age.
P-value for adjusted odds ratios only.
Discussion
Our study represents the first survey of a community of impoverished individuals in the US which reports on the prevalence of GERD and its relationship to obesity. Similar to studies with alternative survey approaches, we found an association between waist circumference and gastroesophageal reflux disease. The strength of our study and its consistency with others supports that central obesity, rather than overall BMI, is of primary importance in predisposing to GERD. We found no relationship between overall BMI and GERD prevalence. Conversely, those study individuals in the highest quartile of waist circumference (≥42 in.) had more than double the odds of having GERD (AOR = 2.15; 95% CI 1.18–3.90). We also found that active smoking increased the odds ratio considerably compared to non-smokers (AOR = 1.70; 95% CI 1.12–2.59) (Table 4).
Table 4.
Odds ratios for the prediction of patients meeting the Montreal classification for reflux disease using waist circumference as measure of obesity.
| Variables | Unadjusted odds ratio | 95% CI | Adjusteda odds ratio | 95% CI | P-valueb |
|---|---|---|---|---|---|
| Calcium channelBlocker intake | |||||
| No | Reference | ||||
| Yes | 2.22 | 1.01–4.86 | 1.75 | 0.76–4.04 | 0.19 |
| Current smoking | |||||
| No | Reference | ||||
| Yes | 1.68 | 1.11–2.56 | 1.70 | 1.12–2.59 | 0.01 |
| Waist circumference (in.) | |||||
| ≤33 | Reference | ||||
| 33.1–36.9 | 0.84 | 0.43–1.64 | 0.84 | 0.43–1.65 | 0.61 |
| 37.0–41.9 | 1.73 | 0.96–3.12 | 1.65 | 0.91–3.01 | 0.10 |
| ≥42 | 2.16 | 1.19–3.90 | 2.15 | 1.18–3.90 | 0.01 |
Adjusted for age.
P-value for adjusted odds ratios.
Our results agree with those of other studies which have included anthropometric measurements. Using data from the Kaiser Permanente MultiPhasic Health Check-Up cohort, Corley et al. found a relationship between abdominal diameter (measured as the AP diameter at the iliac crest while standing) and reflux symptoms (OR = 1.85; 95% CI 1.55–2.21). This finding was independent of BMI and only present in the white but not the black or Asian population [12]. El-Serag et al. analyzed a group of individuals presenting for 24-h esophageal pH measurement. They found that both waist circumference and BMI were associated with pH parameters of increased acid reflux, however waist circumference appeared to be the primary link between obesity and pH results [19].
Central obesity may have implications beyond only GERD. Edelstein et al. found that an increasing waist circumference was associated with visible and long-segment Barrett’s in a cohort of recently diagnosed patients from community clinics [8]. The risk of long-segment Barrett’s was substantial (OR = 3.2; 95% CI 1.4–7.5) for individuals in the highest quartile of waist circumference. They also found that waist—hip ratio was associated with the presence of Barrett’s. Similarly, Corley found in another study that increasing abdominal obesity (using a cutoff of 80 cm), independent of BMI, was associated with both GERD and Barrett’s esophagus (OR = 2.24; 95% CI 1.21–4.15) [20].
There are probably several contributing factors to the association between central obesity and GERD. Lambert demonstrated that central obesity translates into an elevated pressure within the intra-abdominal cavity which can promote reflux [21]. This was recently confirmed by another group [22]. El-Serag et al. demonstrated an increase of intragastric pressure with increasing central obesity [23]. Pandolfino et al. demonstrated that waist circumference correlated significantly with intragastric pressure and the pressure gradient between the stomach and esophagus [24]. Motor disorders of the esophageal body, lower esophageal sphincter (including increased frequency of transient LES relaxations), and stomach have all been reported although their contribution to the association between obesity and GERD remain speculative [24–38]. Whether a neurohumoral mechanism also contributes is purely speculative, however visceral adipose tissue is highly active metabolically and synthesizes several inflammatory cytokines and other peptides [39] (Fig. 1).
Figure 1.

Relationship between waist circumference categorized by quartiles and frequency of GERD. Quartile cutoff values for waist circumference are: Q1 = <33, Q2 = 33.1–36.9, Q3 = 37.0–41.9 and Q4 = ≥42.
The association between smoking and GERD is an important finding of our study and represents another area of intervention. A few studies have reported this previously. Nilsson et al. reported the results of two public health surveys performed in Sweden in the 1980s and 1990s [40]. Analysis from over 40,000 subjects found a moderately strong and dose dependent association between increasing duration of daily tobacco smoking and risk of reflux symptoms (P-value for linear trend < 0.0001). They also found an association between the lifetime quantity smoked and years of smoking with the risk of GERD. Watanabe et al. found that current cigarette smoking was associated with GERD (OR = 1.35; 95% CI 1.01–1.82) in a group of male Japanese citizens undergoing a health check-up [41]. Smoking can cause relaxation of the lower esophageal sphincter leading to increased reflux [42].
There are several features of our study which make it unique and strengthen the results. First, our survey methodology allowed for an unbiased sample of the general community rather than the results of an administrative (e.g. health care network) or endoscopic database. For example, approximately 25% of the included patients had no access to healthcare except on an emergent basis and would have been excluded from previous studies. Therefore biased prevalence estimates due to inclusion of only a subset of the population (e.g. only those who seek health care, or can read well, or are employed) was avoided (Figure 2). This methodology requires considerable effort to perform but is likely to give far more reliable and valid results. A second important strength of our study is the population which was targeted. Very few epidemiological studies on GERD (or other diseases for that matter) have been performed in areas plagued by extreme poverty and low educational achievement. Many variables, both measured and unmeasured, likely influence the prevalence of GERD and obesity in these types of communities. Our results likely are representative of other racial populations with similar demographic features such as those that exist in many Caucasian Appalachian communities. Thirdly, this is the first study to our knowledge to use the increasingly accepted Montreal classification to define GERD cases [14]. We suspect that responder misclassification was minimal using this system. Finally, we took into consideration the possibility of ecological confounding and limited the study to participants residing in the community for at least 3 years.
Figure 2.
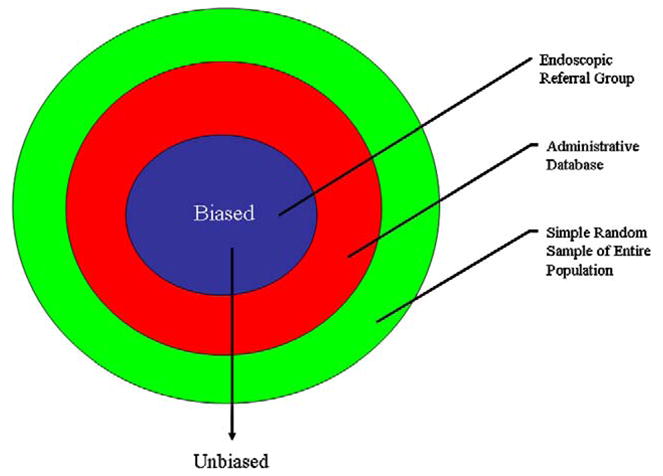
Proposed relationship between survey methodology and bias in studies looking at obesity and GERD.
One shortcoming of our study is the cross-sectional study design. Associations found from our study cannot establish causality. However, in the face of consistent, biologically plausible data linking waist circumference and smoking to GERD, these potential risk factors are likely to be valid. A second potential shortcoming is the potential for error in self-measurement of body anthropometrics. However, we were able to show in a pilot study that this error was likely to be insignificant and without directionality. Finally one strength lead to a potential weakness. We queried diet history and weight at age 18 as potential risk factors for GERD, however answers to both questions are subject to recall bias.
Conclusion
We found that increasing waist circumference and smoking are risk factors for prevalent GERD. This is the first prospective, truly population-based evaluation of an impoverished community looking at these issues. We confirmed that overall BMI appears to be much less important than fat distribution. The directionality of our findings and those of previous studies are consistent. Biologic plausibility has been established from physiologic studies. In the future, targeted treatment of central obesity will be important for the reduction of GERD and its related complications in our society.
Acknowledgments
Funding source
None.
Abbreviations
- AOR
adjusted odds ratio
- ASA
aspirin
- BMI
body mass index
- CI
confidence interval
- GERD
gastroesophageal reflux disease
- NSAID
non-steroidal anti-inflammatory drug
Footnotes
Contributors
Frank K. Friedenberg: study concept and design; Frank K. Friedenberg, Deborah B. Nelson: data analysis and interpretation; Vishwas Vanar: database design; Joel Richter: manuscript review; Jitha Rai, Charles Bongiorno, Vishwas Vanar, Mayur Parepally, Arashdeep Poonia, Amol Sharma, Shaun Gohel: data collection.
Conflicts of interest
The authors have no commercial or similar relationships to products or companies mentioned in or related to the subject matter of the article being submitted. This manuscript was completed without funding.
References
- 1.Kuczmarski RJ, Flegal KM, Campbell SM, Johnson CL. Increasing prevalence of overweight among US adults. The National Health and Nutrition Examination Surveys, 1960 to 1991. JAMA. 1994;272:205–11. doi: 10.1001/jama.272.3.205. [DOI] [PubMed] [Google Scholar]
- 2.Crowell MD, Bradley A, Hansel S, Dionisio P, Kim HJ, Decker GA, et al. Obesity is associated with increased 48-h esophageal acid exposure in patients with symptomatic gastroesophageal reflux. Am J Gastroenterol. 2009;104:553–9. doi: 10.1038/ajg.2009.5. [DOI] [PubMed] [Google Scholar]
- 3.El-Serag HB, Graham DY, Satia JA, Rabeneck L. Obesity is an independent risk factor for GERD symptoms and erosive esophagitis. Am J Gastroenterol. 2005;100:1243–50. doi: 10.1111/j.1572-0241.2005.41703.x. [DOI] [PubMed] [Google Scholar]
- 4.Jacobson BC, Somers SC, Fuchs CS, Kelly CP, Camargo CA., Jr Body-mass index and symptoms of gastroesophageal reflux in women. N Engl J Med. 2006;354:2340–8. doi: 10.1056/NEJMoa054391. [DOI] [PMC free article] [PubMed] [Google Scholar]
- 5.Kouklakis G, Moschos J, Kountouras J, Mpoumponaris A, Molyvas E, Minopoulos G. Relationship between obesity and gastroesophageal reflux disease as recorded by 3-hour esophageal pH monitoring. Rom J Gastroenterol. 2005;14:117–21. [PubMed] [Google Scholar]
- 6.Goh KL. Obesity and increasing gastroesophageal reflux disease in Asia. J Gastroenterol Hepatol. 2007;22:1557–8. doi: 10.1111/j.1440-1746.2007.05099.x. [DOI] [PubMed] [Google Scholar]
- 7.Kang MS, Park DI, Oh SY, Yoo TW, Ryu SH, Park JH, et al. Abdominal obesity is an independent risk factor for erosive esophagitis in a Korean population. J Gastroenterol Hepatol. 2007;22:1656–61. doi: 10.1111/j.1440-1746.2006.04518.x. [DOI] [PubMed] [Google Scholar]
- 8.Edelstein ZR, Farrow DC, Bronner MP, Rosen SN, Vaughan TL. Central adiposity and risk of Barrett’s esophagus. Gastroenterology. 2007;133:403–11. doi: 10.1053/j.gastro.2007.05.026. [DOI] [PubMed] [Google Scholar]
- 9.El-Serag HB, Kvapil P, Hacken-Bitar J, Kramer JR. Abdominal obesity and the risk of Barrett’s esophagus. Am J Gastroenterol. 2005;100:2151–6. doi: 10.1111/j.1572-0241.2005.00251.x. [DOI] [PubMed] [Google Scholar]
- 10.Abrams JA, Fields S, Lightdale CJ, Neugut AI. Racial and ethnic disparities in the prevalence of Barrett’s esophagus among patients who undergo upper endoscopy. Clin Gastroenterol Hepatol. 2008;6:30–4. doi: 10.1016/j.cgh.2007.10.006. [DOI] [PMC free article] [PubMed] [Google Scholar]
- 11.Spechler SJ, Jain SK, Tendler DA, Parker RA. Racial differences in the frequency of symptoms and complications of gastro-oesophageal reflux disease. Aliment Pharmacol Ther. 2002;16:1795–800. doi: 10.1046/j.1365-2036.2002.01351.x. [DOI] [PubMed] [Google Scholar]
- 12.Corley DA, Kubo A, Zhao W. Abdominal obesity, ethnicity and gastro-oesophageal reflux symptoms. Gut. 2007;56:756–62. doi: 10.1136/gut.2006.109413. [DOI] [PMC free article] [PubMed] [Google Scholar]
- 13.Friedenberg FK, Hanlon A, Vanar V, Nehemia D, Mekapati J, Nelson DB, et al. Trends in gastroesophageal reflux disease as measured by the National Ambulatory Medical Care Survey. Dig Dis Sci. 2009 doi: 10.1007/s10620-009-1004-0. [DOI] [PubMed] [Google Scholar]
- 14.Vakil N, van Zanten SV, Kahrilas P, Dent J, Jones R Global Consensus Group. The Montreal definition and classification of gastroesophageal reflux disease: a global evidence-based consensus. Am J Gastroenterol. 2006;101:1900–20. doi: 10.1111/j.1572-0241.2006.00630.x. quiz 1943. [DOI] [PubMed] [Google Scholar]
- 15.Ervin RB. Prevalence of metabolic syndrome among adults 20 years of age and over, by sex, age, race and ethnicity, and body mass index: United States, 2003–2006. Natl Health Stat Rep. 2009;13:1–7. [PubMed] [Google Scholar]
- 16.Everhart JE, Ruhl CE. Burden of digestive diseases in the United States part I: overall and upper gastrointestinal diseases. Gastroenterology. 2009;136:376–86. doi: 10.1053/j.gastro.2008.12.015. [DOI] [PubMed] [Google Scholar]
- 17.Brook RD, Bard RL, Rubenfire M, Ridker PM, Rajagopalan S. Usefulness of visceral obesity (waist/hip ratio) in predicting vascular endothelial function in healthy overweight adults. Am J Cardiol. 2001;88:1264–9. doi: 10.1016/s0002-9149(01)02088-4. [DOI] [PubMed] [Google Scholar]
- 18.Rey E, Moreno-Elola-Olaso C, Artalejo FR, Locke GR, 3rd, Diaz-Rubio M. Association between weight gain and symptoms of gastroesophageal reflux in the general population. Am J Gastroenterol. 2006;101:229–33. doi: 10.1111/j.1572-0241.2006.00412.x. [DOI] [PubMed] [Google Scholar]
- 19.El-Serag HB, Ergun GA, Pandolfino J, Fitzgerald S, Tran T, Kramer JR. Obesity increases oesophageal acid exposure. Gut. 2007;56:749–55. doi: 10.1136/gut.2006.100263. [DOI] [PMC free article] [PubMed] [Google Scholar]
- 20.Corley DA, Kubo A, Levin TR, Block G, Habel L, Zhao W, et al. Abdominal obesity and body mass index as risk factors for Barrett’s esophagus. Gastroenterology. 2007;133:34–41. doi: 10.1053/j.gastro.2007.04.046. quiz 311. [DOI] [PubMed] [Google Scholar]
- 21.Lambert DM, Marceau S, Forse RA. Intra-abdominal pressure in the morbidly obese. Obes Surg. 2005;15:1225–32. doi: 10.1381/096089205774512546. [DOI] [PubMed] [Google Scholar]
- 22.Varela JE, Hinojosa M, Nguyen N. Correlations between intra-abdominal pressure and obesity-related co-morbidities. Surg Obes Relat Dis. 2009 doi: 10.1016/j.soard.2009.04.003. [DOI] [PubMed] [Google Scholar]
- 23.El-Serag HB, Tran T, Richardson P, Ergun G. Anthropometric correlates of intragastric pressure. Scand J Gastroenterol. 2006;41:887–91. doi: 10.1080/00365520500535402. [DOI] [PubMed] [Google Scholar]
- 24.Pandolfino JE, El-Serag HB, Zhang Q, Shah N, Ghosh SK, Kahrilas PJ. Obesity: a challenge to esophagogastric junction integrity. Gastroenterology. 2006;130:639–49. doi: 10.1053/j.gastro.2005.12.016. [DOI] [PubMed] [Google Scholar]
- 25.Gallagher TK, Geoghegan JG, Baird AW, Winter DC. Implications of altered gastrointestinal motility in obesity. Obes Surg. 2007;17:1399–407. doi: 10.1007/s11695-007-9221-0. [DOI] [PubMed] [Google Scholar]
- 26.Hirsch DP, Mathus-Vliegen EM, Holloway RH, Fakhry N, D’Amato M, Boeckxstaens GE. Role of CCK(A) receptors in postprandial lower esophageal sphincter function in morbidly obese subjects. Dig Dis Sci. 2002;47:2531–7. doi: 10.1023/a:1020520311938. [DOI] [PubMed] [Google Scholar]
- 27.Hong D, Khajanchee YS, Pereira N, Lockhart B, Patterson EJ, Swanstrom LL. Manometric abnormalities and gastroe-sophageal reflux disease in the morbidly obese. Obes Surg. 2004;14:744–9. doi: 10.1381/0960892041590854. [DOI] [PubMed] [Google Scholar]
- 28.Iovino P, Angrisani L, Galloro G, Consalvo D, Tremolaterra F, Pascariello A, et al. Proximal stomach function in obesity with normal or abnormal oesophageal acid exposure. Neurogastroenterol Motil. 2006;18:425–32. doi: 10.1111/j.1365-2982.2006.00768.x. [DOI] [PubMed] [Google Scholar]
- 29.Kahrilas PJ, Shi G, Manka M, Joehl RJ. Increased frequency of transient lower esophageal sphincter relaxation induced by gastric distention in reflux patients with hiatal hernia. Gastroenterology. 2000;118:688–95. doi: 10.1016/s0016-5085(00)70138-7. [DOI] [PubMed] [Google Scholar]
- 30.Koppman JS, Poggi L, Szomstein S, Ukleja A, Botoman A, Rosenthal R. Esophageal motility disorders in the morbidly obese population. Surg Endosc. 2007;21:761–4. doi: 10.1007/s00464-006-9102-y. [DOI] [PubMed] [Google Scholar]
- 31.Maddox A, Horowitz M, Wishart J, Collins P. Gastric and oesophageal emptying in obesity. Scand J Gastroenterol. 1989;24:593–8. doi: 10.3109/00365528909093095. [DOI] [PubMed] [Google Scholar]
- 32.Mathus-Vliegen EM, van Weeren M, van Eerten PV. Los function and obesity: the impact of untreated obesity, weight loss, and chronic gastric balloon distension. Digestion. 2003;68:161–8. doi: 10.1159/000075525. [DOI] [PubMed] [Google Scholar]
- 33.Merrouche M, Sabaté JM, Jouet P, Harnois F, Scaringi S, Coffin B, et al. Gastro-esophageal reflux and esophageal motility disorders in morbidly obese patients before and after bariatric surgery. Obes Surg. 2007;17:894–900. doi: 10.1007/s11695-007-9166-3. [DOI] [PubMed] [Google Scholar]
- 34.Schneider JH, Kuper M, Konigsrainer A, Brucher B. Transient lower esophageal sphincter relaxation in morbid obesity. Obes Surg. 2009;19:595–600. doi: 10.1007/s11695-009-9809-7. [DOI] [PubMed] [Google Scholar]
- 35.Tosetti C, Corinaldesi R, Stanghellini V, Pasquali R, Corbelli C, Zoccoli G, et al. Gastric emptying of solids in morbid obesity. Int J Obes Relat Metab Disord. 1996;20:200–5. [PubMed] [Google Scholar]
- 36.Wright RA, Krinsky S, Fleeman C, Trujillo J, Teague E. Gastric emptying and obesity. Gastroenterology. 1983;84:747–51. [PubMed] [Google Scholar]
- 37.Wu JC, Mui LM, Cheung CM, Chan Y, Sung JJ. Obesity is associated with increased transient lower esophageal sphincter relaxation. Gastroenterology. 2007;132:883–9. doi: 10.1053/j.gastro.2006.12.032. [DOI] [PubMed] [Google Scholar]
- 38.Zahorska-Markiewicz B, Jonderko K, Lelek A, Skrzypek D. Gastric emptying in obesity. Hum Nutr Clin Nutr. 1986;40:309–13. [PubMed] [Google Scholar]
- 39.Canoz M, Erdenen F, Uzun H, Muderrisoglu C, Aydin S. The relationship of inflammatory cytokines with asthma and obesity. Clin Invest Med. 2008;31:E373–9. doi: 10.25011/cim.v31i6.4924. [DOI] [PubMed] [Google Scholar]
- 40.Nilsson M, Johnsen R, Ye W, Hveem K, Lagergren J. Lifestyle related risk factors in the aetiology of gastro-oesophageal reflux. Gut. 2004;53:1730–5. doi: 10.1136/gut.2004.043265. [DOI] [PMC free article] [PubMed] [Google Scholar]
- 41.Watanabe Y, Fujiwara Y, Shiba M, Watanabe T, Tominaga K, Oshitani N, et al. Cigarette smoking and alcohol consumption associated with gastro-oesophageal reflux disease in Japanese men. Scand J Gastroenterol. 2003;38:807–11. doi: 10.1080/00365520310004506. [DOI] [PubMed] [Google Scholar]
- 42.Kahrilas PJ, Gupta RR. Mechanisms of acid reflux associated with cigarette smoking. Gut. 1990;31:4–10. doi: 10.1136/gut.31.1.4. [DOI] [PMC free article] [PubMed] [Google Scholar]