Abstract
In order to satisfy the high resolution (3 to 10 cycles/mm) imaging requirements in neurovascular image-guided interventional (IGI) procedures, a micro-angiographic fluoroscope (MAF) is being developed to enable both rapid sequence angiography (15 fps) at high exposure levels (hundreds of μR/frame) as well as fluoroscopy at high frame rates (30 fps) and low exposure levels (5 to 20 μR/frame). The prototype MAF consists of a 350-μm-thick CsI(Tl) scintillator coupled by a 2:1 fiber-optical taper to an 18 mm diameter variable-gain light image intensifier with two-stage microchannel plate (MCP) viewed by a 12-bit, 1024x1024, 30 fps CCD camera with digital interface board. The optical set-up enables variation of effective pixel-size from 31 to 50 micron. The first frame lag of the MAF in fluoroscopic 30 fps mode (2:1 binning) was less than 0.8% at exposures of 5-23 μR/frame. MTF, NPS, and DQE in angiographic mode were measured for IEC standard spectrum RQA 5. At spatial frequencies of 4 and 10 cycles/mm the MTF was 14% and 1.5%, and the DQE was 12% and 1.2%, respectively, while the DQE(0) was 60%. Acquisition software was developed to acquire 15 fps angiography and 30 fps fluoroscopy for real-time dark field and flat field correction or real-time roadmapping. Images obtained with the MAF in small animal IGI procedures are demonstrated. The linearity versus x-ray intensity and MCP working range effects has been studied. We plan to expand the current 3.6 cm diameter field of view to 6 cm in the next model of the MAF.
Keywords: x-ray detector, fluoroscopy, angiography, image-guided intervention, MTF, DQE, region-of-interest radiography, micro-angiography, MCP, linearity
1. INTRODUCTION
Neuro-vascular image guided interventional catheter-based procedures require the high spatial resolution (4-10 lp/mm) demanded in mammography but with higher x-ray energies (60-90 kVp) to penetrate the skull and brain. The state of the art x-ray image intensifier imaging system can provide only about 3 lp/mm resolution in the 4.5 inch mode. The high resolution is desired to visualize the fine structure of interventional devices, such as individual struts of stents, as well as small blood vessels called perforators that are 50-300 μm in diameter. These vessels are very important for neurological function and, if blocked, can induce devastating deficits in the patient. We have previously reported an x-ray CsI (Tl) scintillator-fiber optical taper-charge coupled device (CCD) micro-angiographic camera with a field of view of 5 cm × 5 cm and a frame rate of 5 fps1, 2. This detector has been reported to allow visualization of iodinated vessels with an inner diameter of 100 μm and localization of guide wires more accurately than a conventional x-ray image intensifier2, 3. This detector was designed to be used only in angiographic mode to assess an interventional procedure when high resolution images are needed to make critical clinical decisions while much of the procedure was still done using standard fluoroscopy with an x-ray image intensifier. This would require the micro-angiographic camera to be repeatedly inserted between the patient and the x-ray image intensifier. We designed the micro-angiographic fluoroscope (MAF) to expand the capabilities of the micro-angiographic camera to include fluoroscopic imaging over a small field of view. The MAF can thus be used for both fluoroscopic guidance and high-resolution angiography for assessment without the need to return to the standard imaging intensifier system as long as the limited field of view is sufficient. The MAF can also provide high-resolution fluoroscopy should this be needed during the intervention and a higher exposure is acceptable. The MAF is designed to enable both rapid sequence angiography (15 fps) at higher exposure levels (hundreds of μR) as well as fluoroscopy at high frame rates (30 fps) and fluoroscopic exposure levels (5 to 20 μR per frame).
Microchannel plate (MCP) detectors have previously been used for the detection and imaging of charged particles, ultraviolet radiation and soft x-rays4. Microchannel plates are generally manufactured from lead glass with main constituents of PbO and SiO2. The inside surfaces of the microchannels have high resistant semiconductor layers. When 1000-1800 V DC voltage is applied at the both surfaces of the plate, a uniform electric field is formed along the microchannel due to the semiconductor layer. For the direct conversion application, an incident x-ray photon is absorbed in the MCP and photoelectrons or Compton electrons are generated to traverse the channel wall5, 6. For the indirect conversion application, a fluorescent phosphor absorbs the incident x-rays and the emitted light ejects electrons from a photocathode as in a standard x-ray II. These electrons cause secondary electrons to be emitted from the surface layer of the microchannel which are then accelerated by the electric field along the channel walls and strike the other side of the channel surface. When one electron strikes the channel surface, it generates approximately three secondary electrons. The secondary electrons generate new electrons in the same way, and the results give rise to an electron avalanche. When one electron strikes the input of the single-stage MCP channel, a gain of approximately 104 electrons is obtained at the output of the channel in less than 200 ps. When two-stage or three-stage MCP is used, a higher gain (larger than 107 ) can be obtained. MCPs can provide direct conversion, high temporal resolution and spatial resolution ~ 15 lp/mm, but its direct conversion application to medical x-ray imaging have been discouraged by low detection efficiency for photons with energy higher than 20 keV7. Research in the 1970s on x-ray fluorescent screens for use in indirect conversion detectors had been hampered by the difficulty and cost to manufacture large area MCPs. Two prototype indirect flat x-ray image intensifiers (Flat II) with pitches of 0.3 mm and 0.2 mm and with a 6 inch diameter have been reported to achieve spatial resolutions of 1.67 – 2.5 lp/mm, recently. Each of these includes a cesium iodide scintillator, photocathode, electron multiplier, output phosphor screen, optical lens, and CCD camera8, 9. The design of the MAF is similar to the Flat II but with smaller area, and better resolution. The critical part of the MAF, the MCP based light image intensifier (LII), is a commercially available unit that includes an input light photocathode and output phosphor screen.
2. MATERIALS AND METHODS
2.1 The assembly of MAF
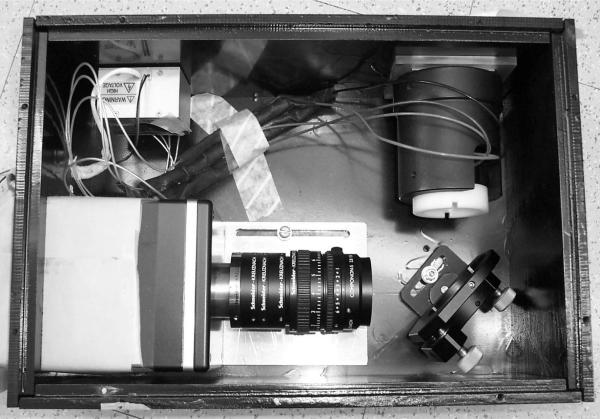
The prototype MAF consists of a CsI (Tl) scintillator coupled by a 2:1 fiber-optical taper to an 18 mm diameter variable-gain light image intensifier (LII) with two-stage MCP viewed by a 12-bit, 1024×1024, 30 fps CCD camera with digital interface board. The board is a Model Roadrunner RUN-PCI-24-M (Bitflow Inc., Woburn, MA 01801). The critical component is the MCP based LII which has very high gain and high resolution (its MTF is 0.18 at 20 lp/mm). The prototype MAF has been assembled with all commercially available components (Figure 1). The 5 cm × 5 cm CsI(Tl) x-ray scintillator with thickness of approximately 350 μm is a Model J6677HL (Hamamatsu Corp., Bridgewater, NJ 08807). The taper is a model 25733 Rd/Rd 50:25 mm (Schott Fiber Optics Inc., Southbridge, MA 01550). In order to minimize the cost for this demonstration, we chose a smaller 18 mm diameter light image intensifier, the Hamamatsu Model V4170U-04 with two-stage MCP which can be upgraded to a larger model (up to 40 mm), to achieve a larger field of view. Table 1 shows that the variable gain of the LII is adjusted by a control voltage in the range of 5-9V. This model LII has a multialkali photocathode and a P-43 output phosphor screen. The light spectrum of CsI(Tl) is in the range of 350 - 700 nm with a peak of 555 nm, which is completely within the spectral response range (350 - 900 nm) of the multialkali10, 11. The P-43 output spectral emission range is 470 - 630 nm. The mirror was a Model 645FK84-50 45° cold mirror, which has a reflectance larger than 90% in the spectral range of 450 - 650 nm which completely covers the P-43 spectral emission range. The interline CCD camera that we previously used, Model XC-77 (SONY Corp) 12, has been upgraded to a Model 1M30 (Dalsa corp., Colorado Springs, CO) frame transfer CCD camera with high performance 1024 × 1024 matrix, 12 μm pixel size, 30 frames per second, 12-bit digitization LVDS data format, frame transfer, 100% fill factor, and low dark current. This camera can be programmed via a RS232 port including gain (1x to 10x), binning, and triggering. The quantum efficiency is larger than 17% in the P-43 spectral emission range 470 – 630 nm with a peak value of 28% at 505 nm. The spectra of the whole system from input scintillator to CCD sensor are matched well. Optical coupling gel was used to couple the scintillator to the fiber optic taper and the taper to the LII for good optical transmittance efficiency.
Figure 1.
The assembled improved model of MAF with cover removed.
Table 1.
Test data of LII gain versus control voltage.
| Control Voltage (V) | MCP Voltage (kV) | Luminous Gain* ((lm/m2)/lx) | Radiant Emittance Gain (W/m2)/(W/m2) |
|---|---|---|---|
| 5 | 1.0 | 3.1E+01 | 1.0E+01 |
| 6 | 1.2 | 7.6E+02 | 2.56E+02 |
| 7 | 1.4 | 1.4E+04 | 4.71E+03 |
| 8 | 1.6 | 1.8E+05 | 6.06E+04 |
| 9 | 1.8 | 1.4E+06 | 4.71E+05 |
From Hamamatsu test sheet.
The optical video lens plus close-up lens that we previously used12 was upgraded to a high quality macro lens (Schneider Optics, Inc., Hauppauge, NY 11788) for larger primary magnification up to 1:1. The Schneider macro lens system includes lens, Unifoc helical mount, extension tubes, and camera adapter. The lens is a Model Componon-S 2.8/50, which has the smallest pincushion or barrel distortion among the available standard products. The Unifoc helical mount is a Model Makro-Unifoc 12 with 12 mm displacement to focus an enlarging lens. The distance from phosphor screen of the LII to CCD sensor depends on optical primary magnification or image pixel size. The length of the extension tubes were calculated according to the optical primary magnification13. The Unifoc helical mount is used to focus the optical system when the proper length of extension tubes is used.
2.2 Characterization of the MAF
The x-ray unit that we used in the experiment (Model CAS-8000, Toshiba Medical Corp., Japan) consists of a ceiling mounted c-arm with an x-ray tube and the II camera system. The source-to-image distance for the system can be adjusted from 85 to 117 cm. It has three nominal focal spot sizes for the x-ray tube: 0.3, 0.8, and 1.2 mm. It can perform angiographic imaging and fluoroscopic imaging with continuous or pulsed mode.
2.2.1 Angiographic Mode
2.2.1.1 Spatial resolution
The presampled modulation transfer function (MTF) for the MAF was measured using the Fujita's angulated slit method14. A 10 μm × 7 mm slit with beveled edges (Model 07-624, Nuclear Associates, Carle Place, NY) was used, which has been found to reduce its alignment sensitivity as compared to the parallel jaw slit15. A 72 kVp x-ray beam was used and the slit was place on the top of the detector with a slight angle about 1.7 degrees to the real vertical (detector matrix). Forty slit images were acquired and corrected for dark field and flat field and averaged. The slight variations in slit width were corrected using the average vertical pixel value. The finely sampled line spread function (LSF) was calculated and exponentially extrapolated from 2% to 0.1% (tail fitting). The MTF for the MAF was computed by taking the Fourier Transform of the LSF and then dividing by the slit sinc function (10 μm).
Qualitative spatial resolution measurement of the MAF was performed using a 0.05 mm thick lead bar-pattern (Model 07-521, Nuclear Associates – Carle Place, NY).
2.2.1.2 Detective quantum efficiency (DQE)
The detective quantum efficiency (DQE) was measured using a 72 kVp beam with 21 mm aluminum filtration and a 7.1 mm aluminum half value layer. Forty flat-field images were acquired at 300 μR/frame and corrected for dark field and flat field. The central region of each corrected flat field image was divided into overlapping 256 × 256 regions with 50% overlap. Each flat field image provided 25 such regions resulting in 1000 regions over 40 frames. The mean pixel value in each region was subtracted from each pixel and the result was Fourier transformed. The noise power spectra (NPS) were then averaged over all 1000 regions and normalized using the square of the average pixel value16. The normalized NPS versus spatial frequency was calculated by radial averaging of the upper part of the two dimensional NPS. The noise equivalent quanta (NEQ) were determined by dividing the squared MTF by the normalized NPS data. The air kerma of the incident x-ray beam was calculated by the formula: 0.00873 × exposure (Gy/R)17. The SNR2 of the incident x-ray beam was determined by multiplying the air kerma by the value 30174 photons/(mm2 • μGy) provided by IEC18. The DQE was computed by dividing the NEQ by the SNR2 of the incident x-ray beam. The exposure to the detector surface during the experiments was measured using an ionization chamber dosimeter (Model 35050A with 15cc model 96035B ionization chamber, Keithley Instrument Inc., Cleveland, OH).
2.2.1.3 Linearity of response versus x-ray exposure
We previously presented the linearity of pixel value versus exposure with a 6.2V LII control voltage in the high dose angiographic mode19. Exposure was varied by varying the exposure rate and exposure times up to 49 ms when higher exposure was needed. For the results in this paper, we used the same LII control voltage of 6.2V and varied the exposure rate for two different exposure times: 6 ms and 30 ms. Ten frame image sequences were acquired at a rate of 3 frames per second. The average pixel value of the central region of each frame was computed. The average and standard deviation of the ten average pixel values were calculated.
2.2.2 Fluoroscopic Mode
When the MAF was used in low exposure fluoroscopic mode, the CCD camera was operated at 2:1 binning (512 × 512 matrix). Since the pixel size was doubled, the quantum noise was reduced in this binned mode. The luminous gain of the LII was raised to 2.3 × 10⁴ (lm/m2)/lx by adjusting the control voltage to 7.2V. The luminous gain value could be calculated at any voltage using the power function fitted curve fitted to the data in Table 1.
2.2.2.1 Fluoroscopic image lag
We used a similar procedure as previously reported20, 21 to measure the temporal response of the MAF, i.e., its lag or image retention from frame to frame. The MAF, which was operated at 30 frames per second continuously, was exposed to a 30 fps pulsed fluoroscopic sequence. The x-ray source was suddenly turned off and the MAF continued to acquire 500 images. The 500th frame can be considered the final equilibrium image. The average signal of the central 200 × 200 region of interest of each frame was calculated to represent the mean signal amplitude of that frame. The nth frame lag was calculated as:
Sn represents the signal in the nth frame after the x-ray source was turned off. Sf represents the signal in the final equilibrium frame after the x-ray source was turned off. S0 represents the signal in the frame prior to the termination of the x-ray exposure.
2.2.2.2 MTF and DQE
We used the same method described in angiographic mode to measure the MTF in the fluoroscopic mode. We used 21 mm aluminum filtration with a 50 kVp x-ray beam to measure MTF and DQE. 100 frames of flat field at 20.6 μR/frame were acquired and corrected for dark field and flat field. The central 256 × 256 ROI was used to calculate the NPS. The squared signal-to-noise per air kerma was calculated to be 23700/(mm2·μGy) using spectrum generating software22. The calculation of DQE for fluoroscopic mode is the same as described for angiographic mode.
2.3 Animal study and acquisition with real-time correction
An aneurysm was created in a rabbit and the MAF was used in angiographic and fluoroscopic modes to perform image-guided interventional (IGI) procedures to deploy a stent at the site of the aneurysm.
In our previous microangiographic system, we used Bitflow software to acquire images and then ImageTools (The University of Texas Health Science Center, San Antonio, Texas) software to display an image sequence. For the previous system an off-line image processing program for dark field and flat field correction, and for digital subtraction angiography, has been developed using a C language plug into ImageTools script language. A new Bitflow imaging solution product (Imagewarp) offers compatibility with the Bitflow acquisition board, hundreds of imaging processing functions, and a built-in scripting language. We used this new software to do all the functions what we need: image acquisition, image processing, and display of static and live images. The IWD format file provided by this software is used to save single frame or multi-frame sequences with lossless compression. An important image processing function for our application is the built-in function of dark and flat field correction. The correction algorithm is based on the following formula:
where Ix,y is a pixel value of the original image, Dx,y is a pixel value of the dark field image, Fx,y is a pixel value of the flat field image, Fmax is a maximum value of the flat field image, and Cx,y is a pixel value of the corrected image at location x, y.
3. RESULTS AND DISCUSSION
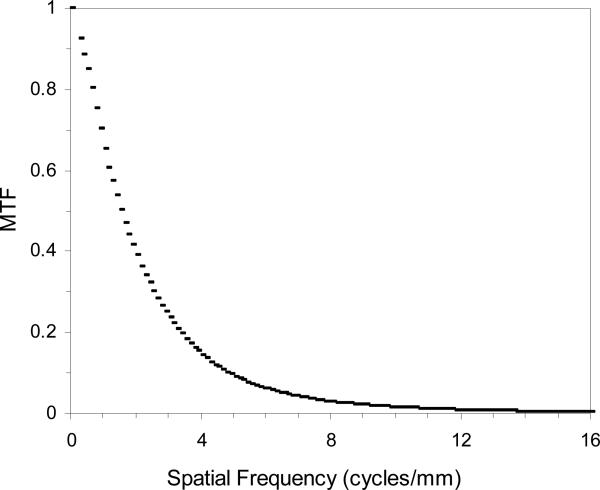
Figure 2 shows the measured MTF for the MAF in angiographic mode using the method described in the previous section. The measured pixel size was 31 μm when we used a lens magnification of 0.77. The Nyquist frequency is 16 cycles/mm. At spatial frequencies of 4 and 10 cycles/mm the MTF for the MAF was 14% and 1.5%, respectively, which is somewhat worse than the value 17% and 2.0% measured for the previous microangiographic camera. The MTF for the MAF is a product of the MTF's of its components which include the CsI scintillator, fiber-optic taper, LII, Lens, and CCD camera. The MTF for the previous microangiographic camera is a product of the MTF's of the CsI scintillator, the fiber-optic taper, and the CCD camera. There are two additional components in the MAF than the previous microangiographic camera. Although the LII and the macro lens have high resolution quality, they still contributed to some degradation in the resolution of the whole system. The MTF for the LII is 0.18 at 20 lp/mm, but the effective MTF for the LII at the objective plane is degraded to 0.18 at 10 lp/mm because of the use of the 2:1 fiber-optic taper to couple the scintillator and the LII. We plan to reduce the fiber-optic taper ratio to 1.5:1 in the next model. This should improve the MTF of the whole system.
Figure 2.
Measured presampled MTF for the MAF using a 10 μm wide slit.
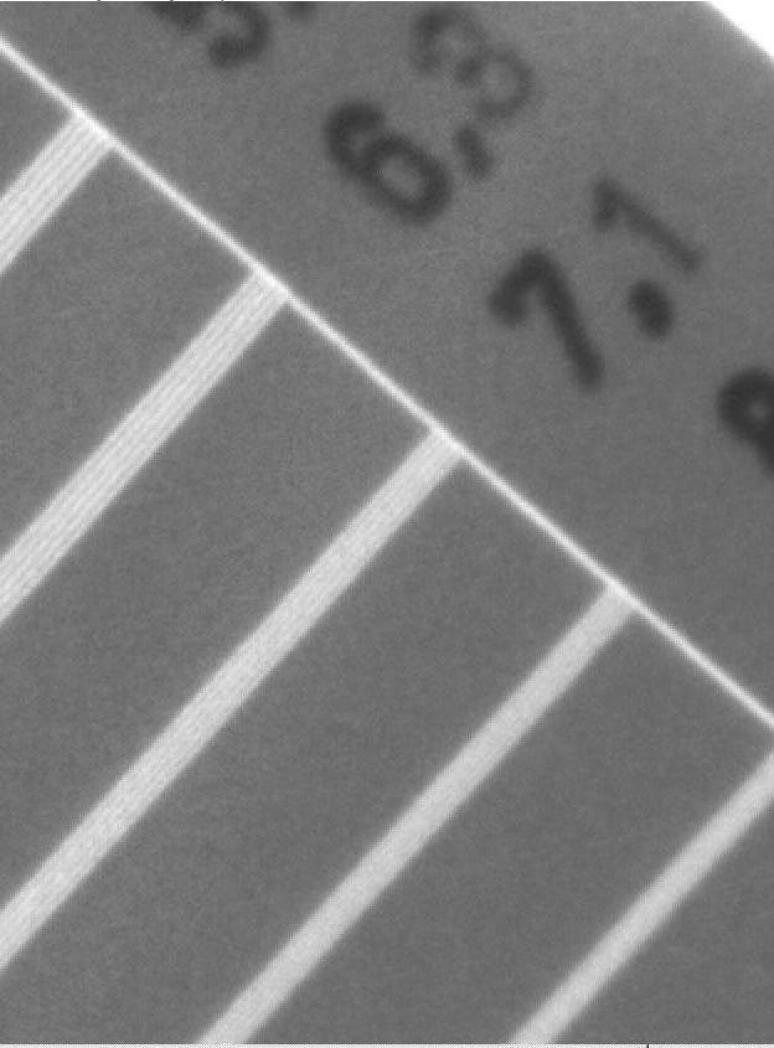
Figure 3 shows the image of the 0.05 mm thick lead bar-pattern. The bars at 6.3 and 7.1 lp/mm are clearly resolved and the bars at 8 lp/mm are partially resolved.
Figure 3.
A qualitative measure of image quality: 0.05 mm thick lead bar-pattern.
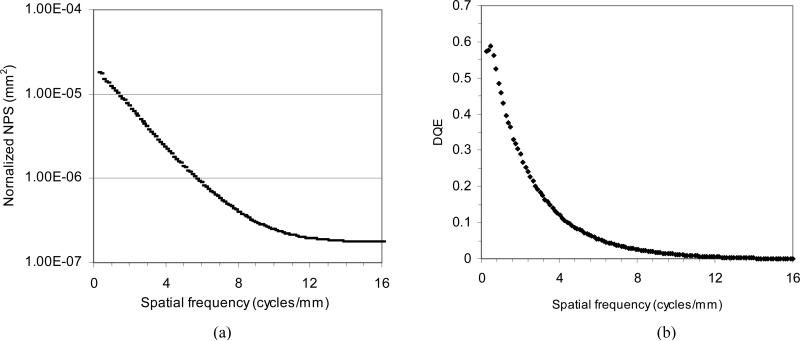
Figure 4 (a) shows the measured 1-D normalized NPS following radial averaging of the two-dimensional NPS for the MAF at an exposure of 300 μR. The curve is very smooth because we used 1000 regions of 256 × 256 flat regions. Figure 4 (b) shows the measured DQE for the MAF based on the measured NPS. At spatial frequencies of 4 and 10 cycles/mm the DQE was 12% and 1.2%, respectively, while the DQE (0) was 60%.
Figure 4.
(a) Measured normalized NPS with a radial average and (b) DQE for the MAF.
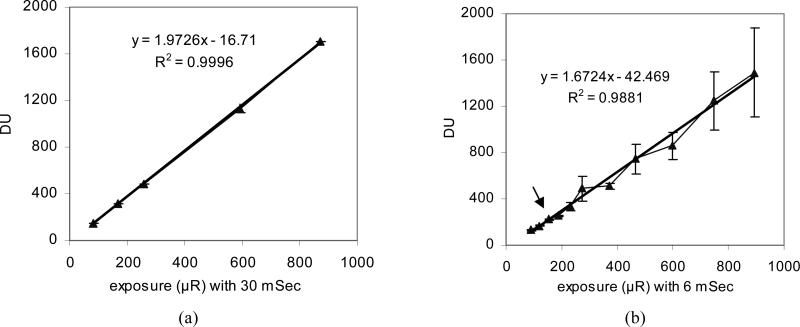
Figure 5 show the linearity or response curves of the MAF; the mean pixel value for a single frame for the MAF at the same LII gain voltage of 6.2V is plotted versus detector entrance exposure. The error bars at each exposure represents the standard deviation of average pixel value of ten frames. We acquired the flat x-ray images over the same exposure range but different exposure rates in Figure 5 (a) and 5 (b). Figure 5 (a) demonstrates a linear behavior of the MAF with 30 ms exposure times where the maximum exposure rate is 29 μR/ms. Figure 5(b) shows a somewhat linear behavior with large error bars when the exposure rate is higher than 30 μR/ms (arrow point). The entrance exposure rate at this point (30 μR/ms) exceeds the LII nominal working range (MCP instability). Since the exposure is the value of exposure rate multiplied by exposure time, the value of exposure time or detector entrance exposure rate should be considered when selecting the desired detector entrance exposure. For example, if an exposure of 800 μR is needed, the exposure rate of 26.7 μR/ms is fine when we set a 30 ms exposure time, but an exposure rate of 133 μR/ms required for an exposure time of 6 ms exceeds the stable range (the LII nominal working range). Since the maximum luminance output of the LII is independent of LII gain9, a higher maximum LII input (photocathode illuminance) can be used if a lower LII gain is set and thus a higher maximum x-ray exposure rate can be used without introducing instability of the MCP. If the lens collection efficiency or CCD camera gain were to be increased, the LII gain could be lowered and a wider dynamic exposure rate range could be realized before instability.
Figure 5.
(a) The response in digital units (DU) as a function of exposure with 30 ms exposure time and (b) the response in DU as a function of exposure with 6 ms exposure time.
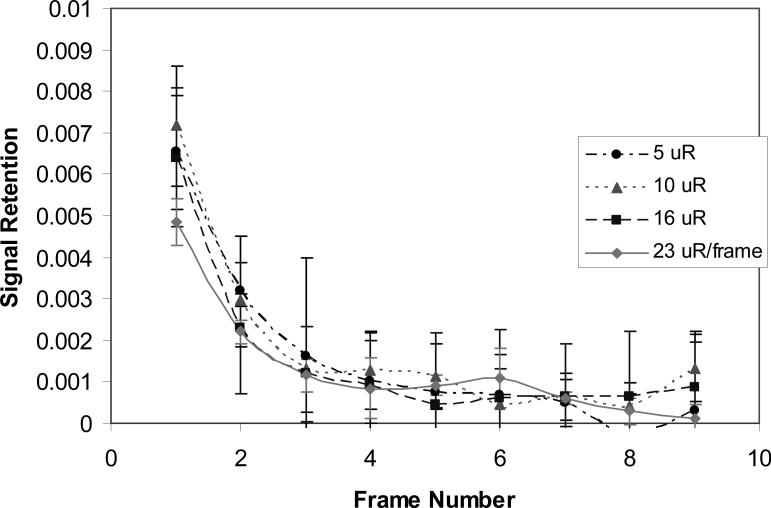
The measured image lag in fluoroscopic mode operated at a rate of 30 fps at exposure 5, 10, 16, and 23 μR/frame are shown in Figure 6. The error bars show the ± one standard deviation calculated from the three repeated measurements at each detector entrance exposure. The first frame lag was less than 0.8% and independent of exposure; this demonstrates excellent imaging temporal resolution. The effect of lag on the DQE measurements was negligible.
Figure 6.
Measured lag for the MAF at 30 fps fluoroscopy.
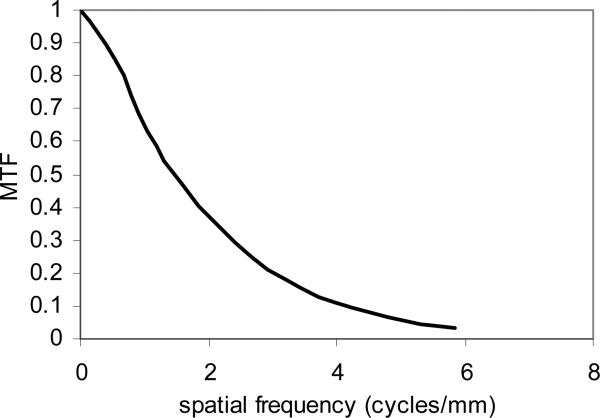
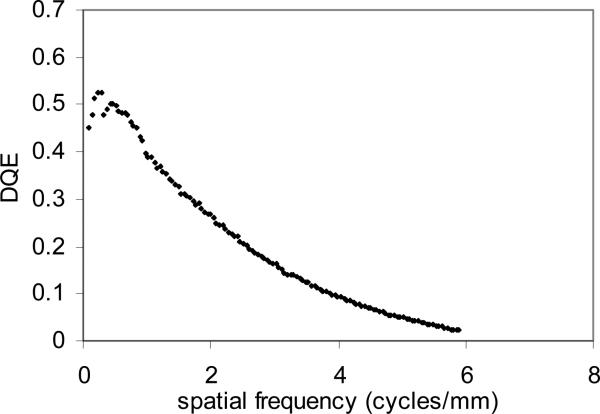
Figure 7 shows the MTF for the MAF in the fluoroscopic mode with a pixel size of 82 μm and 2:1 binning. The MTF is 11% at a spatial frequency of 4 cycles/mm, which is a little worse than the 14% value at the same spatial frequency for angiographic mode. Figure 8 shows the DQE for the MAF in fluoroscopic mode. The DQE at zero spatial frequency is somewhat lower than the 60% value for angiographic mode when extrapolation is taken in low spatial frequency. The DQE is 9.5% at a spatial frequency of 4 cycles/mm, which is somewhat worse than 12% at the same spatial frequency for angiographic mode. Increased noise or low exposure for fluoroscopic mode and lower MTF may cause lower DQE for fluoroscopic mode than angiographic mode.
Figure 7.
Measured MTF for the MAF in fluoroscopic mode with 2:1 binning.
Figure 8.
Measured DQE for the MAF in fluoroscopic mode with 2:1 binning.
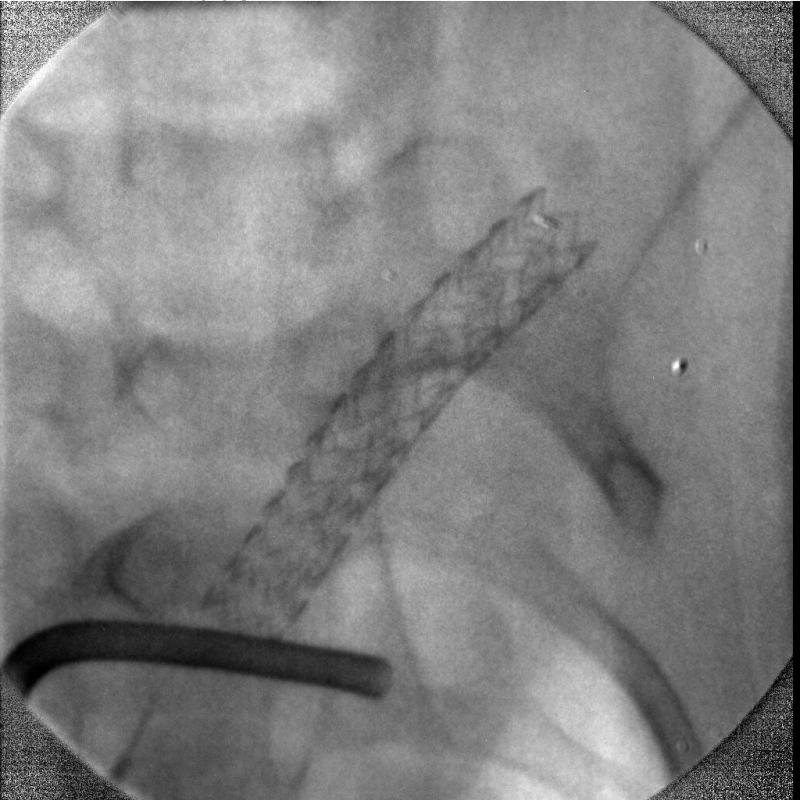
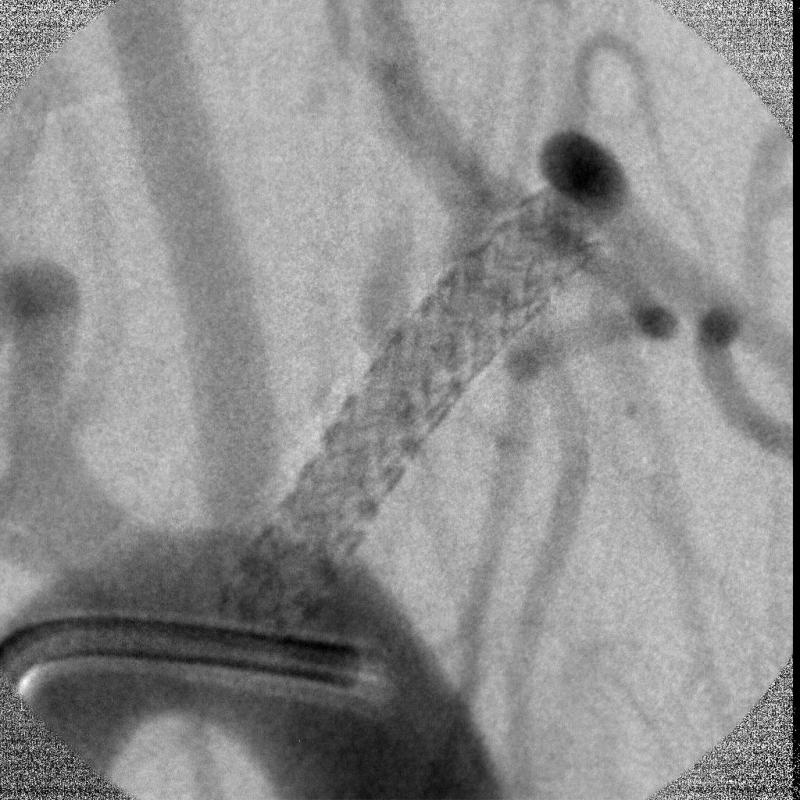
The MAF was used in the small animal rabbit IGI procedures for both fluoroscopy and angiography for the first time. The rabbit had an aneurysm created surgically. The MAF was mounted on a stand to be compatible with the existing commercial angiographic x-ray imaging system. The commercial x-ray image intensifier was used at the beginning of the IGI procedure to localize the site where the interventions are occurring because of its large field of view from 4.5 inches to 12 inches. Once the site was determined for the procedure, the MAF was interposed between the x-ray image intensifier and the animal to be used for high resolution fluoroscopic and angiographic imaging guidance. A stent was deployed over the aneurysm orifice under the fluoroscopic imaging guidance of the MAF. The MAF was switched from fluoroscopic mode to angiographic mode and vice versa in seconds. Figure 9 shows one angiographic frame after the deployment without the iodine contrast injection. The diameter of the field is 36 mm for the prototype MAF. The rabbit bone structure and the deployed stent architecture can be visualized. Figure 10 shows one frame of the digital subtracted angiogram of the rabbit. The small blood vessels and the man-made aneurysm covered by the stent can be visualized following contrast injection. The DSA mask which contained the catheter and stent is an average of three images. Because the catheter and the stent which were inside the blood vessel moved between images due to the heart beat of the rabbit, they were not subtracted and are still shown in the DSA image.
Figure 9.
The image of a small region of a rabbit where IGI is occurring using the MAF. Bone structure and intervention device can be visualized.
Figure 10.
Digital subtracted angiography image of the rabbit. Small blood vessels with iodine contrast can be visualized.
In fluoroscopic mode, real-time dark field and flat field correction is required because of the hexagonal “chicken wire” pattern produced from the fiber-optic and other flat-field non-uniformity. When the image matrix is decreased to 512 × 512 with a binning of 2:1, the processing speed is improved by fourfold. Real-time dark field and flat field correction at 30 fps was realized using software developed with Imagewarp and a PC based on a Pentium IV (Model Precision workstation 360, 2048 MB total physical memory, Dell Computer Corp.). The dark and flat images were acquired with an average of 40 to 60 frames using an Imagewarp acquisition function before the MAF was applied. The function of the dark and flat field correction was used to correct every single frame in real time, which was acquired at 30 fps in fluoroscopic mode. This function was also used to do real-time roadmapping at 30 fps after the iodine contrast was injected and the mask was selected. The fluoroscopic sequence, including the roadmapping sequence, can be saved off-line and the size of the sequence that can be saved depends on the capacity of the computer RAM. 15 fps angiography was achieved using the software developed with Imagewarp. The dark field and flat field correction and digital subtraction angiography was done after the acquisition was completed so that the replay display loop had the corrections included.
4. CONCLUSION
The custom built, improved model of the MAF demonstrates high-resolution imaging over a small region of interest for both fluoroscopy and angiography. The performance of the MAF has been measured in both angiographic mode and fluoroscopic mode. Real-time dark field and flat field correction and roadmapping at a rate of 30 fps in fluoroscopic mode were realized. The current 3.6 cm field of view will be expanded to 6 cm in the next version of the micro-angiographic fluoroscope to accommodate human trials. In the next version, the fiber-optic taper ratio is to be reduced from 2:1 to 1.5:1, and the LII diameter is to be increased from 18 mm to 40 mm. This should result in improved performance (both MTF and DQE) of the MAF.
ACKNOWLEGEMENT
This work is supported in part by NIH Grant No. R01EB002873, R01NS38746, an equipment grant from the Toshiba Medical Corp. We also thank the Guidance Corp. for supplying stents used in the work.
REFERENCES
- 1.Rudin S, Bednarek DR, Yang C-YJ, Chattopadhyay A, Gopal A, Wu Y, Wang Z, Nazareth DP, Hoffmann KR. Proceedings from Medical Imaging 2000: Physics of Medical Imaging. Vol. 3977. San Diego, CA: 2000. Region of interest (ROI) micro-angiography: imager development; pp. 534–541. Paper #59. [Google Scholar]
- 2.Ganguly A, Rudin S, Bednarek DR, Kyprianou IS, Hoffmann KR. Micro-angiography for neurovascular imaging. I. Experimental evaluation and feasibility. Medical Physics. 2003;30:3018–3028. doi: 10.1118/1.1617549. [DOI] [PubMed] [Google Scholar]
- 3.Wang Z, Rudin S, Wu Y, Hoffmann KR, Bednarek DR. Accuracy Comparison of Micro-angiographic Detector and Image Intensifier for an Interventional Localization Task. Proceedings of 2002 IEEE International Symposium on Biomedical Imaging; Washington D.C.. July 2002.pp. 553–556. [Google Scholar]
- 4.Wisa JL. Microchannel plate detectors. Nuclear Instruments and Methods. 1979;162:587–601. [Google Scholar]
- 5.Bateman JE. The detection of hard x-ray (10-140 keV) by channel plate electron multipliers. Nuclear Instruments and Methods. 1977;144:537–545. [Google Scholar]
- 6.Shikhaliev PM, Xu T, Le H, Molloi S. Scanning-slit photon counting x-ray imaging system using a microchannel plate detector. Medical Physics. 2004;31(5):1061–1071. doi: 10.1118/1.1695651. [DOI] [PubMed] [Google Scholar]
- 7.Gould RG, Judy PF, Klopping JC, Bjarngard BE. Quantum detection efficiency of a microchannel plate image intensifier. Nuclear Instruments and Methods. 1977;144:493–500. [Google Scholar]
- 8.Onihashi H, Aida H, Nou K, Noji T, Murakoshi Y, Saito K, Koma J. Proceedings from Medical Imaging 2000: Physics of Medical Imaging. Vol. 3977. San Diego: 2000. Flat x-ray image intensifier system for real-time fluoroscopy; pp. 145–150. [Google Scholar]
- 9.Onihashi H, Aida H, Nou K, Noji T, Murakoshi Y, Ito K, Saito K, Koma J. Proceedings from Medical Imaging 2001: Physics of Medical Imaging. Vol. 4320. San Diego: 2001. Flat x-ray image intensifier system for real-time fluoroscopy; pp. 509–515. [Google Scholar]
- 10.Hamamatsu Photonics K. K., Electron Tube Center, Japan “Fiber optics plate with scintillator (FOS)” catalogue. 1997.
- 11.Hamamatsu Photonics K. K., Electron Tube Center, Japan “Image intensifier” brochure. 2002.
- 12.Wu Y, Rudin S, Wang Z, Kyprianou I, Bednarek DR. Experimental study of a prototype x-ray micro-angiographic fluoroscope. Medical Physics. 2003 Jun;30(6):1423. [Google Scholar]
- 13.Schneider Optics, Haupauge, NY Macro system” brochure. 2002.
- 14.Fujita H, Tsai D-Y, Itoh T, Doi K, Morishita J, Ueda K, Ohtsuka A. A simple method for determining the modulation transfer function in digital radiography. IEEE Transactions on Medical Imaging. 1992;11:34–49. doi: 10.1109/42.126908. [DOI] [PubMed] [Google Scholar]
- 15.Bradford CD, Peppler WW, Waidelich JM. Use of a slit camera for MTF measurements. Medical Physics. 1999;26:2286–2294. doi: 10.1118/1.598742. [DOI] [PubMed] [Google Scholar]
- 16.Dobbins JT, Ergun DL, Rutz L, Hinshaw DA, Blume H, Clark DC. DQE(f) of four generations of computed radiography acquisition devices. Medical Physics. 1995 Oct;22:1581–1593. doi: 10.1118/1.597627. [DOI] [PubMed] [Google Scholar]
- 17.Johns HE, Cunningham JR. The physics of radiology. fourth edition Charles C. Thomas Publisher; 1983. p. 246. [Google Scholar]
- 18.IEC 62220-1 Medical electrical equipment – characteristics of digital x-ray imaging devices – determination of the detective quantum efficiency. May 23, 2003.
- 19.Wu Y, Rudin S, Wang Z, Kyprianou I, Bednarek DR. Characterization of a Prototype Micro-Angiographic Fluoroscope and Its Application in Neuro-Interventional Phantom Studies.. Presented at AAPM Annual Meeting; Pittsburgh. July 2004; Abstract (No. TU-C-317-02) is published at Medical Physics 31(6), pp. 1774, June 2004. [Google Scholar]
- 20.Granfors PR, Albagli D, Tkaczyk JE, Aufrichtig R, Netel H, Brunst G, Boudry J, Luo D. Proceedings from Medical Imaging 2001: Physics of Medical Imaging. Vol. 4320. San Diego, CA: 2001. Performance of a flat panel cardiac detector; pp. 77–86. [Google Scholar]
- 21.Vedanthan S, Karellas A, Suryanarayanan S. Solid-state fluoroscopic imager for high-resolution angiography: Physical characteristic of an 8 cm × 8 cm experimental prototype. Medical physics. 2004;31(6):1462–1472. doi: 10.1118/1.1750992. [DOI] [PMC free article] [PubMed] [Google Scholar]
- 22.Cranley K, Gilmore BJ, Fogarty GWA, Desponds L. Catalogue of diagnostic x-ray spectra and other data. Institute of Physics and Engineering in Medicine; Sep, 1997. Report No. 78. [Google Scholar]


