Abstract
A new microangiographic system (MA) integrated into a c-arm gantry has been developed allowing precise placement of a MA at the exact same angle as the standard x-ray image intensifier (II) with unchanged source and object position. The MA can also be arbitrarily moved about the object and easily moved into the field of view (FOV) in front of the lower resolution II when higher resolution angiographic sequences are needed. The benefits of this new system are illustrated in a neurovascular study, where a rabbit is injected with contrast media for varying oblique angles. Digital subtraction angiographic (DSA) images were obtained and compared using both the MA and II detectors for the same projection view. Vessels imaged with the MA appear sharper with smaller vessels visualized. Visualization of ~100 μm vessels was possible with the MA whereas not with the II. Further, the MA could better resolve vessel overlap. Contrast to noise ratios (CNR) were calculated for vessels of varying sizes for the MA versus the II and were found to be similar for large vessels, approximately double for medium vessels, and infinitely better for the smallest vessels. In addition, a 3D reconstruction of selected vessel segments was performed, using multiple (three) projections at oblique angles, for each detector. This new MA/II integrated system should lead to improved diagnosis and image guidance of neurovascular interventions by enabling initial guidance with the low resolution large FOV II combined with use of the high resolution MA during critical parts of diagnostic and interventional procedures.
Keywords: x-ray detectors, x-ray tomosynthesis, detector technology, digital angiography, microangiography, image intensifier, multiview, image guided interventions, image reconstructions
1. INTRODUCTION
Accurate diagnosis and early detection of neurovascular disease requires high resolution detectors capable of detecting plaque build up, blood clots, narrowing of vessel lumen, and aneurysm morphology. Improved neurovascular image guided interventions (IGI) also will require a high resolution detector to visualize small vessel patency and structural details of interventional devices. Standard II detectors and flat panels are not optimal for the high resolution requirements of more advanced, patient-specific treatment options, such as the accurate placement of asymmetric stents [8]. The MA detector that has been developed by our group offers the high resolution desired in a targeted region of interest [1,2] and is superior to the standard II [3].
Previous use of the MA detector has been done by mounting the detector on a separate mobile cart and manually adjusting position and angle. This did not allow for fast and accurate use of the MA in conjunction with the II and thus did not enable a total-system comparison between the two at arbitrary oblique angles. With the new integrated MA-II system, with both detectors on the same c-arm gantry, there is now the ability to use both the MA and II at nearly identical conditions with respect to the patient, i.e., for the same view with exactly the same source to object distance (SOD) and object position. Identical projections (with slightly different magnifications) can be taken at varying angles with both the MA and II allowing for multiplanar reconstructed 3-D image comparisons as well.
With this new MA-II system, the larger FOV II can be operated when the demands of the task are not as high, and a larger imaging area is desired. However, when a higher-resolution image with greater signal to noise ratio is desired at a targeted region of interest (ROI), the MA can be deployed to take on these greater demands.
2. METHODS
2.1 New microangiography system
The MA detector is composed of a 250μm thick CsI(Tl) phosphor grown on a 3mm thick fiber optic plate (FOP) which is designed to attenuate unabsorbed primary x-rays. The FOP is optically coupled to a 1.8:1 fiber optic taper (FOT) which is coupled to a Dalsa 4M4 CCD camera operated in 2 x 2 pixel binning mode at 5 fps with 45 μm effective image pixel size and 4.5 x 4.5 cm FOV. Extensive studies of the MA detector have been reported previously [1,2,3].
The new MA-II system (Fig. 1) consists of the high-resolution MA detector mounted on an aluminum base adapter that attaches to a “spot film” transport device, enabling movement of the detector into position in front of the II (high-resolution mode) or into a parked position out of the FOV (low-resolution mode). The clinical diagnostic x-ray gantry which provides the full 6 degrees of freedom (about the object) for both detectors is a model CAS-8000 V (Toshiba Medical Systems Corp., Tustin CA). A similar system has also been developed on an Infinix 3000 C-arm angiographic unit (Toshiba Medical Systems Corp.)
Figure 1.
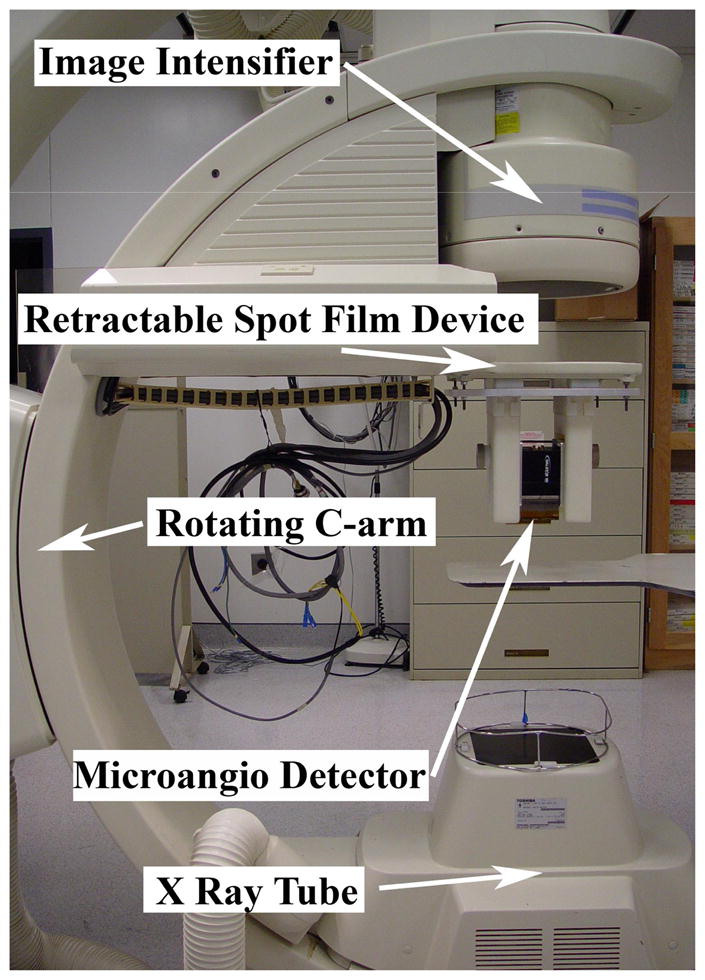
New MA-II system (in high-resolution mode)
This MA-II system enables the operator to switch easily between the low-resolution, large FOV II and the high-resolution, ROI MA detector depending on the imaging requirements of the procedure. The II could be used to locate the ROI and to do an initial analysis, while the MA could be deployed for a more detailed analysis of the site as well as for more delicate procedures.
This system also allows for precise alignment of the MA with the x-ray source and II, allowing for an accurate comparison of the two detectors’ performance in real-time animal studies. Further, with the flexibility of being able to accurately place the MA detector with six degrees of freedom, high-resolution 3D reconstructions can now be obtained using two or more projections at varying angles [4].
2.2 System evaluation
For the total MA-II system, several studies were done to give both a quantitative and qualitative measure of the differences provided by the two imaging modalities in clinical-like conditions using phantom and animal models.
The imaging of smaller vessels and vessel overlap provide both qualitative and quantitative information on the vasculature. This gives an indication of practical resolution capabilities in a clinical environment. The contrast-to-noise ratio (CNR) provides a measure of how well the detectors are able to image identical vascular locations. Finally, the capability of having 3-D renderings of the vessels, using multi-planar reconstruction techniques with both the high-resolution MA and the low-resolution II, enables the 3-D reconstruction of the vessels to be compared for identical projections (with slightly different magnifications).
2.2.1 Small vessel imaging and vessel overlap
Images of the neurovasculature of New Zealand white rabbits were obtained for several different angles and injections under procedures approved by the Institutional Animal Care and Use Committees (IACUC). Both MA and II images were taken during injections of Reno-60 (Bracco Diagnostics Inc., Princeton, NJ) into the rabbit’s right vertebral artery at precisely the same angle, SOD, and object (rabbit) orientation. Reno-60 is an iodine contrast agent composed of 28% organically-bound iodine. Corresponding MA and II images were chosen such that the vessel filling of contrast was optimally matched by observing the flow of contrast in the sequence of images and visually selecting the two that appeared most similar. The smallest vessels were examined in both MA and II images. Line profiles were then taken perpendicularly across these vessels. The background pixels were averaged on either side of the vessel, and the vessel profile (pixels below background) was fitted with a 2nd order polynomial (assuming an elliptical vessel model [5]) and subsequently symmeterized by averaging either side of the minimum. The full width at half maximum (FWHM) of this fitted parabola was then measured. Using both the FWHM and the imaging geometry (magnification), the size of the smallest visible vessels could be approximated for each of the detectors. To eliminate the possibility that the comparison was done for cases of non-identical vessel filling, this analysis was done for all image pairs obtained for 5 different angles. An attempt was then made to measure the smallest visible vessels in these images.
These images were also examined for clearly overlapping vessels. This was judged by noticing any vessel intersections. At these locations of possible overlap, the images were magnified on the computer display, and a judgment was made as to whether the vessel could be easily seen or if it was indecipherable from the larger vessel (or was a branch of a larger vessel). These judgments were further supported with an examination of the line profiles taken across the length of the vessels (in the region of overlap). All locations of overlap were classified and tabulated.
2.2.2 Contrast to noise ratios
The CNR provides a more quantitative measure of image visualization, hence total system performance, with a higher CNR being desired for improved image utility and diagnostic reliability.
The CNR was calculated using:
| (1) |
| (2) |
dividing the two, results in:
| (3) |
where Sbackground is the background signal determined by taking the average pixel value of the background region next to the vessel, Svessel is the vessel (contrast filled) signal determined by averaging the pixel values of a small interior portion along the central axis of the vessel, and σ is the standard deviation of the background. This measurement was done on phantom and animal models.
2.2.2.1 Simulated vessels
To calculate the CNR of ‘vessels’ and to determine the effect of vessel size, simulated vessels were constructed with known size and location. The simulated vessels consisted of polyethylene tubing of varying inner diameters ranging from 50–1000μm, filled with the same contrast agent used in the rabbit studies. No background or scatter material was placed in the x-ray path, and the grid was removed from the II to avoid any consequent reduction of primary x-ray’s by the grid. This experiment was designed to determine the inherent differences in the CNR values between the two imaging detectors given nearly identical conditions.
2.2.2.2 Rabbit neurovasculature
As a natural extension to the simulated vessel CNR measurements, the same procedure was done with the rabbit neurovascular images mentioned previously to investigate how the detectors perform in a clinical (animal study) environment, under their normal operating conditions, for identical exposure factors. Hence, the grid was used with the II (10/1 grid ratio, 44 lines/cm). The vessel sizes were manually measured with an image processing program (Photoshop CS2, Adobe Systems Incorporated). The accuracy of this measurement is inherently affected by pixel size and signal-to-noise ratio [6,7]. Due to the added uncertainty associated with this measurement, three measurements were done for each vessel for each detector and averaged in an attempt to reduce the undesired effects of unknown vessel size. Additionally, the vessel CNR values were averaged for vessels of similar size to further smooth the noise. Both images were corrected for gain (by correcting for the flat-field image), while the MA was additionally corrected for offset (by subtracting the dark image), as is the standard method respectively for both imaging systems. No further processing was done to ensure that the CNR measured is that of the usual output of the detectors.
2.2.3 Multi-view 3D reconstructions
Having the capability to position the MA detector precisely at a desired angle allows for an additional functionality of the new MA-II system. Depending on the circumstance, either imaging modality can be used for multi-planar 3-D image reconstructions. Obtaining accurate 3-D representations with a minimal number of planar images is desired in terms of reduced patient dose and improved decision making as a result of a more accurate visualization of vasculature.
A comparison for the two detectors of the 3-D volumes obtained from using three projections of the rabbit neurovasculature at varying angles was done by projecting the 3-D volume onto the original projection images and qualitatively comparing the results with the three projection views used in addition to a fourth projection image which was not used in calibrating the 3-D centerline data. The 3-D volume was superimposed onto the projection views corresponding to the reference angle from which that projection view was obtained. The 3-D segment is then aligned to the vessel of origin, and the overall accuracy is compared between the two different detectors.
3. RESULTS AND DISCUSSION
Images from three separate rabbit studies were obtained at varying angles (spanning a maximum of 120°) using both detectors of the MA-II system at each angle. For these initial comparisons, the same exposure technique parameters were used for both detectors: 70 kVp, 125 mA, and 12 ms (for one rabbit study), as well as, 74 kVp, 80 mA, and 35 ms (for the other two rabbit studies). The 0.3 mm focal spot was used. Geometric magnification was minimized by keeping the rabbit as close to the detectors as possible to maximize the FOV. A magnification of 1.25 was used for the rabbit acquisitions. For comparisons, the image intensifier was operated in 4.5 in mode with 120 μm effective pixel size.
3.1 Vessel imaging
3.1.1 Small vessels
Sequential images taken during the injection of contrast were examined in succession to ensure that the vessel selected was completely filled with contrast media. The sequences were also used to decipher vessels (by noticing filling along the length of the vessel) from background structures visible as a result of possible slight anatomical motions of the rabbit during the injection, hence causing slight misregistration between the mask and injection image for the DSA sequence.
Due to the small size of the vessels in question (on the order of 2 pixels wide for either detector), the line profiles were integrated over several pixels (along the length of the vessel) to obtain a less noisy profile and a more accurate measure of the vessel width. To obtain more consistent results, the vessel line profiles were symmetrized and fitted with a parabolic curve before the FWHM was calculated.
With the MA detector deployed, vessels as small as 95μm were visible. Using the low-resolution II mode, vessels on the order of 235μm were distinguishable from background. These results are what one might expect given the effective pixel size of the detectors being 35μm and 91μm respectively. The detectors can resolve a vessel of roughly 2.5x the pixel size.
Figure 2 shows typical DSA’s of the rabbit neurovasculature acquired with the MA-II system. Most of the small vessels appear very sharp in the MA images, whereas in the images acquired with the II the smallest detectable vessels are blurred more, due to the larger pixel size. This has the effect to increase the apparent width versus the actual physical width. Not only does the MA image smaller vessels, it presents these vessels with much improved sharpness (Fig. 2).
Figure 2.
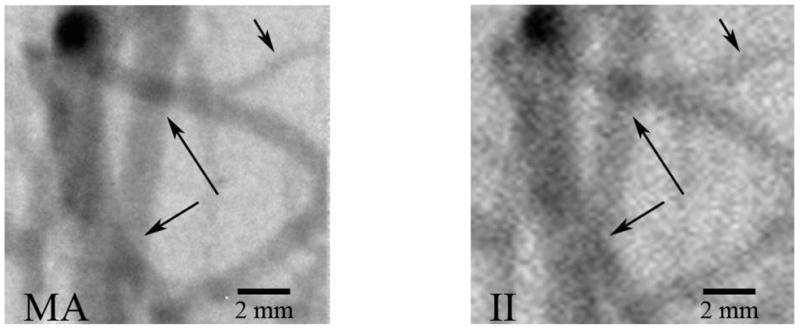
Typical DSA image of rabbit neurovasculature illustrating increased small vessel visualization (upper right arrow) and vessel overlap detectability (central two arrows) with the high-resolution MA.
3.1.2 Vessel overlap
In a total of 7 images acquired at different angles and in different rabbits, the areas of vessel overlap were counted, and the identical region was examined in the corresponding image of the other detector. There were 16 cases of clear overlap for the MA versus only 4 cases for the II. Figure 2 illustrates two such cases of detectable overlap for the MA and the corresponding II image providing one clear case (upper arrow) and one indecipherable case (lower arrow) of overlap. Figure 3 illustrates an area where three vessels overlap a larger vessel in close proximity and the corresponding line profiles taken across the larger vessel centerlines. Three clear troughs can be observed with the MA (arrows), whereas the II appears less sharp, and the vessel overlap cannot be detected.
Figure 3.
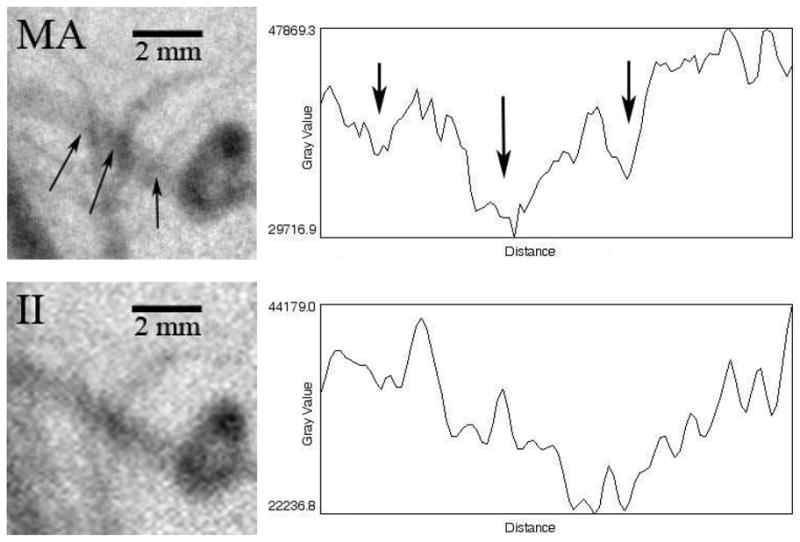
Images of and profiles (across the vessel centerline) through a region containing vessel overlap (arrows)
These results suggest that with the MA, the user is four times as likely to observe clearly overlapping vessels as opposed to an area of confusion (i.e., the direction and possible branching of the vessel) without taking multiple projection views at varying angles. Therefore, the ROI MA detector has the potential to provide more information with less dose.
The implications of having overall improved vessel imaging, with both the ability to image smaller vessels, as well as vessel overlap (and the ability to distinguish from branching vessels), include more accurate, non-invasive installation of biomedical devices, such as increased avoidance of perforator coverage with asymmetric stents.
3.2 Contrast-to-noise ratios
3.2.1 Simulated vessels
Eight different tubes with varying inner diameters ranging from 50μm to 1000μm were filled with an iodine contrast agent and placed parallel to each other in such a way that they would all be imaged at the same time by the 4.5x4.5 cm FOV of the MA detector (Fig. 4). The exposure technique parameters used in the analysis were 80 kVp, 125 mA, and 25 ms for both detectors with 20 mm of aluminum hardening filtration to limit the contribution of the polyethylene tubing to the image. The tubes were placed almost touching the detectors, giving a geometric magnification of approximately 1. The grid was removed from the II due to the lack of scattering material. Both the MA and II images were corrected for offset and gain.
Figure 4.
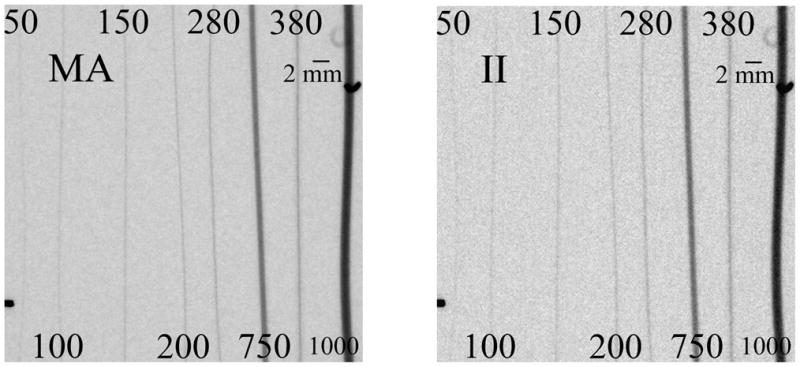
Simulated vessels filled with contrast. The inner diameters are numbered (in μm)
The value used for Sbackground was an average of 16 background regions adjacent to the 8 different tubes. The standard deviation of these 16 background regions was determined for the noise term. Two different methods were used to determine Svessel. In one, the inner most portion of the simulated vessel was selected and the average pixel value of this region was used as Svessel. In the second, the minimum pixel value of an integrated 10 pixel wide line profile was determined for 5 different regions across the different tubes and averaged to give Svessel. Both methods yielded similar results (agreed within 2%). The average of these two methods was used for the final analysis.
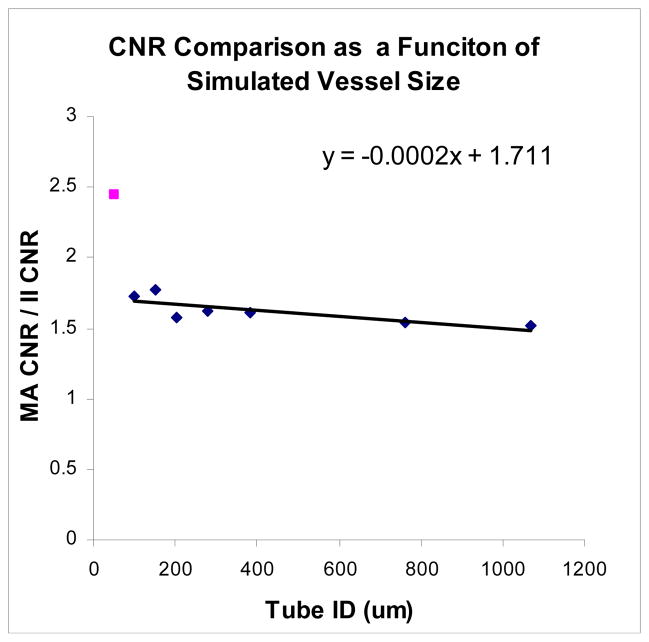
The CNR obtained with the MA detector was compared to that obtained with the II as a function of simulated vessel size (Fig. 5). The MA provides consistently better CNR for all of the simulated vessel sizes. For the largest tube diameter of 1mm, the MA CNR was 1.5 times greater than the II CNR. A relatively linear increase was seen with decreasing tube diameter, down to the 100μm tube, with the MA providing a 1.75x improvement in CNR over the II.
Figure 5.
MA/II CNR increases approximately linearly with decreasing vessel size. The increase in MA CNR becomes substantially better at smaller sizes (outlying point)
The 50μm tube is distinguishable in both images (despite the 120μm pixel size of the II) due to the lack of background content and scatter x-rays along with the high contrast provided by the iodine. The signal corresponding to the iodine filled vessel is averaged across the pixel width, blurring the vessel across the pixel. In this case, the MA CNR is 2.5 times higher than that of the II.
3.2.2 Rabbit neurovasculature
Comparative DSA images were selected with similar vessel filling. Contrast to noise ratios (CNRs) were obtained for vessels of varying size in both sets of images using average pixel values and standard deviations for identical small regions of contrast and background in the MA and II image sets using equation 3. All vessels that consisted of no overlapping vessels and appeared identical in both images (orientation and filling) were analyzed for an entire rabbit study consisting of 4 different angles.
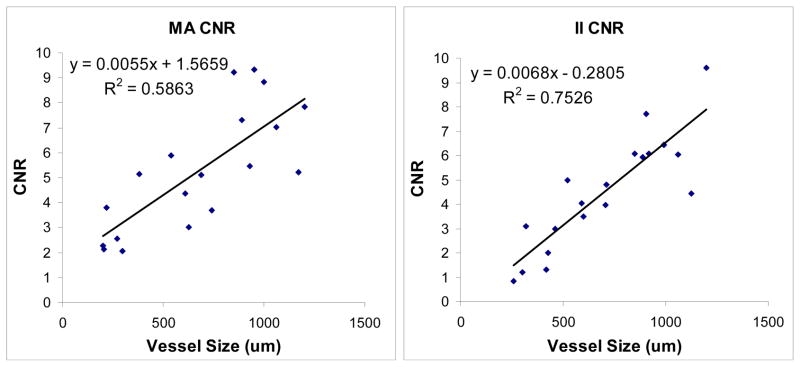
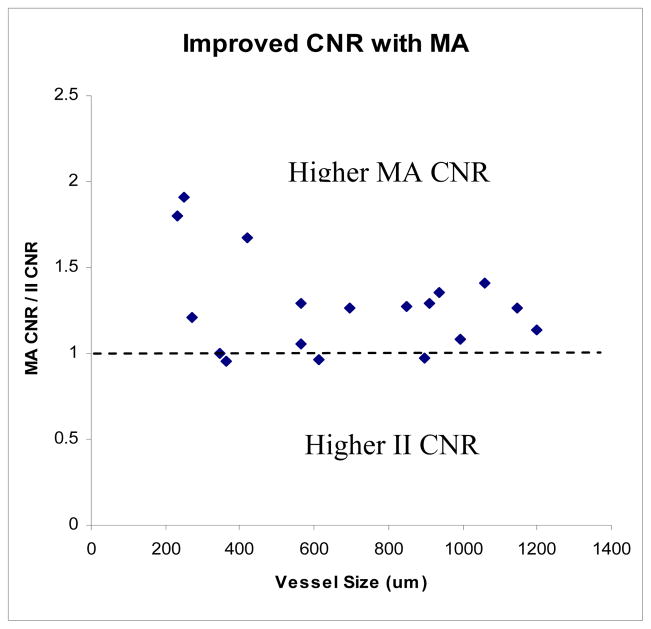
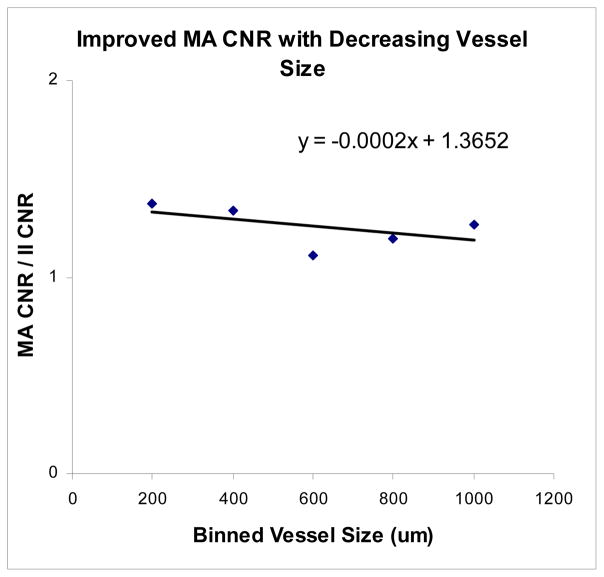
The CNR decreases linearly with vessel size for both detectors (Fig. 6). However, it decreases less for the MA than it does for the II, resulting in better CNR values with the MA than the II at smaller vessel sizes. The MA CNR data as a function of vessel size appears more varied, most likely due to the higher resolution of the detector (finer structure can be observed, so regions of background would be expected to have less uniformity than the lower resolution II, contributing to greater fluctuations depending on the background anatomy in the region of the selected vessel). Figure 7 shows the ratio of MA CNR and II CNR. The data appears quite ‘noisy’ due to the uncertainty in vessel size measurements in addition to the non-uniform background and scatter due to anatomical variations. However, there is a clear benefit in overall CNR for the MA over the II (indicated by nearly all of the points being greater than 1). When the CNR is averaged for the vessels in groups of 200μm (i.e., 200–400μm, 400–600μm, etc.), the data appears much more linear (Fig. 8) and is in better agreement with the simulated vessel results. The clearest advantage of the new MA-II system over the standard II is in the imaging of the smaller vessels (< 200 μm), where the vessel can be seen in the MA images, but not in the II images, effectively giving infinitely better CNR for the MA system versus the II.
Figure 6.
Linearity of CNR and vessel size
Figure 7.
MA provides consistently higher CNR, by an average factor of 1.25
Figure 8.
A linear increase with decreasing vessel size with the MA CNR/II CNR values averaged over intervals of 200μm
3.3 Multi-view 3D reconstructions
Further advantages of this new MA-II system include high resolution 3D capabilities, as a result of precise rotations, of the high resolution MA detector. As an illustration of this, multiview 3D reconstruction [4, 10] was performed for three projections (60 LAO, 20 RAO, 40 RAO) for the MA and II.
The corresponding projection of the 3-D volume superimposed on the original projection view in which the centerline data was obtained illustrate accurate results overall for both detectors (Fig. 9). The multiview technique does an accurate job of determining the vessel position in 3-D when compared to the projection views that were used for the reconstruction for both the MA and II. However, an examination of a fourth projection view corresponding to an angle which was not used in obtaining the 3-D centerline points (40 LAO) reveals there is slightly better agreement between the MA reconstruction results versus the II. Greater deviations between the 3-D vessel and the image can be seen in the II comparison (Fig. 10). It should be noted that neither detector perfectly aligned in comparison with this fourth view. Slight (unavoidable) motion of the vessels between acquisitions further complicates this comparison. However, both detectors faced the same difficulties, and despite this, it appears the MA performed slightly better. These results are in agreement with those of another paper in this conference [9]. This indicates that more accurate 3-D representations can be obtained with the deployment of the MA, demonstrating another potential benefit of having the additional MA detector.
Figure 9.
Very good agreement between both sets of 3-Ds and original vessel views in which the 3-D centerline points were obtained (40 RAO view). The right image is identical to the left image with the additional 3-D overlay.
Figure 10.

MA 3-D with slightly better accuracy than II 3-D in comparison with a fourth projection not used in obtaining the 3-D centerline points (40 LAO view). The arrows illustrate deviations.
4. CONCLUSIONS
A new MA-II system has been developed allowing the operator to use the high resolution MA as an alternative to a standard II and to switch between the two, depending on the imaging task. To illustrate this system’s functionality, images of rabbit neurovasculature were taken at oblique angles for both MA and II detectors. This MA-II system can be operated in lower-resolution, larger FOV II mode or in higher-resolution, ROI MA mode to provide sharper images with higher contrast-to-noise ratios. Further, in the ROI MA images, small and/or overlapping vessels can be better visualized.
Acknowledgments
This work was supported in part by NIH R01 grants EB002873, NS43024, HL52567, and EB02916 and an equipment grant from Toshiba Medical Systems Corp. The authors would also like to acknowledge Ann Marie Paciorek for her technical assistance with the rabbits, as well as additional support from the Frank B. Silvestro Endowment Scholarship.
References
- 1.Ganguly Arundhuti, Rudin Stephen, Bednarek Daniel R, Hoffmann Kenneth R, Kyprianou Iacovos S. Micro-angiography for neuro-vascular imaging. I. Experimental evaluation and feasibility. Med Phys. 2003 Nov;30(11) doi: 10.1118/1.1617549. [DOI] [PubMed] [Google Scholar]
- 2.Ganguly Arundhuti, Rudin Stephen, Bednarek Daniel R, Hoffmann Kenneth R. Micro-angiography for neuro-vascular imaging. II. Cascade model analysis. Med Phys. 2003 Nov;30(11) doi: 10.1118/1.1617550. [DOI] [PubMed] [Google Scholar]
- 3.Yadava Girijesh K, Kyprianou Iacovos S, Rudin Stephen, Bednarek Daniel R, Hoffmann Kenneth R. Generalized Performance Evaluation of X-ray Image Intensifier compared with Microangiographic System. Proceedings of SPIE; pp. 419–429. [DOI] [PMC free article] [PubMed] [Google Scholar]
- 4.Noël Peter, Hoffmann Kenneth R, Walczak Alan M, Dmochowski Jacek. Registration of vascular 3D data sets obtained from multiple-view reconstructions. Proc. CARS 2004, International Congress Series; 2004. pp. 329–334. [Google Scholar]
- 5.Fujita H, Doi K, Fencil LE, Chua KG. Image feature analysis and computer-aided diagnosis in digital radiography. 2. Computerized determination of vessel sizes in digital subtraction angiographic images. Med Phys. 1987;14:549–556. doi: 10.1118/1.596066. [DOI] [PubMed] [Google Scholar]
- 6.Hoffmann Kenneth R, Nazareth Daryl P, Miskolczi László, Gopal Anant, Wang Zhou, Rudin Stephen, Bednarek Daniel R. Vessel size measurements in angiograms: A comparison of technique. Med Phys. 2002 Jul;29(7) doi: 10.1118/1.1488603. [DOI] [PubMed] [Google Scholar]
- 7.Hoffmann Kenneth R, Dmochowski Jacek, Nazareth Dary P, Miskolczi László, Nemes Balazs, Gopal Anant, Wang Zhou, Rudin Stephen, Bednarek Daniel R. Vessel size measurements in angiograms: Manual measurements. Med Phys. 2003 Apr;30(4) doi: 10.1118/1.1562491. [DOI] [PubMed] [Google Scholar]
- 8.Ionita Ciprian N, Rudin Stephen, Hoffmann Kenneth R, Bednarek Daniel R. Microangiographic Image Guided Localization of a New Asymmetric Stent for Treatment of Cerebral Aneurysms. Proc. of SPIE; pp. 354–365. [DOI] [PMC free article] [PubMed] [Google Scholar]
- 9.Patel Vikas, Kuhls Andrew T, Noël Peter B, Walczak Alan, Ionita Ciprian N, Chityala Ravishankar, Hoffmann Kenneth R, Tranquebar Rekha, Rudin Stephen. Experimental Comparison of Cone Beam CT (CBCT) Reconstruction and Multi-View Reconstruction (MVR) for Microangiography (MA) Detector System. To be presented at SPIE Feb. 2006; paper; pp. 6142–85. [DOI] [PMC free article] [PubMed] [Google Scholar]
- 10.Noël PB, Hoffmann KR, Walczak AM, Schaefer S, Hanel RA, Wehman JC, Levy E, Guterman, Hopkins LN. Generating of 3D data during neurovascular interventions by using Multi-Projection Imaging’. Proc. CARS 2005, International Congress Series; 2005. pp. 334–338. [Google Scholar]


