Abstract
For treatment of cerebral aneurysms, the low porosity patch-like region of a new asymmetric stent must be accurately aligned both longitudinally and rotationally to cover the aneurysm orifice. Image guided interventions (IGI) for this task using either a high spatial resolution microangiographic detector (MA) or a standard x-ray image intensifier (XII) are compared. MA is a custom built phosphor-fiberoptic-CCD x-ray detector; the MA array is 1024X1024 with 43 microns pixels. We designed an experimental simulation of the IGI which involved localization using a combination of a computer-controlled rotational stage supported on a linear traverse. A catheter containing the asymmetric stent with special gold markers was positioned near the aneurysm of a vessel phantom which is contained in a flow loop to enable contrast injection for creation of roadmap images. We used four different configurations for the markers consisting of dots and lines. The true stent alignment, obtained by direct visual viewing, was determined to better than one degree rotational accuracy. The resultant IGI localization accuracy under radiographic control with the microangiographic detector was 4° compared to 12° for the XII. In general the line markers performed better than the dot markers. Experimental data show that high resolution detectors such as MA can vastly improve the accuracy of localization and tracking of devices such as asymmetric stents. This should enable development of more effective treatment devices and interventions. (Partial support from NIH grants NS38746, NS43294, and EB002873; UB STOR, Toshiba MSC, and Guidant Corp.)
Introduction
Asymmetric stents [1], [2] are new devices we designed for the treatment of the intracranial aneurysms. Unlike currently used stents which are mesh-like cylinders of uniform high porosity, the asymmetric stent prototypes have a very low porosity region (only 25% open) sustained by a porous scaffold (80% open) (Fig. 1). In order to treat the aneurysm, the asymmetric stent is deployed in such a way that the asymmetry covers the aneurysm entrance. The very low porosity region is designed to reduce the inflow into the aneurysm and create conditions favorable to thrombus formation [2] and hence healing of the malformation. The device should reduce the invasiveness of treatments such as clipping or filling with detachable coils and should eliminate post-treatment complications such as herniation and aneurysm regrowth.
Fig. 1.
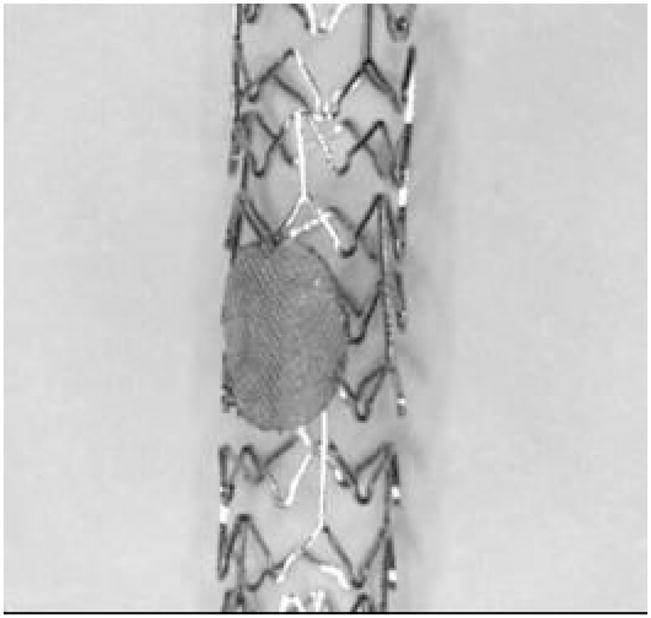
Asymmetric stent design
The special design of the stent is due to the constrictions imposed by the intracranial vasculature. In the area of the Circle of Willis where most of the cerebral aneurysms occur, the vasculature is very dense due to multiple branching of the arteries in very short distances. The small daughter vessels called perforators are of the order of a hundred microns and feed brain tissue directly. Blockage of such perforators can cause stroke or irremediable damage and loss of different neurological functions. In [6], C-Y. J. Yang et al. studied the probabilities of blockage of perforator distributions using stents with different porosities and wire diameters. Their results indicated that for a stent with 80% porosity and a wire diameter of 50 microns the probability of blockage of a perforator is below 0.5%. However, usage of a stent with uniform porosity having such parameters will have very small effect on the flow in the aneurysms in order to create conditions for thrombosis. On the other hand, using a very low porosity stent will have a very high probability of blockage of perforators. The asymmetric stent design will ensure that both requirements will be satisfied; it will radically change the flow in the aneurysm while maintaining a very low probability of blockage of adjacent perforators.
The procedure of implanting an asymmetric stent occurs under x-ray image guidance. The asymmetric stent will require precise positioning not only in the longitudinal direction but also azimuthally with regard to the vessel lumen. Most of the procedure occurs under x-ray fluoroscopy until the stent is brought to the place of intervention; at this stage the stent must be rotated in such a way that the asymmetry faces the aneurysm neck. This final part requires higher image quality than standard fluoroscopy mode so a low frame rate in the angiographic mode may be used for the finer adjustments. In order to improve the accuracy of placement during image-guided interventions of an object such as a stent, different groups of investigators have taken various approaches. In general, optimization of detector performance parameters, such as effective pixel size [10] or detector resolution [3] can increase not only the accuracy of localization but also the detectability of a certain object. Another improvement of the localization can be achieved by correlating the detector characteristics with the x-ray exposure parameters. In [9], I. Kyprianou et al. studied the detectability of a wire strut of a stent by appropriate selection of the x-ray parameters.
The effect of the detector characteristics on the longitudinal placement of a device under x-ray guidance has been studied by Z. Wang, et al. [11]. They compared the accuracy of placement of a catheter with regard to longitudinal directions using two different x-ray detectors: a standard x-ray image intensifier (XII) and a high-resolution microangiographic (MA) detector [3], [4], [7], [8], [9]. The observer study results showed that under x-ray imaging, the guide wire can be positioned with an accuracy of better than 120 micron with regard to an object when the XII is used and 50 microns when using the MA detector. In a similar study which compared the two detectors, C.N. Ionita, et al. [5] investigated the accuracy of azimuthal placement of an undeployed modified stent in a head phantom. The structure of the stent could be detected only in the images acquired with the high resolution detector; hence reliable localization of the stent with regard to the orientation could be done only in this case.
The current work presents an improvement of the placement and hence localization of the asymmetric stent during image-guided intervention by use of a unique marking configuration design. This allowed accurate localization not only with the MA detector but also when using an XII. The choice of the markers material and size was very limited due to biocompatibility, radiopacity, and mechanical structure concerns. The most-used materials for intravascular markers are gold and platinum. Due to their high atomic number, they have a higher attenuation coefficient, and hence they give a better signal.
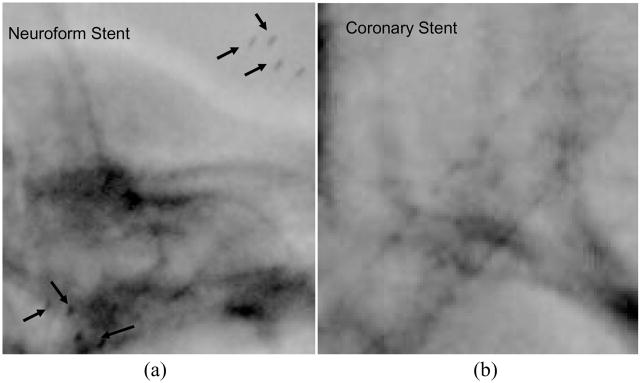
In general, neurovascular stents are made from memory-shaped alloys such as Nitinol; the structure of such a stent is not visible with the II and barely detectible with the MA [8]. As can be seen in Fig. 2 the presence of the Neuroform stent (Boston Scientific Corp, Mountain View CA) is determined only by a set of markers placed at the ends of the stent. To simulate this type of stent, we put the markers on a wooden cylinder of 1.1 mm diameter. The coronary stents we used to create the asymmetric stent contain a significant amount of stainless steel which makes them very visible with both II (Fig. 2(b)) and MA.
Fig. 2.
Image of a Neuroform stent (a) respectively a coronary stent (b) taken in the angiography mode using XII and a head phantom. The arrows in the image (a) indicate the end of the stent platinum markers.
When placed in a catheter, a stent used in neurosurgical interventions such as the Neuroform stent has a diameter of less than one millimeter with a structure wire smaller than 100 microns. Considering these dimensions, the marker will have to be of the same dimension in order not to modify the mechanical properties of the stent. We designed three different types of markers in order to indicate the asymmetry on the stent and verified the accuracy of the localization using two detectors in two different experiments.
Accuracy of localization was evaluated by tracking the position of the markers during rotation of the catheter and also by comparing positions of the stent which were separated by very small angles.
2. Materials and Methods
2.1 Experimental Setup
We verified the accuracy of azimuthal localization of the asymmetric stent in two distinct experiments. In the first experiment which simulated the stent with undetectable structure, we used a simulated undeployed stent by placing the gold markers on a 1.1 mm diameter cylinder made of wood. For the second experiment, we used a prototype of the actual asymmetric stent. The asymmetric stents were created by attachment of a low porous stainless steel cloth patch onto a stent using a laser micro welder. The stents we used were current Coronary Stents (Guidant Corp. Fremont, CA). Before crimping the stents on a balloon-tipped catheter, we used a gold wire in order to create four different markers on the stent. The marker configurations are presented in Fig. 2. The markers are indicated in the figure with the black dots or lines. On the upper row a top view of the marked asymmetric stent is shown and on the lower row are represented the same stents in transverse views. For the dot markers, Fig. 2(a) and (b) we used the gold wire to create dots of approximately 150 microns in diameter, and for the line marker (Fig.2(c), we used 100 microns wire
The experimental setups are presented in Fig. 4(a, b). The general setup is the same for both types of stent localization evaluations with the difference that, for the simulated stent, we used a uniform 16 cm diameter, cylindrical head equivalent phantom made of Plexiglas while, for the asymmetric stent prototype, we used an actual head phantom (The Phantom Laboratory, Salem, NY). In the case of the simulated stent, the aneurysm phantom was placed inside the Plexiglas head phantom, and we acquired images at two different angles in order to simulate biplane imaging. In the second case, the aneurysm was placed outside the head phantom to overlap the sinus area, the densest bony structure in the skull. This particular position was chosen to replicate the position on AP projection where most neurovascular malformations occur (i.e., the Circle of Willis). The aneurysm phantom was connected to a pump which we used to simulate blood flow for the angiograms. Through a divider, we inserted a balloon tipped catheter on which we had crimped the asymmetric stent. The catheter was fastened tightly to a stepper-motor rotary stage in order to rotate the stent with high accuracy. In the catheter, we inserted a radiopaque guide wire with diameter of 0.014”.
Fig 4.
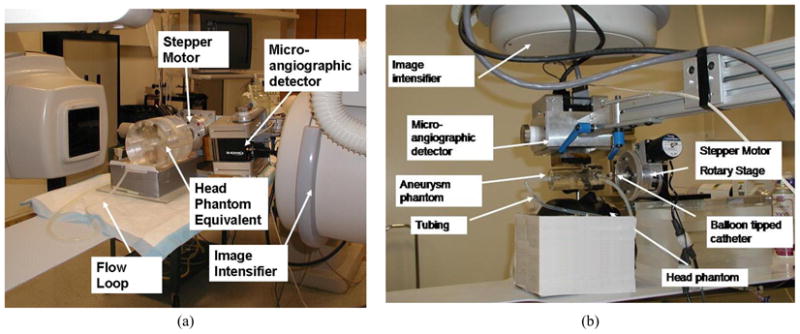
Experimental setup: (a) setup for the simulated stents using a head phantom equivalent, (b) setup for the real asymmetric stent using a head phantom containing bony structures,
Before the insertion of the stent, we acquired angiograms with Iodine contrast Ioversol (Mallinckrodt Inc. St Louis, MO). Later, we used one of the contrast injection images in order to simulate a road map for the aneurysm model during stent placement. For the simulation, we chose the orientation which enabled best viewing of the aneurysm neck. Then the stent was positioned visually in such a way that the markers were aligned with the neck. This position was used as reference for future positioning of the stent. Starting with this position, we rotated the stent for a full 360 degrees in increments of 2 degrees.
The images were acquired with two x-ray detectors: a standard x-ray image intensifier mounted C-arm angiographic unit Infinix 3000 (Toshiba Medical Systems) and a microangiographic detector. The microangiographic detector [2] is a custom-made detector which is made from a modified Dalsa 4m4 CCD camera. The CCD camera is optically coupled to a CsI(Tl) input phosphor through a 1.8 to 1 minifying fiber optic taper. The pixel size of the camera is 45 microns, and it has a field of view of 4.5 × 4.5 cm. The detectors were use separately at the same source-to-image distance. For image intensifier acquisition, the MA was moved out of the field of view, and then the images were acquired.
2.2 Data analysis
We evaluated and compared the results obtained with the two detectors using a method which identifies and calculates the positions of the markers relative to each other. As the catheter with stent rotates in steps of 2 degrees, we evaluated certain metrics on the acquired images in order to differentiate between different positions. The accuracy of the placement was measured in terms of the ability to distinguish between two positions separated by a small rotation of the catheter. The metrics for the rotation of the stent are schematically presented in
Fig. 5. In the figure, we illustrate the cross section through a stent at two different orientations, denoted with 1 and 2, which are separated by a step angle θ. The horizontal dotted line indicates the x-ray projection of the center of the stent; the angle between the position of a marker and the projection of the center of the stent, will be referred as the angulation and it will be denoted by Φi (i=1,2).
Fig. 5.
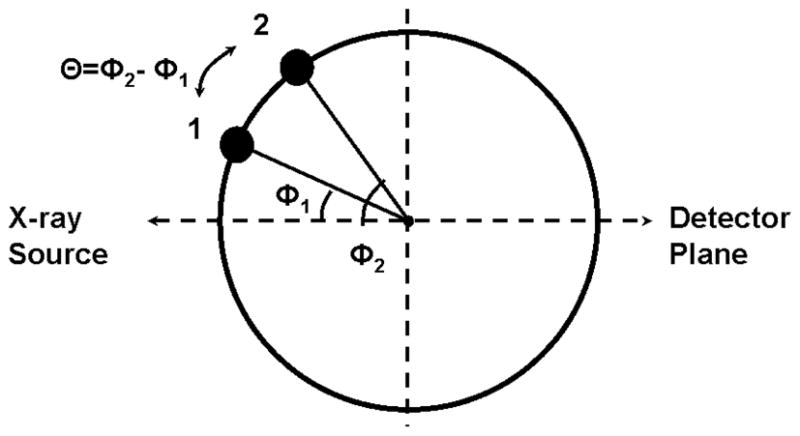
Schematics of the position of a marker when the stent was rotated by an angle θ, starting with the initial position Φ1
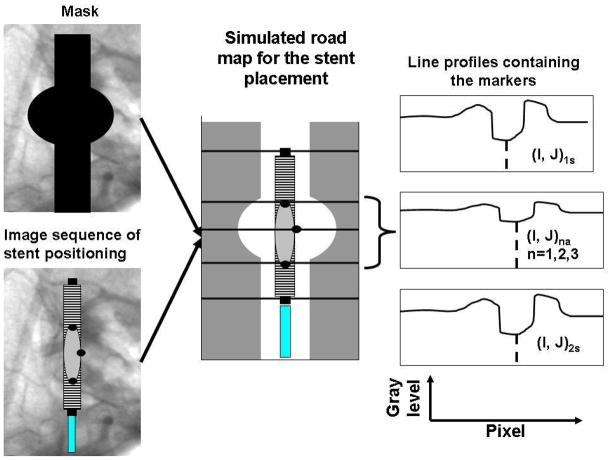
The algorithm of the analysis is presented in Fig. 6, first we averaged three images acquired during contrast injection, and we created a mask image. Then, we took the image sequence obtained during the stent rotations, and using the mask we simulated a roadmap for the stent placement. On the simulated road-map, we took line profiles across the markers at the positions indicated manually. Given the indicated position of the line profile, adjacent lines in the image were averaged to obtain reduced errors due to partial pixel integration. We also passed the average line profiles through a median filter of rank 3 in order to reduce the effects of the noise from the acquired images.
Fig. 6.
Analysis algorithm: In the figure, the quantities referring to the end of the stent markers were indexed with (s) while the markers indicating the asymmetric region were denoted with (a).
On the line profile, the presence of the marker was indicated by a valley in the signal. The valley was located between two peaks because the vessel road map appears as region of high intensity on the profile. The line profile was passed through a valley detection algorithm which gave us the position and the amplitude of the signal. The algorithm consisted in fitting the data with a quadratic curve to successive groups of points. The fit worked with great accuracy due to the fact that the line profiles on the road map did not have significant discontinuities other than noise in the region of the markers. Before starting the fit, the user had to select three parameters: the width, the threshold, and the sign of the second derivative. The width specifies the number of the data points used for the quadratic fit. The sign of the second derivative specifies whether the signal is a peak or valley, and finally the threshold allows identification of the signals to be considered as possible candidates for the marker signal. To find the position of the end stent markers, we used a width of 30 pixels for the image intensifier and 80 pixels for the MA detector. For the markers indicating the asymmetry on the stent, the widths used were 3 pixels for the XII and 6 pixels for the MA. The amplitude threshold was variable depending on the window and level used.
In the acquired images, the end-stent markers are tracked and their center positions are fit with a line to obtain the axis of the stent. The line profiles were then taken perpendicular to the axis of the stent. By averaging three pixel lines at the position of the marker, effects due to fluctuations about the indicated pixel position are reduced.
For each image sequence, the positions and the metrics between the markers were recorded and plotted as a function of the angle. For a rotation without additional motion, the projection of the marker must follow a sine curve. For each run, we obtained a set of such curves equal to the number of the markers used to indicate the asymmetric patch.
We analyzed all the curves to evaluate the position shifts of the markers and hence the accuracy of placement for that particular orientation of the stent. For the analysis, we considered the sine curves, and we calculated the shifts in the peak positions for each orientation and step angle. To distinguish between slightly different positions, the projection images of the markers must be separated by a minimum observable shift. This minimum observable shift depends on many factors such as: detector type, x-ray parameters, signal to noise ratio, etc. For our case just for comparison purposes, we chose 1 pixel as our minimum detectible shift. In a full rotation with a given step angle, we counted all the cases for which we obtained at least the minimum detectible shift, and we expressed that number as a percent of the total projections. For each marker configuration, we considered the contributions from all the markers as well as the information obtained from the simulated biplane.
The deviation of the data from the sine curve was evaluated by calculating the residuals after fitting the position curves with an equation of the form:
where P1, P2 and P3 are the fitting parameters, x is the angle in degrees, and y is the distance between the projection of the marker in the image and the projection of the center of the stent.
Using the residuals, we calculated the fit standard deviation (fsd) as the square root of the sum of the square residuals divided by the degrees of freedom of the plot. For our study, we have 180 data points per curve and three fitting parameters, hence 177 degrees of freedom. This fitting standard deviation calculation cannot be used to characterize the two detectors due to the fact that the pixel size is different, it is used only to evaluate the fluctuations caused by other factors such as focal spot blurring, noise, or background structure interference.
Finally, we evaluated real asymmetric stent cases; in this case, the stents were placed on a catheter which was connected to the stepper motor stage. To accurately simulate the clinical conditions, a head phantom containing bony structure was used, and a radio-opaque guide wire was inserted in the stent catheter.
3. Results
3.1 Simulated asymmetric stents
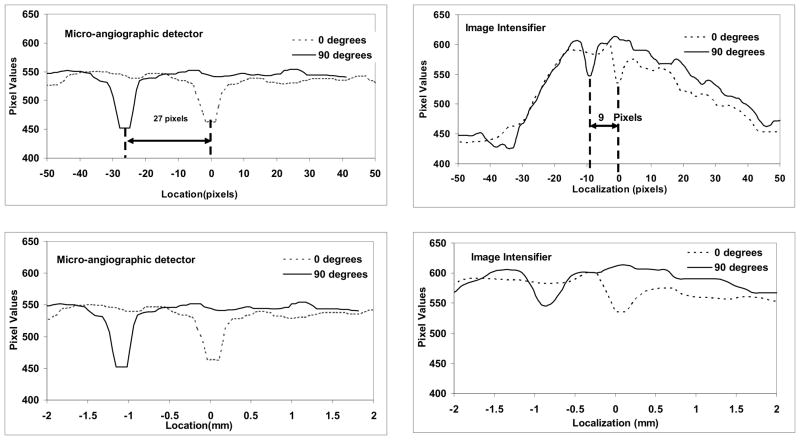
An example of the images acquired is presented in Fig. 7. The two lines along which we took profiles to track the motion of the markers are indicated with dotted lines. The larger markers located in the upper and lower portions of the image are the markers at the ends of the stent. The average line profiles obtained for single markers on the stent are presented in Fig. 8. We plotted the profiles from two different markers separated by 90 degrees for both detectors. On the lower row, we plotted the position of the marker as a function of the distance in mm and, on the upper row, we plotted the same line profiles as a function of the distance in pixels. For our study, we chose to evaluate the position of the stent using metrics expressed in pixels because the evaluations during interventions are based on the image information. Even though the observed procedure is identical, the sampling is different, and we wanted to our evaluations to reflect this. . Because the fields of view differ for the MA detector (4.5 cm) and the XII (12.7 cm), the shapes of the line profiles differ. The XII covers a larger area which includes the entire aneurysm phantom; on the roadmap subtracted image, the contrast-filled aneurysm phantom appears as a broad high contrast region about 90 pixels in width and 150 gray levels high. The stent is located within this region, and the signal corresponding to the marker is situated near the top. For the MA detector, the line profiles are situated entirely within the vessel, and the high contrast region corresponding to the entire aneurysm phantom is wider than the profile and so the pixel values of the entire profile are high. . The origin of the x-axis in both detector cases is chosen to be the intersection between the line profile and the axis of rotation of the stent then why is one marker valley located at 00. For the MA, the x-ray parameters were: 74 kVp, 350 mA, 0.6 mm focal spot size and 45 ms exposure time per frame. For the XII, the x-ray parameters were: 74 kVp, 125 mA, 0.3 mm focal spot and 65 ms exposure time. The larger focal spot was used for the MA because a larger mAs was required.
Fig. 7.
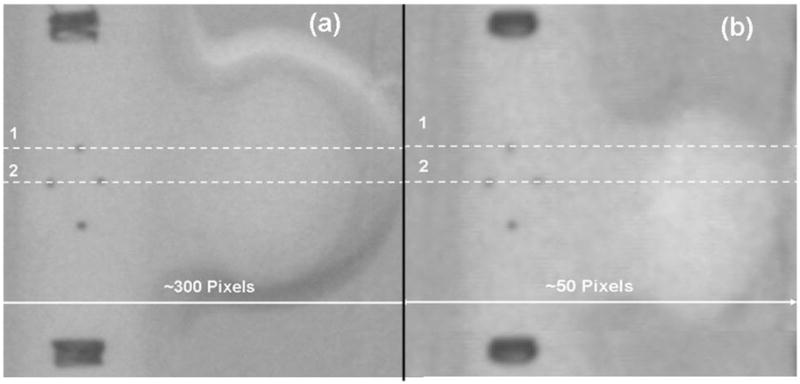
Images of the simulated stent obtained with MA (a) and the XII (b).
Fig. 8.
Plots of the average line profiles obtained for one marker (line 1) at two positions separated by 90 degrees. Profiles from images of the simulated stent acquired with the MA are on the left and those acquired with XII are on the right. The lower figures shows the pixel values as a function of distance and the upper figures shows the values as a function of pixel number
For these conditions, the signal obtained with the MA had a height of 100 gray levels and a half width of 6 pixels, while the one obtained from the XII was about 50 gray levels and only 3 pixels half width. The separation between the two extreme positions was 27 pixels for the MA and 9 pixels for the II in conditions in which the pixel size was 45 μm for the MA and 120 μm for the II.
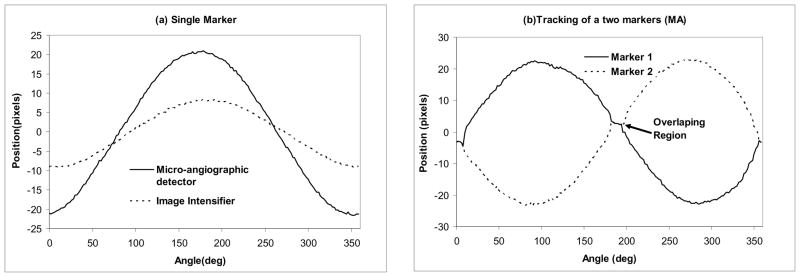
In Figure 9(a), we present a plot of the peak position of a marker for both detectors for the full 360 degrees rotation. The images were acquired for both systems using the same geometrical conditions in terms of magnification, position of the aneurysm, and the simulated stent used. The marker oscillated between −9 and + 9 pixels for the XII and −21 and +21 pixels for the MA. In Fig. 9(b), we present the plot of the positions of the middle markers in the 4-dots configuration shown in Fig. 3(b). The middle markers are separated by 180 degrees, thus there will be two regions in which the markers overlap (circle in Fig. 9b) during the rotation of the stent. In these regions, we obtained only one peak on the line profile. For the XII, the overlapping region extended for 22 degrees, for the MA, the region was only 12 degrees. The overlap interval indicates the ability to determine or distinguish the orientation of the stent for a given detector resolution and marker size. In the case of the dot marker, the overlap extended for about 22 degrees for the II and 18 degrees for the MA. For the parallel-line maker, the overlap was 12 decrees for the II and 10 degrees for the MA. The smaller overlap in the case of the line markers is due to the smaller size of the gold wires –(100 μm) compared to the diameter of the gold dots (approximately 150 μm). The small difference (only 17%) between the MA and the II is probably due to increased geometric unsharpness in the MA acquisitions due to the larger focal spot.
Figure 9.
Peak position vs. the angle: (a) Middle marker tracking for the 3 dot type of marker obtained with the MA and II. (b) Middle markers positions for the four dot marker type using MA.
Fig. 3.
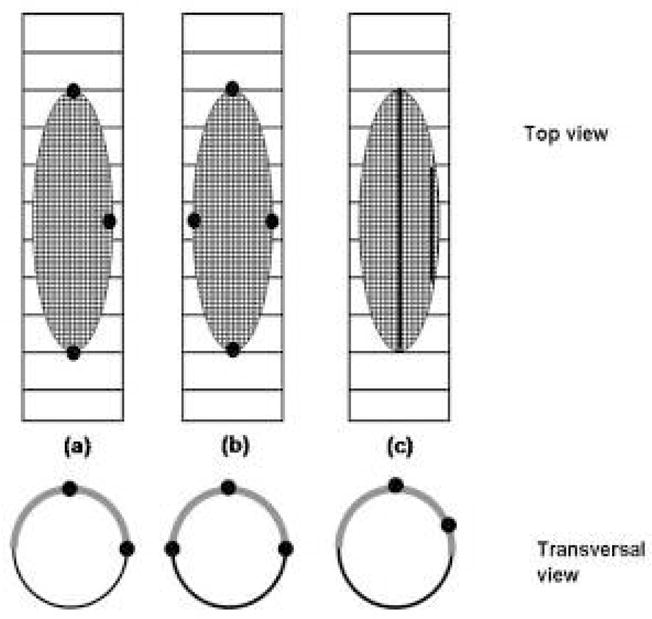
Different types of asymmetric stents marking patterns
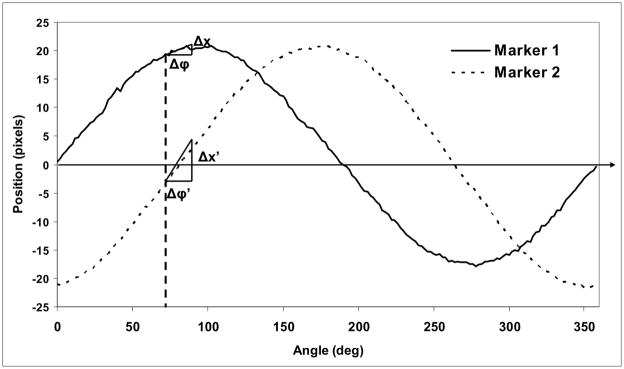
Localization of markers is complicated by the sinusoidal behavior of the projection. During rotation, the separation between successive marker positions depends on the orientation Φ and the increment angle θ in a sinusoidal manner. For Φ close to zero, the shift in position is small. To discriminate between two successive images, the projections of the markers indicating the asymmetry must be separated by at least the minimum observable shift which we have chosen to be 1 pixel. For the evaluation of the shifts between two positions, we considered the sine curves shown in Fig. 10. The shift, Δx, in the image for a given step angle θ depends on the orientation angle, Φ. Near the extrema of the curves, relatively large changes in angle result in relatively small shifts in position. However, if two markers are used, placed at 90 degrees relative to each other, then when one marker is situated in the region with minimum projection shifts, the other is situated at an orientation which gives the largest shifts, e.g., 0 or 180 degrees with respect to the projection of the center of the stent.
Fig. 10.
Position of two markers separated by 90 degrees using the MA.
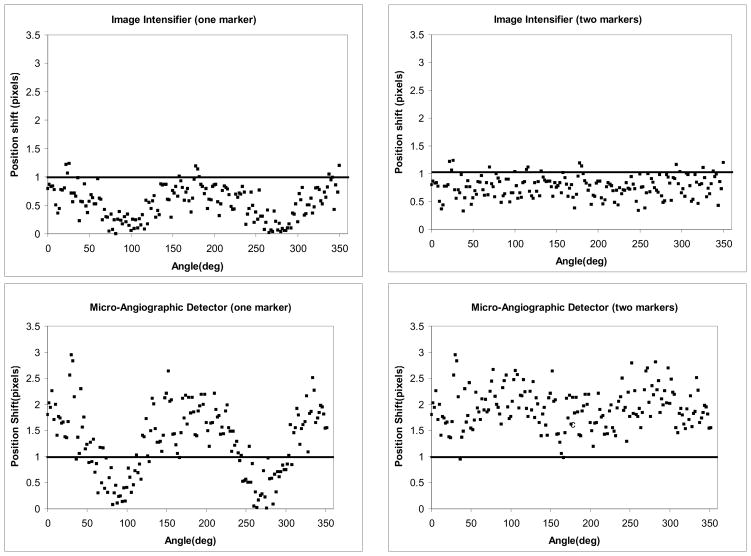
The correlation between the projection shift and the orientation Φ for a given step angle θ (6 degrees here)) is presented in the plots in Fig. 11. In the plots on the left, we considered the absolute value of the position shift of a single marker. The horizontal line indicates the limit for minimum detectable shift (chosen to be one pixel here). For the II, most of the points are situated below the detection limit. For the MA, the points are distributed above and below the detection limit, with the position shift dropping below the limit near orientations of 90 and 270 degrees. However, as seen in the plots on the right, when a second marker is placed such that it is oriented at 90 degrees to the first, shifts of greater than one pixel can be detected for at least one marker at any orientation for a step angle of 6 degrees. For the II, inclusion of the second marker does not bring a substantial improvement in the shift detection.
Fig. 11.
Plot of the marker shift in the 3 dots marker configuration (Fig. 2(a)) for a step angle of 6 degrees for both detectors
A better understanding about which configurations perform better for each detector can be obtained if we calculate the percentage of the position shifts that are greater than or equal to one pixel for a given step angle The results for each marker configuration are summarized in the Table 1. For the II for a rotation with a step of 12 degrees, we can observe shifts in the markers configurations for almost any orientation angle. In the case of the MA for a rotation of only 4 degrees, the shifts could be observed for more than 70% of the orientations. The acquisitions are presented for the single view and the biplane simulation.
Table 1.
. Percentage of the shifts greater than or equal to the minimum detectable shift.
| Acquisition Type | Marker configuration | 3 dot | 4 dot | Parallel lines | |||
|---|---|---|---|---|---|---|---|
| Step angle | II | MA | II | MA | II | MA | |
| Single Projection | 4 | 2% | 72% | 10% | 70% | 14% | 77% |
| 6 | 7% | 98% | 10% | 95% | 16% | 95% | |
| 12 | 99% | 100% | 85% | 95% | 89% | 95% | |
| Biplane Projection | 4 | 10% | 100% | 20% | 90% | 30% | 86% |
| 6 | 10% | 83% | 100% | 90% | 100% | ||
| 12 | 100% | 100% | 100% | ||||
The results of the sinusoidal fitting gave an average R^2 of 99% for both detectors and for all markers configurations. When we had two valleys on the same line profile as in the case of the 4 dots marker configuration or parallel lines, the average standard deviation was 0.36 pixels (42 μm) for the II and 0.95 pixels (42 μm) for the MA. The fsd could be used as an indication of the variance of the peak positions at each step for a 360 degrees rotation. However the residual distribution was not homogeneous during a full rotation. The largest contribution was given by the orientations which were orthogonal to the projection of the center of the stent. In order to avoid such cases, one could change the orientation of the c-arm in such a way that an optimal view is obtained. The higher values for fsd obtained for the 4 dot configurations and for the parallel line were caused by the overlapping regions described before.
3.2 Asymmetric Stents Prototype
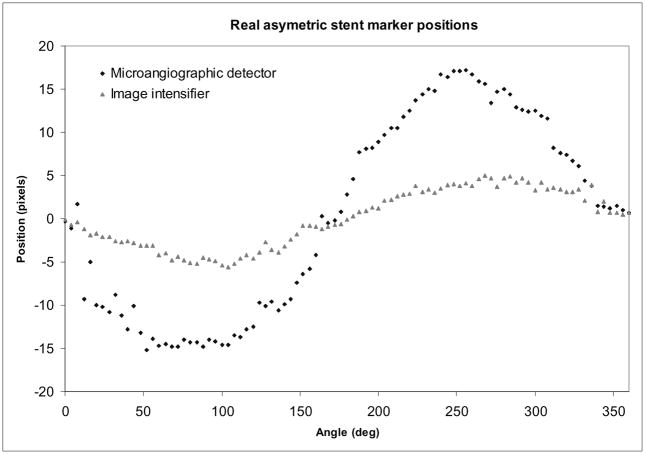
The result for using the real asymmetric stent with a head phantom that contains bony structure generally follows the trends obtained for the ideal case. In Fig. 12, we present the curves obtained for markers in a 3-dots configuration obtained with both detectors. In general, peak localization was more difficult due to the interference of the guide wire and the stent structure. To extract the signal of the marker in this case, estimated the local structured background using line profile parallel to the one passing through the marker and separated by only a few pixels (5–10). We divided the marker line profile by this ”background” profile and eliminated the structure of the stent and the guide wire signal.
Fig. 12.
Real stent localization
The above described subtraction technique could not be applied to the data acquired with the line type of markers was difficult. The line markers extended over the entire asymmetric patch, and we thus had to use a line profile which was situated farther from the wires. The option of using a more distant line profile was not successful due to the inhomogeneities in the road map. Most of these inhomogeneities were due to the differences in concentration of the injected iodine contrast as well as to the intensity loss caused by the bony structure of the head phantom. In this case, we could accurately evaluate only the dot markers. The line markers could be seen moving for very short intervals; this caused in general faulty readings of the peak tracking.
Both markers configurations (3 dots and 4 dots) behave similarly; for the II with a rotation of 20 degrees, the markers shift could be observed in 89 percent of the cases; for the MA with a shift of 12 degrees, the markers shifts were observed in 90% of the cases. The fsd was 0.51 pixels (63 microns) for the II and 1.12 pixels (48 microns) for the MA.
4. Discussion
The studies presented in this work were performed in preparation for the next step in the development and evaluation of the asymmetric stent, which will be the evaluation of the stent in animal studies. For those studies, we need to develop a reliable and unique way of localization of the asymmetric stent. The results presented here indicate that localization of the stent can be done with an acceptable accuracy: 6 degrees for the MA and 12 degrees for the XII. Gold markers as small as 150 microns were easily detectible with both detectors in a setup which accurately simulated the real situations encountered in neuro vascular interventions.
Simulation of the biplane acquisition did not bring a substantial improvement. The contribution was only a few percent for the cases when minimum difference was observed. This is due mostly to our choice of placing the markers in such a way that they are separated by 90 degrees. The improvement is most probably due to the additional sampling that one more view added to the data.
Special attention should be given to marker configurations which have symmetry such as the 4 dot configuration (Fig. 3(b). In these configurations, certain positions separated by 180 degree will have the same projections which could cause a total misplacement of the stent. In this case, an additional view is necessary or a particular position of the c-arm is needed so that the orientation of the stent with regard to the aneurysm neck can be identified.
The real asymmetric prototype gave good results only for the dot type configuration. For the II, most of the difficulties were created by the interference of the guide wire projection in the image. For the MA, due to the increased resolution, this interference was even more amplified. During the acquisition, the signal from the markers used to indicate the asymmetric patch combined with the other signals giving fake positions of the peaks; most such interference was eliminated by a subtraction method described above. One way to solve this problem is to replace the guide wire with a wire which is not radio-opaque during this final stage; in this way the catheter still would have the support provided by the guide wire, and the interference would be removed.
Conclusions
The asymmetric stent is a device that could reduce the invasiveness of present neuro-interventional procedures while offering a more reliable treatment of intracranial aneurysms. The treatment is very dependent on the accuracy of the placement of the stent with regard to the rotational and longitudinal direction. We investigated the accuracy of rotational localization and placement of such stent using different marker configurations. Our results indicate that in cases where there are no additional structures, such as guide wires, the linear marking has better results than the dot markers. The biplane simulation offered an additional orthogonal view but did not substantially improve the placement of the stent. However, the comparison that we did between two detectors indicated that higher resolution detectors could bring noticeable improvement in device placement.
Acknowledgments
This work was partially supported from NIH grants NS38746, NS43294, and EB002873; UB STOR, Toshiba MSC. We would like to thank Guidant Corp. for donating the stents used in this study. We also would like to thank Mark English for his help in building the asymmetric stents and contributions to the development of marking techniques.
References
- 1.Rudin S, Wang Z, Kyprianou I, Hoffmann KR, Wu Y, Meng H, Guterman LR, Nemes B, Bednarek DR, Dmochowski J, Hopkins LN. Measurement of flow modification in phantom aneurysm model: Comparison of coils and a longitudinally and axially asymmetric stent - Initial findings. RADIOLOGY. 2004 Apr;231(1):272–276. doi: 10.1148/radiol.2311021741. [DOI] [PubMed] [Google Scholar]
- 2.Ionita C, Hoi Y, Meng H, Rudin S. Particle image velocimetry (PIV) evaluation of flow modification in aneurysm phantoms using asymmetric stents. SPIE Proceedings of Medical Imaging. 2004 doi: 10.1117/12.534274. [DOI] [PMC free article] [PubMed] [Google Scholar]
- 3.Rudin S, Wu Y, Kyprianou I, Ionita C, Wang Z, Ganguly A, Bednarek DR. "Micro-angiographic detector with fluoroscopic capability". Proc SPIE. 2002;3977:466–475. [Google Scholar]
- 4.Ganguly A, Rudin S, Bednarek DR, Hoffmann KR, Kyprianou IS. Micro-angiography for neuro-vascular imaging. I. Experimental evaluation and feasibility. Med Phys. 2003;30:3018. doi: 10.1118/1.1617549. [DOI] [PubMed] [Google Scholar]
- 5.Ionita C, Wang Z, Kyprianou I, Rudin S, Bednarek D. Comparison of Micro-Angiographic Detector with Standard X-Ray Image Intensifier for Rotational Localization of New Asymmetric Stents. AAPM 44th Annual Meeting 2002, Abstract (No. WE-D-518-06), Med. Phys; 2002. p. 1354. [Google Scholar]
- 6.Yang C-YJ, Rudin S, Wang Z, Wu Y. Determination of the probability for blocking small side-branch perforator vessels during cerebrovascular stent deployment. Radiology (Supl); Science Program and 87th Scientific Assembly and Annual Meeting of RSNA; Nov. 25 – Nov. 30, 2001; Chicago. Nov, 2001. p. 221.p. 159. exhibit 0253PH-p. [Google Scholar]
- 7.Iacovos S, Kyprianou S, Rudin D, Bednarek R, Hoffmann KR. Study of the generalized MTF and DQE for a new microangiographic system. Proc SPIE Int Soc Opt Eng. 2004;5368:349. doi: 10.1117/12.533512. [DOI] [PMC free article] [PubMed] [Google Scholar]
- 8.Rudin S, Kyprianou Iacovos, Zhou Wang MS, Ionita Ciprian, Ye Wu, Hanel Richardo, et al. Microangiography: Neurovascular Clinical Trials with a High-Resolution Region of Interest (ROI) Detector [Google Scholar]
- 9.Kyprianou I, Rudin S, Bednarek D, Hoffmann K, Wang Z, Ionita C, et al. Verification of a Detectability Simulation, by Clinical Visualization of a Neuroform Cerebrovascular Stent, Using a High Resolution Region of Interest (ROI) Detector [Google Scholar]
- 10.Jiang Yuhao, Wilson David L. Optimization of detector pixel size for stent visualization in x-ray fluoroscopy. Proc SPIE Int Soc Opt Eng. 2004;5372:311. doi: 10.1118/1.2169907. [DOI] [PubMed] [Google Scholar]
- 11.Wang Z, Rudin S, Wu Y, Hoffmann KR, Bednarek DR. Accuracy comparison of micro angiographic detector and image intensifier for an interventional localization task. Proceeding from 2002 IEEE International Symposium on Biomedical Imaging; Washington, DC. July 7–10, 2002; Proceedings CD-ROM. [Google Scholar]


