Abstract
The new Multi-View Reconstruction (MVR) method for generating 3D vascular images was evaluated experimentally. The MVR method requires only a few digital subtraction angiographic (DSA) projections to reconstruct the 3D model of the vessel object compared to 180 or more projections for standard CBCT. Full micro-CBCT datasets of a contrast filled carotid vessel phantom were obtained using a Microangiography (MA) detector. From these datasets, a few projections were selected for use in the MVR technique. Similar projection views were also obtained using a standard x-ray image intensifier (II) system. A comparison of the 2D views of the MVRs (MA and II derived) with reference micro-CBCT data, demonstrated best agreement with the MA MVRs, especially at the curved part of the phantom. Additionally, the full 3D MVRs were compared with the full micro-CBCT 3D reconstruction resulting for the phantom with the smallest diameter (0.75 mm) vessel, in a mean centerline deviation from the micro-CBCT derived reconstructions of 29 μm for the MA MVR and 48 μm for the II MVR. The comparison implies that an MVR may be substituted for a full micro-CBCT scan for evaluating vessel segments with consequent substantial savings in patient exposure and contrast media injection yet without substantial loss in 3D image content. If a high resolution system with MA detector is used, the improved resolution could be well suited for endovascular image guided interventions where visualization of only a small field of view (FOV) is required.
Keywords: Micro CT, x-ray detectors, diagnostic imaging, x-ray tomosynthesis, algorithms, image reconstruction, microangiography, multi-view reconstruction
1. INTRODUCTION
The evolution of Computed Tomography (CT) in x-ray imaging has been toward reducing the total scan time and dose to the patient while getting more accurate 3D reconstruction. One of the important new developments of x-ray imaging is Cone Beam Computed Tomography (CBCT). CBCT involves obtaining numerous 2D projections of an object to generate a 3D reconstruction. Although scan and reconstruction times have decreased for standard CT machines, it is becoming desirable if not mandatory to provide 3D image guidance during vascular interventional procedures using the same c-arm angiographic equipment that is used for vascular diagnosis and intervention. However, there might be some situations where the physical spacing between the detector and the patient would not allow acquisition of the full CBCT projection set. Moreover, greater patient dose savings would be desirable.
There are methods of reconstructing reliable 3D models of a vessel from biplane views [1–10]. A new technique, the Multi-View Reconstruction (MVR) [11], has been introduced for 3D reconstruction which does not require the full set of projection data but only a few projections. This method can reconstruct the 3D model based on the projections acquired during the procedure. Major advantages of the MVR method over traditional full CBCT are that it significantly reduces the dose requirement for the patient and it requires less total injection of contrast medium. Also, the MVR technique can provide quick and reliable results that can be used during the course of a procedure. Another advantage of the MVR method is that it can be used in situations where CBCT may not be possible because of the physical spacing limitations between the camera and the object. We wish to compare the performance of this technique between a high resolution, low noise microangiography (MA) detector [12, 13] and a standard x-ray image intensifier (XII). We will report on a comparison of the centerlines obtained from both micro-CBCT and MVR techniques based on the two detectors.
2. METHODS
2.1. micro-CBCT reconstruction technique
The 3D information of an object can be obtained using micro-CBCT. The slice information can be obtained from knowledge of the geometry of the setup and the projection images data using a standard Feldkamp-based reconstruction algorithm [14]. For accurate 3D information and artifact free slices, the geometry in which the projections are obtained must be calibrated properly. Instead of using a calibration phantom for calibration, a self-calibration algorithm [15] based on the images alone is used in this paper. As a result, the micro-CBCT slices represent the object precisely.
2.2. Segmentation technique
A 3D rendering can be made from a 3D centerline that can be calculated from the micro-CBCT centerline. Various techniques of segmentation have been published [16–18]. The 3D centerline from the micro-CBCT slices for this paper is calculated using the semi-automatic region-growing segmentation technique [19]. Based on the seed point determined by the user, the vessel to be segmented is identified. The segmentation is done in steps of data input, selection of region of interest (ROI), interpolation onto an isotropic voxel size, histogram analysis, setting of the seed point, and segmentation of the volume. By combining the center of the segmented volumes in each of the slices, the 3D centerline is determined.
2.3. MVR Technique
The MVR technique requires a set of three or more projections. The opacified vessel is indicated by an observer and fit with a cubic spline in each projection. An initial set of 3D vessel centerlines are reconstructed by pairing one of the views with each of the other views acquired and applying standard biplane reconstruction algorithms using the gantry information and pairwise epipolar constraints. After these centerlines are computed, their agreement with each other is optimized by iteratively adjusting the gantry information [20]. An average centerline is then obtained from the optimized 3D centerline information. The refinement minimizes differences between all pairwise-generated 3D centerlines and yields a smoother, more accurate, average centerline. Finally, a 3D model of the vessel phantom was rendered using the average centerline.
2.4. Procrustes Technique
The Procrustes technique [21, 22], when applied to the 3D centerline obtained from the MVR technique and 3D centerline obtained from the micro-CBCT with the segmentation technique, allows us to calculate the difference between both centerlines. The Procrustes technique gives us an accurate alignment of two centerlines by translating and rotating one of the centerlines until the best possible alignment is achieved. The accuracy of the result using this technique depends upon the similarity between the centerlines. With an equal number of points representing corresponding sections of the object for both centerlines, the root mean square (RMS) distance is obtained. The RMS distance is the measure of the similarity between the objects. Smaller RMS distance indicates better agreement between the centerlines.
3. DATA
3.1. Carotid Vessel Phantoms
The datasets were obtained using carotid vessel phantoms with various inner vessel diameters and curvatures. The phantoms have a diameter of 3.18 cm. The small diameter of the phantom enables the vessel to appear within the FOV of the MA throughout the 360° rotation. A cylindrical plastic housing and an acrylic plate were used to mold the phantoms. The plastic housing was cut in half and temporarily glued together so that it becomes easier to take it apart when the elastomer has set and the phantom is ready to use. A copper wire was inserted in the tubes to retain the desired shape of the tubes. After fixing the acrylic plate at the bottom and fixing the plastic tubing serving as vessel in the phantoms in a steady position, the silicon elastomer [23] was poured into the mold. The phantom was placed in a vacuum chamber at 10 mmHg pressure initially and then 15 mmHg for about 30 minutes to remove the air bubbles in the elastomer. The phantom was then left to cure for approximately 24 to 48 hours. Finally, when the elastomer is hardened and properly cured, the molds were taken apart, the copper wire was pulled out and the phantoms were ready to use. Iodine (RENO 60, 28% organically bound Iodine) was filled into the vessels of the phantoms as the contrast agent. Fig 1 shows one of the phantoms used for this study.
Figure 1.
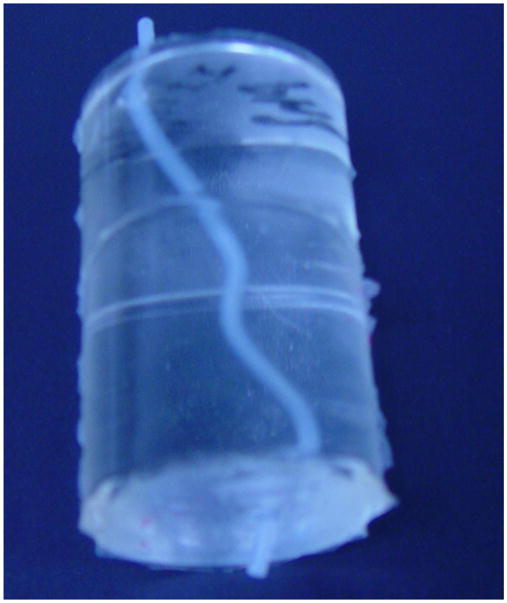
Sample of carotid vessel phantom
3.2. micro-CBCT data acquisition
The micro-CBCT machine is different from the conventional CT machine in the sense that in the conventional CT machine the object is kept stationary and the detectors and the source are rotated around the object, whereas in the micro-CBCT machine the source and the detector are kept stationary and the object is rotated using a rotary stage. The micro-CBCT machine is a custom-made machine that has the following components: an x-ray tube (Oxford instruments, Scotts Valley, CA), lead shutter, rotary stage (Velmex, Inc., Bloomfield, NY) and MA (Fig 2). The MA is a custom-made detector derived from a Model 4m4 CCD camera (Dalsa Corp., Waterloo, ON, CN) optically coupled to a CsI(Tl) input phosphor through a 1.8 to 1 minifying fiber optic taper [13]. The MA has pixel size of 45 μm and field of view (FOV) of 4.5 × 4.5 cm. The micro-CBCT data collection requires careful alignment of the tube, the phantom and the camera due to sensitivity of the Feldkamp algorithm that might create problems such as artifacts due to misalignments. Using a laser pointer and a level the camera was aligned with the tube. Then the images of a calibration phantom were used to bring the rotary stage axis into the center such that an object that is placed on the stage would appear in the center of the camera throughout the full rotation. After careful alignment of the tube with the center of the MA, we placed a carotid vessel phantom with contrast media on the rotary stage. Then the placement of the phantom on the rotary stage was also adjusted such that the phantom was in the center of the FOV. The x-ray tube is continuously activated during the acquisition, and hence a shutter was used to prevent the detector from being exposed during readout. The shutter consists of a sheet of lead moved into the path of the x-ray using an electric solenoid. The solenoid and the rotary stage are synchronized to ensure that the shutter opens only after the rotary stage is stationary. After an exposure, the rotary stage is indexed to obtain the next projection. All the components of the micro-CBCT machine were controlled by a LABVIEW program [24]. The dataset consists of 180 projections (every 2°) of the phantom obtained by the MA. To make a 3D model, we reconstructed the micro-CBCT data using a standard Feldkamp algorithm [14]. The 3D centerline of the micro-CBCT dataset is obtained using the segmentation technique previously described.
Figure 2.
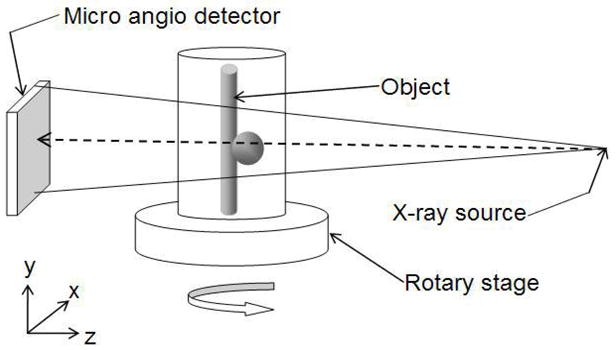
Micro-CBCT setup. The object is placed on the rotary stage. The source emits the cone beam. The image of the object at every angle is acquired by the MA detector.
3.3. MVR data acquisition
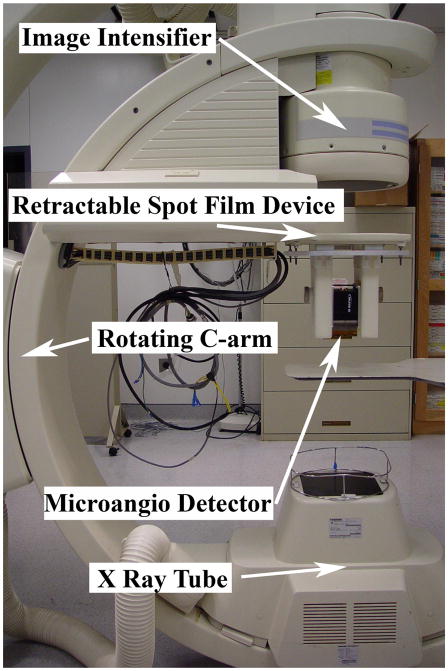
We obtained a few projections of the phantoms at 10° interval between angles of 60 LAO to 60 RAO using the x-ray unit (Model CAS-8000, Toshiba Medical Systems Corp., Tustin, CA) that contains the x-ray image intensifier (XII) detector system with the exposure of 70 kVp, 80 mA and 19 ms (Fig 3). The pixel size of the XII is 120 μm, and FOV is 4.5 in. The same projections were also obtained using the MA support system assembled on the x-ray unit [25]. The support system enables us the facility to obtain the projections at the same orientation using the XII and the MA, without moving the object and the source. From the dataset, combinations of three projections were chosen such that two of the projections were at least 60° apart from the common image. Finally, the MVRs for both, MA and XII, were compared to the full micro-CBCT reconstruction aligned using the Procrustes technique.
Figure 3.
C-arm x-ray unit on which the MVR dataset is obtained. When the high resolution MA images are required the retractable spot film changer (modified to deploy the MA) is extended and when the XII images are required it is retracted out of the way.
4. RESULTS AND DISCUSSION
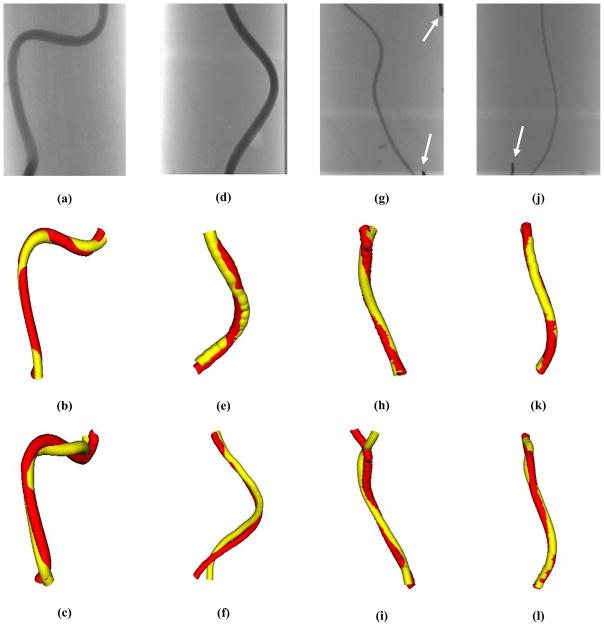
Comparison between the micro-CBCT reconstruction and the MVR technique allows us to evaluate the accuracy of the MVR technique. The 3D models of the phantoms were made using the centerlines obtained from the MVR technique as well as the micro-CBCT dataset. Fig 4 shows one of the MVR projections obtained by the MA as well as the resulting combined 3D model of the vessel phantoms from the MVRs and micro-CBCT. The white arrows in figs 4(g) and (j) are lead markers that were used to indicate the start and end points by the observer for indication. The red vessels in the combined 3D model renderings in fig 4 are obtained from micro-CBCT centerline, and the yellow vessels are obtained from the specified MVR centerline. Note that the displayed vessel diameters in the combined view are arbitrary. Also, since the FOV of the XII is bigger than the MA, it can image the entire phantom whereas the MA is made for small FOV imaging, so it does not image the entire phantom. Thus, the combined view of XII and micro-CBCT has more information towards the end of the vessel compared to the same for MA and micro-CBCT. The MVR agrees well with the micro-CBCT centerlines as shown in fig 4. The MA MVRs agree with the micro-CBCT much better than XII MVRs. The XII MVRs differ from the micro-CBCT especially towards the ends of the phantom. Moreover, the shape of the vessel is also deteriorated in the case of XII MVRs compared to the micro-CBCT as seen in fig 4(c) and 4(f). But, the shape of the vessel and agreement in the centerlines is much better in the case of the MA MVRs. Thus, it can be qualitatively concluded that the MVR gives accurate results. Also, MVRs using the MA are more accurate than those using the XII. To smooth the wrinkled 3D models, an 11 point moving average filter was applied. Some of the 3D models in fig 4 look smooth whereas some of them do not. This might be because indication errors and the algorithm itself because it does not use smooth spline fitting for the indicated centerline points.
Figure 4.
One of the MVR projection images are shown in (a) Phantom A, (d) Phantom B, (g) Phantom C and (j) Phantom D. The combined 3D model of MA MVR and micro-CBCT is shown in (d) Phantom A, (e) Phantom B, (h) Phantom C and (k) Phantom D. The combined 3D model of XII MVR and micro-CBCT is shown in (c) Phantom A, (f) Phantom B, (i) Phantom C and (l) Phantom D. The red vessel in all the combined images is 3D model obtained from micro-CBCT centerline. The yellow vessel in all the combined images is 3D model obtained from specified MVR centerline. The white arrows in (g) and (j) indicate lead markers that were used to represent the start and end points for the indication purposes in MVR technique.
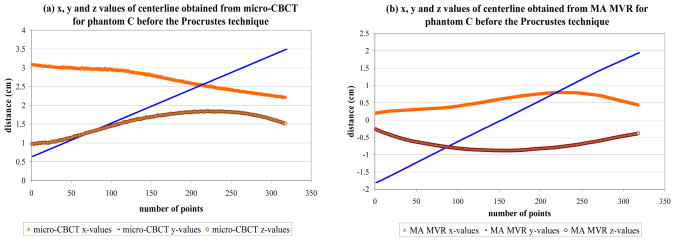
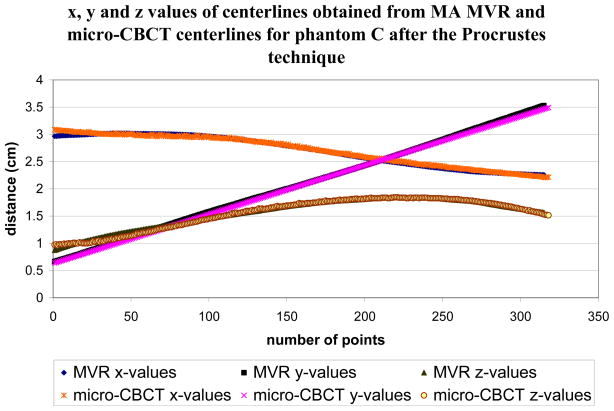
The Procrustes technique [21, 22] is used to register the vessel centerlines to quantitatively analyze the accuracy of the MVR. The two centerlines are first properly adjusted such that both cover the same part of the phantom. Interpolation of one of the centerlines is required to have the same number of points for both the centerlines. The centerlines obtained from the two techniques are not aligned initially as shown in fig 5. The micro-CBCT dataset is flipped and translated compared to the MVR dataset. This is because the orientation of the MA detector is not the same on the C-arm as in the micro-CBCT machine. The Procrustes technique is then used to optimally align the centerlines and then find the RMS distance between them. Fig 6 shows the alignment of the two centerlines after the Procrustes technique is applied. The x-axis in both the figures is the number of points that make up the centerline. The y-axis is the x, y, and z values of the 3D centerline as the distance from the axis of rotation in cm in figs 5 and 6.
Figure 5.
The x, y and z values before the Procrustes technique for phantom C using (a) micro-CBCT centerline and (b) MA MVR centerline
Figure 6.
The x, y and z values of the phantom C for both micro-CBCT and MA MVR centerlines after the Procrustes technique is applied.
The RMS distances for various phantoms are listed in Table 1. The percentage error is obtained by dividing the RMS distance with the corresponding known inner diameter of the vessel. The error as the percentage of the vessel size is relatively constant for MA MVRs for all of the phantoms. But, the percentage error is fluctuating for XII MVRs. Also, the accuracy of MA MVRs is consistently better for all the phantoms compared to the same for XII MVRs. The higher resolution of the MA compared to the largest magnification mode of the XII gives much better estimate of the vessel centerlines. This improvement is consistent with the previously demonstrated higher resolution for the MA [26] and the effect of higher resolution on accuracy for size determination of smaller vessels [27]. The percentage error for XII MVR for phantom C appears to be higher than the percentage error for phantom D. This may be the case because the two phantoms have different tortuosities. By visual comparison, phantom D has a less tortuous vessel than that for phantom C.
Table 1.
The RMS distance obtained from the Procrustes technique for MA MVR and XII MVR are listed for different phantoms with various inner diameter vessels. In column 4 and 6 the RMS distance is presented as a percentage of the corresponding inner diameter of the vessel.
| Phantom | Inner diameter (mm) | RMS distance for MA MVR (mm) | Percentage error for MA MVR | RMS distance for XII MVR (mm) | Percentage error for XII MVR |
|---|---|---|---|---|---|
| A | 3.75 | 0.086 | 2.3% | 0.141 | 3.8% |
| B | 2.3 | 0.095 | 4.1% | 0.134 | 5.8% |
| C | 1.26 | 0.040 | 3.2% | 0.116 | 9.2% |
| D | 0.75 | 0.029 | 3.9% | 0.048 | 6.4% |
The results imply that the MVR gives fairly accurate 3D centerlines of the vessel compared to the “gold standard” micro-CBCT. However, micro-CBCT required, in this study, 180 projections whereas the MVR only used 3 projections. The significant reduction in the number of projections required for the reconstruction yet with comparable accuracy gives the MVR an advantage. Also, since the number of projections is reduced, the time for reconstruction and dose are also reduced when using the MVR technique. The three projections can easily be obtained during the intervention. So, an accurate 3D model of the vessel may be obtained during the procedure using the MVR technique with an even greater accuracy obtained if an MA detector is used. There may be occasions, due to the physical spacing, between the imaging detector and the object, being limited when that a full dataset of 360° may not be possible. In this kind of situation, micro-CBCT may not be possible but the MVR technique may be done since it uses only 3 projections [25].
5. CONCLUSIONS
We have compared the MVR technique with the micro-CBCT reconstruction. The 3D centerlines obtained from the MVR and micro-CBCT agree to within 10% of the vessel size for vessel phantoms with various inner diameters. It may be concluded that the MVR technique gives reasonably good results and could replace the CBCT technique for 3D renderings of single vessels, which saves significant amounts of time and dose to the patient. The results of this technique could easily be available to the clinicians during the course of a procedure. Additionally the accuracy of the MVRs obtained from the MA suggest that this technique combined with high resolution MA detector may be highly beneficial in minimally invasive endovascular neurosurgery where only a small field of view with higher resolution is needed.
Acknowledgments
This work is supported in part by NIH grants R01-NS43924, R01-EB02873, R01-HL52567, R01-EB02916 and equipments from Toshiba Medical Systems Corp.
References
- 1.Metz CE, Fencil LE. Determination of three-dimensional structure in biplane radiography without prior knowledge of the relationship between the two views. Med Phys. 1989;16(1):45–51. doi: 10.1118/1.596401. [DOI] [PubMed] [Google Scholar]
- 2.Guggenheim N, Doriot PA, Dorsaz PA, Descouts P, Rutishauser W. Spatial reconstruction of coronary arteries from angiographic images. Physics in Medicine and Biology. 1991;36:99–110. doi: 10.1088/0031-9155/36/1/009. [DOI] [PubMed] [Google Scholar]
- 3.Wahle A, Wellnhofer E, Mugaragu I, Sauer HU, Oswald H, Fleck E. Assessment of diffuse coronary artery disease by quantitative analysis of coronary morphology based upon 3-D reconstruction from biplane angiograms. IEEE Transactions on Medical Imaging. 1995;14:230–241. doi: 10.1109/42.387704. [DOI] [PubMed] [Google Scholar]
- 4.Hoffmann KR, Metz CE, Chen Y. Determination of 3D imaging geometry and object configurations from two biplane views: an enhancement of the Metz-Fencil technique. Med Phys. 1995;22(8):1219–1227. doi: 10.1118/1.597559. [DOI] [PubMed] [Google Scholar]
- 5.Close R, Morioka C, Whiting JS. Automatic correction of biplane projection imaging geometry. Med Phys. 1996;23(1):133–139. doi: 10.1118/1.597789. [DOI] [PubMed] [Google Scholar]
- 6.Chen SYJ, Metz CE. Improved determination of biplane imaging geometry from two projection images and its application to three-dimensional reconstruction of coronary arterial trees. Med Phys. 1997;24(5):633–654. doi: 10.1118/1.598129. [DOI] [PubMed] [Google Scholar]
- 7.Muijtjens AMM, Roos JMA, Arts T, Hasman A. Maximum likelihood estimation in calibrating stereocamera setup. Med Phys. 1999;26(2):310–318. doi: 10.1118/1.598518. [DOI] [PubMed] [Google Scholar]
- 8.Cheriet F, Meunier J. Self-calibration of a biplane x-ray imaging system for an optimal three dimensional reconstruction. Computerized Med Imag and Graph. 1999;23:133–141. doi: 10.1016/s0895-6111(99)00006-3. [DOI] [PubMed] [Google Scholar]
- 9.Henri CJ, Peters TM. Three dimensional reconstruction of vascular trees: Theory and methodology. Med Phys. 1996;23(2):197–204. doi: 10.1118/1.597704. [DOI] [PubMed] [Google Scholar]
- 10.Henri CJ, Peters TM. Three-dimensional reconstruction of vascular trees: Experimental evaluation. Med Phys. 1996;23(5):617–627. doi: 10.1118/1.597815. [DOI] [PubMed] [Google Scholar]
- 11.Noël PB, Hoffmann KR, Walczak A, Dmochowski J. Registration of vascular 3D data sets obtained from multiple-view reconstructions. Proc CARS, International Congress Series. 2004;1268:329–334. [Google Scholar]
- 12.Rudin S, Wu Y, Kyprianou IS, Ionita CN, Wang Z, Ganguly A, Bednarek DR. Micro-angiographic detector with fluoroscopic capability. Proc SPIE, Medical Imaging: Physics of Medical Imaging. 2002;4682:344–354. [Google Scholar]
- 13.Ganguly A, Rudin S, Bednarek DR, Hoffmann KR, Kyprianou I. Micro angiography for Neurovascular Imaging, Part 1: Experimental Measurements and Feasibility. Med Phys. 2003;30(11):3018–3028. doi: 10.1118/1.1617549. [DOI] [PubMed] [Google Scholar]
- 14.Feldkamp LA, Davis LC, Kress JW. Practical cone-beam algorithm. J Opt Soc Am. 1984;A6:612–619. [Google Scholar]
- 15.Chityala RN. Master’s Thesis. Department of Mechanical and Aerospace Engineering, State University of New York; Buffalo: 2005. Self-calibration of Images for 3D Cone Beam Reconstruction. [Google Scholar]
- 16.Fiebich M, Tomiak MM, Engelmann RM, McGill J, Hoffmann KR. Computer Assisted Diagnosis in CT Angiography of Abdominal Aortic Aneurysms. Proc of SPIE, Medical Imaging: Image Processing. 1997;3034:86–94. [Google Scholar]
- 17.Pohle R, Toennies KD. Segmentation of medical images using adaptive region growing. Proc of SPIE, Medical Imaging: Image Processing. 2001;4322:1337–1346. [Google Scholar]
- 18.O’Brien JF, Ezquerra NF. Automated segmentation of coronary vessels in angiographic image sequences utilizing temporal, spatial structural constraints. Proc SPIE, Visualization in Biomedical Computing. 1994;2359:25–37. [Google Scholar]
- 19.Tranquebar RV. Master’s Thesis. Department of Electrical Engineering, State University of New York; Buffalo: 2005. Segmentation Techniques for the Extraction of Cranial Aneurysms. [Google Scholar]
- 20.Noël PB, Hoffmann KR, Walczak AM, Schaefer S, Hanel RA, Wehman JC, Levy E, Guterman L, Hopkins LN. Generating of 3D data during neurovascular interventions by using Multi-Projection. Imaging Proc CARS, International Congress Series. 2005;1281:334–338. [Google Scholar]
- 21.Schoeneman PH. A generalized solution of the orthogonal Procrustes problem. Psychometrika. 1996;31:1–10. [Google Scholar]
- 22.Hoffmann KR, Esthappan J. Determination of three-dimensional positions of known sparse objects from a single projection. Med Phys. 1997;24(4):555–64. doi: 10.1118/1.597938. [DOI] [PubMed] [Google Scholar]
- 23.Rangwala HS, Rudin S, Ionita CN. Image guided intervational phantom of the carotid siphon-cerebral aneurysm for simulation of catheter navigation and stent placement. Med Phys. 2004;30(6):1775. TU-C-317–5. [Google Scholar]
- 24.Ionita CN, Rudin S, Chityala RN, Dinu P, Kyprianou I, Hoffmann KR, Bednarek DR. LabView Algorithm for Control of Cone Beam Micro-CT system. Med Phys. 2004;31(6):1849. [Google Scholar]
- 25.Kuhls AT, Patel V, Ionita CN, Noël PB, Walczak AM, Rangwala HS, Hoffmann KR, Rudin S. New microangiography system development providing improved small vessel imaging, increased contrast to noise ratios, and multi-view 3D reconstructions. to be presented at SPIE, Medical Imaging; Feb. 2006; pp. 6142–131. [DOI] [PMC free article] [PubMed] [Google Scholar]
- 26.Yadava GK, Kyprianou IS, Rudin S, Bednarek DR, Hoffmann KR. Generalized performance evaluation of x-ray image intensifier compared with a microangiographic system. Proc of SPIE, Medical Imaging: Physics of Medical Imaging. 2005;5745:419. doi: 10.1117/12.594593. [DOI] [PMC free article] [PubMed] [Google Scholar]
- 27.Hoffmann KR, Dmochowski J, Nazareth DP, Miskolczi L, Nemes B, Gopal A, Wang Z, Rudin S, Bednarek DR. Vessel size measurements in angiograms: manual measurements. Med Phys. 2003;30(4):681–688. doi: 10.1118/1.1562491. [DOI] [PubMed] [Google Scholar]


