

Abstract
The adverse effects of chemotherapy on normal cells of the body create substantial clinical problems for many cancer patients. Relatively little is known, however, about the effects, other than promotion of cell death, of such agents on the function of normal precursor cells critical in tissue homeostasis and repair. We have combined mathematical and experimental analyses to identify the effects of sublethal doses of chemotherapy on glial precursor cells of the central nervous system (CNS). We modeled the temporal development of a population of precursor and terminally differentiated cells exposed to sublethal doses of carmustine (BCNU), a classical alkylating chemotherapeutic agent used in treatment of gliomas and non-Hodgkin’s lymphomas, as a multi-type age-dependent branching process. We fitted our model to data from in vitro clonal experiments using the method of pseudo-likelihood. This approach identifies several novel drug effects, including modification of the cell cycle length, the time between division and differentiation, and alteration in the probability of undergoing self-renewal division in precursor cells. These changes of precursor cell function in the chemotherapy-exposed brain may have profound clinical implications.
Major Findings
We applied our computational approach to analyze the effects of BCNU on clonal cultures of oligodendrocyte progenitor cells – one of the best-characterized neural progenitor cells in the mammalian brain. Our analysis reveals that transient exposures to BCNU increased the cell cycle length of progenitor cells and decreased their time to differentiation, while also decreasing the likelihood that they will undergo self-renewing divisions. By investigating the behavior of our mathematical model we demonstrate that precursor cell populations should recover spontaneously from transient modifications of the timing of division and of differentiation, but such recovery will not happen after alteration of cell fate. These studies identify means by which precursor cell function can be critically compromised by transient exposure to chemotherapy with long-term consequences on the progenitor cell pool even in the absence of drug-induced apoptosis. These analyses also provide novel tools that apply broadly to identify effects of chemotherapeutic agents and other physiological stressors.
Keywords: Cell proliferation, oligodendrocyte/type-2 astrocyte (O-2A) progenitor cell, oligodendrocyte precursor cell (OPC), oligodendrocytes, drug exposure, chemotherapy, BCNU, carmustine, cell differentiation, branching process, stochastic modeling, neurotoxicity
Quick Guide to Assumptions and Equations
Modeling cell kinetics in the absence of drug exposure
The mathematical model describes the evolution over time of the composition of clones originating from O-2A/OPCs. It considers the physiological potential of O-2A/OPCs to either divide into two O-2A/OPCs or differentiate into post-mitotic, terminally differentiated oligodendrocytes. Upon completion of its “lifespan” (referring either to the mitotic cycle duration, or to the time to differentiation calculated from the occurrence of the last cell division), an O-2A/OPC either divides into two O-2A/OPCs, or differentiates into a single oligodendrocyte. Death of O-2A/OPCs and of oligodendrocytes was not detected during our experiment, and was therefore omitted from the model. The events of division and differentiation are stochastic in nature, and the model assumes that they are governed by probabilities of division denoted by pk, possibly dependent on the cell generation k. The probability of differentiation is 1 − pk. The mitotic cycle duration and the time to differentiation of O-2A/OPCs are modeled by non-negative random variables τ1 and τ2 with possibly dissimilar distributions. In doing so, the model allows the time to division to be shorter (or longer) than the time to differentiation, as needed. As shown in Figure 1, the model considers the possibility for symmetric and asymmetric cell division by allowing daughter cells to have identical or distinct developmental fates.
Figure 1.

Model structure in the absence of drug exposure (left panel) and a description of the possible effects of drug exposures (right panel). F(t) and G(t) denote the c.d.f.s for the time to division and for the time to differentiation of progenitor cells; pk denotes the probability of division of any generation-k progenitor.
Modeling cell kinetics in the presence of drug exposure
Drug exposure at sublethal doses may alter the fate of O-2A/OPCs as follows: (1) The fate of O-2A/OPCs changes; e.g., an O-2A/OPC that would have divided, if it had not been exposed to the drug, differentiates into an oligodendrocyte; (2) the time to differentiation of O-2A/OPCs decreases (or increases), thereby accelerating (or delaying) the generation of oligodendrocytes; (3) the time to division of O-2A/OPCs increases or decreases, causing the generation of new O-2A/OPCs to be delayed or accelerated. These parameters may change in concert. After the drug is washed out, residual drug effects may persist in subsequent, non-directly exposed progenies.
Introduction
Treatment of cancer with chemotherapy is associated with a wide range of adverse side effects, which may affect the normal dividing cell populations of multiple organ systems, including the hematopoietic system and brain. Dose-limiting toxicities are frequently seen in tissues that contain dividing precursor cells (a term used here to include both tissue-specific stem cells and the lineage-committed progenitor cells they generate as intermediates in the production of differentiated cell types).
While toxicity of chemotherapy may be seen both as acute and chronic complications, the alterations in cellular function (other than cell death) resulting in long-term and delayed adverse effects are poorly understood. For instance, the promotion of differentiation of dividing precursor cells into non-dividing differentiated cells provides a non-lethal means of reducing the number of precursor cells available for tissue homeostasis or repair. Still another means by which dividing precursor cells may be reduced in number would be if exposure to chemotherapeutic agents induced a non-productive mitotic arrest, such that the cells neither divide nor differentiate.
Clonal analysis offers the most powerful means of analyzing the behavior of precursor cells in respect to division and differentiation and offers an ideal platform to mathematically analyze these biological processes. One of the cell types most suitable for analyzing the sublethal effects of chemotherapy on alterations of precursor cell function is the oligodendrocyte-type-2 astrocyte progenitor cell (also referred to as oligodendrocyte precursor cell, and here abbreviated as an O-2A/OPC). This cell is the immediate ancestor of the myelin-forming oligodendrocytes of the CNS. Damage to myelinated regions of the CNS presenting as radiographic leukoencephalopathy may be seen in patients treated with systemic chemotherapy (1–4). We have recently shown that O-2A/OPCs themselves are vulnerable to multiple chemotherapeutic agents, including BCNU, cisplatin, cytosine arabinoside (Ara-C), and 5-fluorouracil (5,6). O-2A/OPCs have proven useful to investigate subtle changes in division and differentiation due to the ability to analyze these functions over time in single clones of these cells. Such clonal analysis has provided the basis for the analysis of multiple modulators of division and differentiation, including signaling molecules, inhibitors of cyclin-dependent kinases and alterations in intracellular redox balance (7–19). Moreover, O-2A/OPCs are one of the few precursor cell populations that have been successfully used in the development of mathematical approaches to the quantitative analysis of division and differentiation (20–31).
To better understand the effects of chemotherapy on precursor cell function in normal cell populations, we developed a computational approach that quantifies effects of transient drug exposures on clones of precursor cells. Our mathematical model is a multi-type age-dependent branching process (32–34), which describes the evolution over time of clones of O-2A/OPCs and of oligodendrocytes. It allows analysis of such properties as cell fate, cell cycle length, and duration between the final cell cycle and the occurrence of overt differentiation. It also considers possible alterations induced by drug exposures in the timing of division and of differentiation, and in the probability of self-renewing division. This approach was applied to investigate alterations of the division and differentiation of O-2A/OPCs following exposure to BCNU. The analysis demonstrates that transient exposure to sublethal concentrations of BCNU compromises the capacity of O-2A/OPCs for continued cell division while promoting their premature differentiation into non-dividing oligodendrocytes, thereby leading to the generation of fewer total progeny from each individual clonal founder cell. In addition, we analyzed drug effects in regard to how changes in parameter values (e.g., the probability of division or the timing of division and of differentiation) influence the behavior of the mathematical model. Our investigations suggest, for instance, that a small reduction in the probability of division induced by transient exposure to BCNU may change dramatically the composition of the population that does not spontaneously restore normal cell numbers after chemotherapy is completed.
Materials and Methods
Clonal experiments on oligodendrocyte generation
All experiments were conducted by growing O-2A/OPCs at clonal densities in tissue culture flasks as previously described (5,10,12,15). O-2A/OPCs generate clones of cells that can be individually examined for their composition. The O-2A/OPC lineage is ideally suitable for such analysis, as changes in cell morphology are tightly correlated with changes in their antigenic profile, allowing identification of their state of differentiation with >98% accuracy using a microscope (10–16). One day after plating, half of the cultures were transiently exposed to 1 μM BCNU for 1 h (to reflect the half-life of BCNU in vivo (35,36)). This dose did not result in significant cell death (<5% reduction in number of viable cells) of O-2A/OPCs in mass culture. This level of exposure is at least 90% lower than the 8–10μM concentrations of BCNU reported to be achieved in the CNS with low-dose exposures in vivo (36,37). BCNU was washed out and clones were followed daily. Control flasks were treated similarly, but in the absence of BCNU. Every day from day 2 to day 7, the composition of 100 clones (50 controls and 50 treated) was analyzed by morphological examination, yielding a total of 600 independent observations (each observation provided the numbers of O-2A/OPCs and of oligodendrocytes counted in a same clone using a microscope).
Branching process models of dividing and differentiating O-2A/OPCs
One of the primary challenges in studying subtle aspects of progenitor cell function is that time-lapse microscopy, the most sensitive technique, requires costly instrumentation, only allows limited numbers of clones to be studied, and cannot be applied in vivo. In contrast, clonal analysis can be conducted so as to obtain larger amounts of data at low cost, and can even be used to study differentiation in vivo (38). The problem with clonal analysis, however, is that the events of division and differentiation of progenitor cells and their alteration by exposures to a chemotherapeutic agent are not directly observable. To address this problem, we developed a branching process model of the generation of clonal families of O-2A/OPCs, which is defined by the following assumptions (see also Figure 1).
(A) Model assumptions under normal conditions
A1. The process begins at time t= 0 with a single progenitor cell of generation 1. Every progenitor cell of generation k ≥ 1 either divides into two progenitor cells of generation k+1 with probability pk, or it differentiates into a single oligodendrocyte with probability 1 − pk. In our analyses we set
where (η0, η1) are free parameters. The probability of division decreases with the generation whenever η1 > 0, and increases otherwise (29).
A2. The mitotic cycle duration (referred to below as the time to division) of any progenitor cell was modeled as a non-negative random variable with cumulative distribution function (c.d.f.) F(·), whereas their time to differentiation (calculated from the time of last cell division) was modeled as a non-negative random variable with c.d.f. G(·). Based on past studies (27,29,30), these two distributions were allowed to be dissimilar, so the time to division could be stochastically shorter/longer than the time to differentiation, if needed. Both distributions were assumed not to change with generation (8,29), and were taken from the family of two-parameter gamma distributions. Write μ1 and (resp. μ2 and ) for the mean and variance of the time to division (resp. differentiation).
A3. The traditional independence assumptions for branching processes are adopted (32–34). Time-lapse experiments (29) suggested that significant correlation might exist between the time to division of sister cells. However such dependencies have little effect on the behavior of branching processes, and, for instance, do not affect the expected cell counts (39–41).
The expected numbers of O-2A/OPCs and oligodendrocytes at time t under assumptions (A1–A3) are given by
where denotes the convolution of F(t) and G(t), and where F*k+1(t) = F*k*F(t) stands for the k-fold convolution of F(·). Expressions for variances of cell numbers are more complicated, but can also be derived (30).
(B) Model assumptions under drug exposure
To describe the temporal development of clones transiently exposed to a sub-lethal dose of drug we account for the possible changes that a drug may induce on the fate of O-2A/OPCs and on the timing of their division and of their differentiation (Figure 1b). Although the model presented below considers only the case of a drug that induces differentiation of O-2A/OPCs into oligodendrocytes (such as BCNU), alternative models could be similarly developed for when drug exposure promotes self-renewal division.
B1. The process begins at time t= 0 with a single progenitor cell of generation 1.
B2. Every cell that completes its lifespan prior to the time of drug exposure obeys assumptions (A1-A3).
B3. Every cell exposed to the drug before dividing or differentiating is subject to changes defined by the following assumptions, which rely on an experimental observation that BCNU causes O2A/OPCs to differentiate (5,6).
-
(i) An O-2A/OPC that intended to divide before being exposed to the drug will change its fate with probability q, and differentiate into an oligodendrocyte instead of dividing. In such circumstances, the time to differentiation calculated from the time of drug exposure is modeled by a non-negative random variable with c.d.f. Gtreated (·), assumed gamma with mean μtreated and variance . In contrast, if the cell fate does not change, the duration between drug exposure and the cell division is reduced/increased by a factor φ relative to how long this duration would have been if the cell had not been exposed to the drug.
(ii) An O-2A/OPC that intended to differentiate into an oligodendrocyte before drug exposure will not change its fate. However, the duration between the time of drug exposure and the time of differentiation may be altered, and this duration is reduced/increased by a factor ρ relative to how long it would have been if the cell had not been exposed to the drug.
B4. O2A/OPCs born after drug exposure obey assumptions (A1-A3), except that
-
(iii) Their probability of division may differ from those of O-2A/OPCs that proliferate in untreated clones. Denoting by qk the probability of division of generation-k O-2A/OPCs born after the time of drug exposure we set
where α is a free parameter capturing an increase (α > 1) or a reduction (α < 1) in the probability of division of O-2A/OPCs post-exposure, and quantifying a residual effect of chemotherapy.
The times to division and the times to differentiation differ from those of O-2A/OPCs that proliferate in untreated clones by constant factors ρ and φ. We therefore assumed that the times to division and the times to differentiation were gamma distributed with means and variancesAssumption (B4) has not yet been supported by any experimental studies, and one goal of our studies will be to test it.
B5. Same assumption as A3.
The model parameters, including the means and variances of the time to division and of the time to differentiation, the probability of division, as well as parameters describing the effects of the drug, were estimated using the method of simulated pseudo-maximum likelihood (27,28,30,31) (see also Supplementary Materials). Their standard errors were computed using the method of Bootstrap (42)
Results
Experimental results
The evolution over time of clonal compositions in control and treated groups were significantly different (Figure 2), suggesting that BCNU was able to disrupt the processes of division and differentiation of O-2A/OPCs. Transient BCNU exposure reduced the number of progenitors per clone, and increased the number of oligodendrocytes shortly after drug exposure. Over time, however, the mean number of oligodendrocytes increased faster in untreated than in treated clones. These results could occur for multiple reasons. One possibility is that BCNU increased the probability that O-2A/OPCs will exit the cell cycle and differentiate into oligodendrocytes. It is also possible that drug exposure lengthened the cell cycle time (such that treated cells divided later), or that the period of time between the final cell division and differentiation into an oligodendrocyte was shortened. These alterations in precursor functions also could happen in combination.
Figure 2.
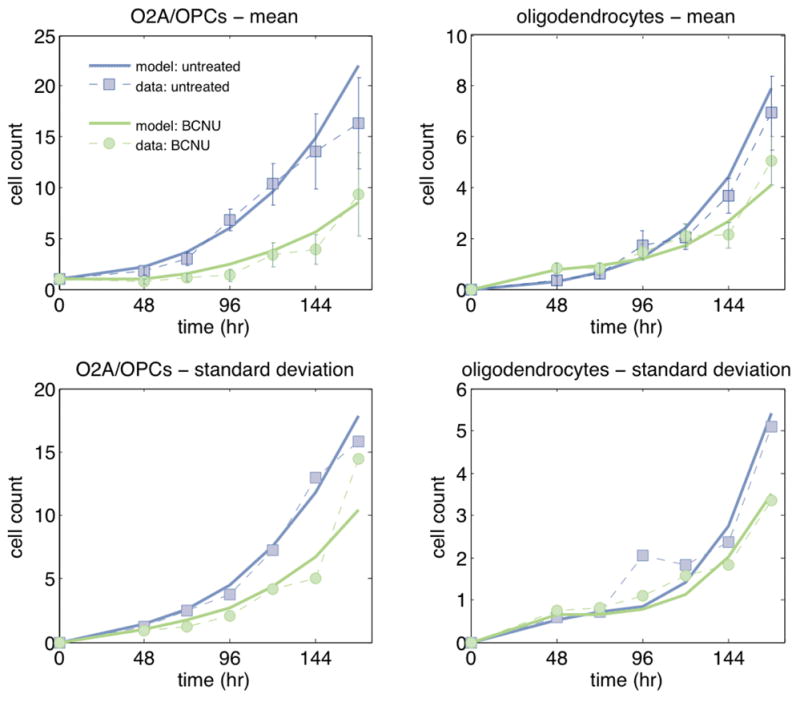
Mean (top) and standard deviation (bottom) of the number of O-2A/OPCs (left) and of the number of oligodendrocytes (right) per clone over time in untreated (blue) and BCNU-treated (green) clones. Experimental means and standard deviations (each computed using 50 replicates) are shown as dashed lines; the fitted model is displayed as solid lines. Error bars indicate ±2SEM.
Model-based analysis of in vitro data
Using our mathematical model we investigated the effects of BCNU on the clonal compositions. The resulting parameter estimates and their standard errors are shown in Table 1.
Table 1.
Parameter estimates (and associated standard errors).
| In the absence of drug exposure | ||||
|---|---|---|---|---|
| time to divison | μ1 (hr) | 25.5 (0.8) | σ1 (hr) | 10.8 (0.3) |
| time to differentiation | μ2 (hr) | 24.9 (2.8) | σ2 (hr) | 4.5 (0.5) |
| probability of division | η0 | −1.66 (0.08) | η1 | 0.07 (0.02) |
|
During exposure to BCNU | ||||
| time to differentiation when cell fate changes | μtreated (hr) | 1.7 (0.6) | σtreated (hr) | 1.9 (0.4) |
| fold-change in time to division when cell fate does not change | ρ | 2.5 (0.3) | ||
| fold-change in time to differentiation when cell fate does not change | φ | 0.85 (0.13) | ||
| probability of change in cell fate (differentiation instead of division) | q | 0.64 (0.04) | ||
|
Following exposure to BCNU (that is, after washing out the drug) | ||||
| fold-change in time to division | ρpost | 0.98 (0.05) | ||
| fold-change in time to differentiation | φpost | 0.71 (0.03) | ||
| fold-change in probability of division | α | 1.01 (0.03) | ||
Untreated clones
The mean time to division of O-2A/OPCs (defined as the average time separating two successive cell divisions) in untreated clones was estimated as 25.5±10.8 hours (mean±standard deviation), consistent with past analyses (29). The time to differentiation of untreated O-2A/OPCs lasted 24.9± 4.5 hours, suggesting that the times required for O-2A/OPCs to divide or to differentiate into oligodendrocytes were on average virtually identical. The probability of division of O-2A/OPCs decreased with each generation, but only slightly: the probability of division of founder cells was close to 0.83, and decreased to ~0.75 after 7 divisions. These estimates were higher than those previously reported (24–29); the larger numbers of O-2A/OPCs per clone observed in the present experiment support this difference.
BCNU-treated clones
Drug exposure appeared to alter cell proliferation and differentiation in multiple ways. Firstly, BCNU exposure increased the time to division in O-2A/OPCs. We estimated that the residual mitotic cycle duration (defined as the duration between the time of drug exposure and the time at which the cell divides) was on average 2.5 times longer in O-2A/OPCs directly exposed to BCNU during their lifespan (that is, before washing out the drug) than in O-2A/OPCs of untreated clones (40 vs. 16 hours). In contrast with the lengthening of cell cycle time in progenitor cells exposed to BCNU, our analysis indicated that the residual time to differentiation (the duration between drug exposure and the time at which the cell differentiates) was only slightly shorter in O-2A/OPCs exposed to BCNU (11 vs. 13 hours). The analysis suggested also that BCNU exposure altered the balance between self-renewal of O-2A/OPC’s and their differentiation into oligodendrocytes by reducing the probability of division, thereby inducing differentiation of progenitor cells into oligodendrocytes. Specifically, about 36% of the O-2A/OPCs that otherwise would have divided before drug exposure now underwent differentiation.
Once BCNU was washed out, the cell cycle length and the probabilities of division returned to the values displayed by untreated cells. The time to differentiation of O-2A/OPCs generated post-exposure, however, was estimated as 30% shorter on average in treated than in untreated clones (~17.4 vs. ~ 24.9 hours). Thus, with the potential exception of the time to differentiation, transient exposure to BCNU did not cause impairments in progenitor cell function that were passed on to the next generation of progenitor cells. Note that the estimated difference in the mean time to differentiation induced only small changes in the numbers of O-2A/OPCs and of oligodendrocytes.
Model-based predictions
Stationary conditions
Under normal conditions, a stationary population of precursor and terminally differentiated cells is thought to regulate its balance by letting precursor cells divide or differentiate in equal frequency (e.g., by means of asymmetric division). Our branching process achieves “stationarity” if the probability of division is set to pk = 1/2, in which case the model is said to be critical. The mean number of precursor cells at any time t generated by any precursor cell born at time 0 reduces to
and converges to
| (1) |
as t→∞ (see Supplementary Materials), where μF = ∫ x · dF(x) and μG = ∫ x · dG(x) denote the mean time to division and the mean time to differentiation of precursor cells. It is worth noting that the mean number of precursor cells will stabilize around 1 only if the mean time to division and the mean time to differentiation are identical (that is, μF = μG); otherwise it will increase to a value different from 1 (>1 when μF >μG, and conversely when μF<μG), even though every precursor cell generates on average one precursor cell. Therefore, by modifying only μF and μG, and leaving unchanged the probability of division, one can modulate the limiting value , which may fall anywhere in (1/2;∞). For instance, with a mitotic cycle duration twice as long as the time to differentiation, the mean number of precursor cells approaches as t increases.
The stability of a stationary precursor cell population may be disrupted either by changing the probability of division to a value p different than 1/2 or by altering the timing of division and/or differentiation of precursor cells. Using numerical investigations, we evaluated the effects of hypothetical drug exposures on the population size when these effects persist over time and when they are transient.
The effects of drug exposure on the probability of division and the timing of division/differentiation persist over time either because they are passed to cells of subsequent generations at division, or because drug exposure lasts an extended period of time.
If the change in the probability of division persists over time, the pools of precursor cells and of terminally differentiated cells will gradually deplete if p<1/2, whereas both populations will expand if p>1/2 (Figure 3). Small changes in the probability of division can dramatically affect the population size. For instance, 10 post-exposure, the average number of precursor cells decreases by almost 20% by lowering the probability of division from 0.50 to 0.49.
Figure 3.

This figure shows the percent change in precursor cell numbers during drug exposure (started at t= 0) relative to absence of exposure as a function of time. The calculations assumed a branching process model of a population of precursor and terminally differentiated cells in which, in the absence of drug exposure: (a) the events of division and of differentiation are equally likely for every precursor cell; (b) the times to division and the times to differentiation of precursor cells are identically distributed, exponential with mean 24 hours. The calculations assumed further that drug exposure changed either the probability of division (p; left), or the mean time to division (μ; middle), or the mean time to differentiation (μ2; right).
If the mean time to division and/or the mean time to differentiation remain altered for an extended time period, the number of precursor cells will either increase or decrease, and converge to a value determined by equation (1), with μF and μG replaced by their altered values (Figure 3). For example, if the mean time to division and the mean time to differentiation were identical before drug exposure, and if drug exposure resulted in a 2.5 fold increase in the mean time to division and a 0.85-fold decrease in the mean time to differentiation (as estimated using clonal experiments), the number of precursor cells would become 33% smaller than under normal conditions (where 0.33= (mnormal − mtreated)/mnormal, with mnormal = 1 and mtreated = (2.5+ 0.85)/(2× 2.5)). Thus, the population would stabilize again, but to a level lower than the one existing prior to drug exposure.
When the probability of division and the timing of division and of differentiation are transiently altered, so that these parameters eventually return to their pre-exposure values (as appeared to be the case for BCNU), the temporal behavior of the number of precursor cells will depend on the type of changes induced by the drug. If the drug alters only the timing of division and/or of differentiation for a limited time period, the asymptotic mean number of cells will still obey equation (1), such that the population will spontaneously recover over time and return to its original size, thereby leaving ultimately no sign of a drug exposure on the population size. In contrast, if drug exposure modulates transiently the probability of division such that precursor cells may change their fate (e.g., differentiate instead of divide), the population size will stop decreasing or increasing after drug removal but will not return to its pre-exposure level, making drug effects permanent, unless a therapeutic intervention is used.
Therapeutic strategies
Therapeutic interventions modulating the probability of division of precursor cells and/or the timing of their division/differentiation could be developed to restore impaired neural populations. As shown in Figure 4, the benefit of an intervention obtained by altering the timing of division and/or of differentiation endures only while therapy is maintained. Once therapy is interrupted so that the mean time to division and the mean time to differentiation become identical to those existing pre-therapy, the population size will return to its pre-intervention level as if no therapy had ever been used. Thus, the gains in cell number attributable to changes in the timing of division/differentiation would offer no long-term benefits. This phenomenon follows from identity (1), which states that the long-term mean number of cells is solely determined by the mean time to division and the mean time to differentiation of precursor cells. In contrast, therapies modulating the probability of division will have long-lasting benefits; that is, once the intervention is stopped, cell gains will persist. Small increases in the probability of division may result in a rapid recovery of the cell population.
Figure 4.
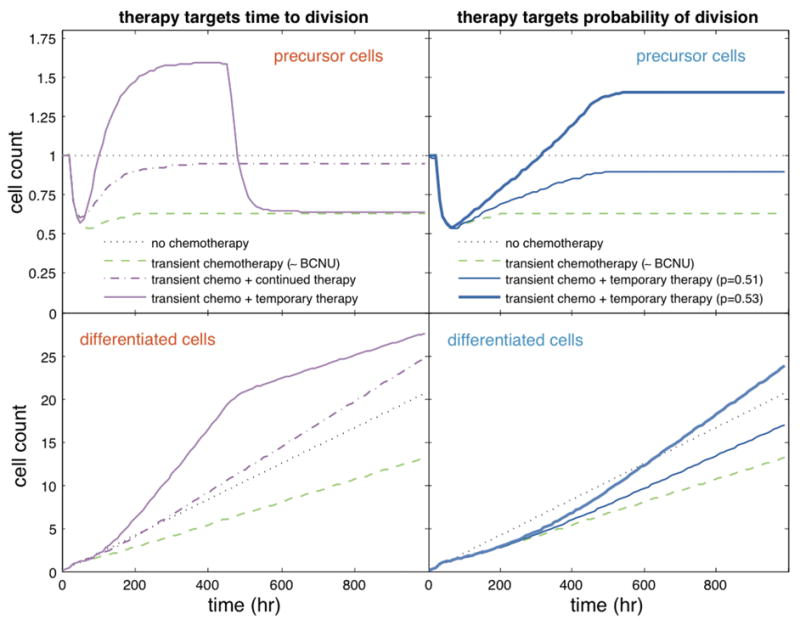
This figure shows the mean number of precursor cells (top) and terminally differentiated cells (bottom) under normal conditions (•••); after transient exposure to chemotherapy at 24 hours and without intervention (−•); after transient exposure to chemotherapy at 24 hours and a therapeutic intervention (e.g., growth factor application to enhance neural progenitor cell proliferation or other neuroprotective agents) started at 48 hours (--); after transient exposure to chemotherapy at 24 hours and to therapeutic intervention between 48 and 450 hours (−). Chemotherapy was assumed to transiently reduce the probability of division by 36%, increase the time to completion of division by 2.5, and reduce the time to differentiation by 0.85 (as estimated for BCNU using our clonal data). Left panels: intervention decreases the mean time to division: continued 2-fold decrease (−); temporary 4-fold decrease (--). Right panels: the intervention increases only the probability of division from 0.5 to 0.51 or 0.53. The parameter values and time scale used in these simulations were selected arbitrarily.
Discussion
Our present studies reveal that a single transient exposure of O-2A/OPCs to levels of BCNU equivalent to 10–15% of that achieved in low dose clinical applications was sufficient to alter several parameters of progenitor cell function. These changes include lengthening of the cell cycle, shortening of the time between final division and differentiation, and a reduction in the probability that a progenitor cell will undergo self-renewing division. Although effects on cell cycle time and probability of the occurrence of a self-renewing division were only seen in progenitors to BCNU, the effects of these changes on clonal composition became larger over time. Moreover, transient exposure resulted in smaller clones, a lesser proportion of progenitor cells per clone, and ultimately a reduction in the total number of oligodendrocytes in clones.
Although it is well recognized that exposure to chemotherapy can damage multiple tissues of the body, there appears to be no prior information on the ability of chemotherapeutic agents to alter cell cycle length, time to differentiation or probability of self-renewal in dividing precursor cells. Moreover, our studies appear to provide the first demonstration that cell cycle length and the time between final division and differentiation can be changed in opposite directions. While induction of cell death is one means of reducing the numbers of precursor cells available for normal tissue maintenance or repair, such reductions can also come about, for instance, by disrupting the normal balance between self-renewing division and differentiation into non-dividing progeny. It is also possible to reduce new cell generation simply by increasing the cell cycle-length of a dividing progenitor cell, so that fewer cells are generated within any given time period.
It was of particular interest that the transient perturbations in cell cycle length and probability of differentiation lead to changes in clonal composition that become more pronounced over time. There is little understanding of the processes that lead to the appearance of neurological and/or pathological changes weeks or months after chemotherapy has been completed. Due to the importance of precursor cells in normal tissue homeostasis, small perturbations during drug exposure can have effects that are observed more clearly at later time points. This phenomenon indicates that sublethal disruption of precursor cell function needs to be analyzed in a manner that reflects the cumulative nature of developmental and homeostatic processes. Numerical investigations (Figure 4) suggested that drugs altering normal precursor cells could have rapidly occurring effects. Drug effects in vivo are often detected at delayed time points because cell turnover is likely to be slower in vivo than in vitro, and also because endpoints observed during in vivo studies differ from those considered in our in vitro experiments and numerical simulations. Recent studies support the concept that there is substantial contribution of new oligodendrocytes to myelinated tracts throughout life (43). Together with findings that oligodendrocytes themselves are highly vulnerable to multiple chemotherapeutic agents (5,6), reductions in the progenitor cell pool caused even by increasing the probability of differentiation during the time of drug exposure could limit efficacy of subsequent repair/homeostasis by reducing the total number of available progenitors. Analysis of the effects of higher drug levels of BCNU in vivo revealed a transient increase in cell death, but a long-lasting reduction in the number of dividing oligodendrocyte progenitor cells (5), suggesting that this population does not become replenished in vivo.
The results derived from our stochastic model offer possible explanations of the long-lasting effects of chemotherapy on normal cells of the CNS that have been observed in both clinical studies and animal models of neurotoxicity. We found that small changes in self-renewal probability can severely reduce the number of cells within a relatively short period of time, even in situations in which it seems that the effects of the chemotherapeutic agent on precursor cell function do not persist once drug exposure is terminated. Even if precursor cell functions were to return to their normal values after drug exposure, our simulations demonstrate that this would not be sufficient to promote recovery of cell number. As cell division in the CNS remains at reduced levels for prolonged periods after cessation of treatment with BCNU, cisplatin, 5-FU and cytarabine (5,6), this would further compromise normal repair and/or homeostasis.
Cell kinetics may be impacted by the microenvironment, contact inhibition, or any other feedback mechanisms, the potential contributions of which were not explicitly described by our model. For instance, contact inhibition may likely promote cell renewal when cell density decreases, and vice versa when the density increases. Our past studies, including time-lapse experiments (29), did not, however, support any association between cell density and cell cycle length in vitro. The role played by these mechanisms in the damaged CNS of cancer patients remains unclear. Although not comprehensive, our model was still useful in studying the potential effects of chemotherapy on precursor cells of the CNS in vivo, and in deciphering the consequences of (e.g.) a simple modulation of the time to division or of the time to differentiation. Additional studies should be conducted to assess the broader applicability of our conclusions.
The discovery of chemotherapeutic agents with limited toxicity for the normal cells of the organism is one of the central challenges in the field of cancer treatment. The approaches provided by our present studies offer highly sensitive means of examining subtle adverse effects. Moreover, the principles that underlie these quantitative approaches are sufficiently general as to make them applicable to the analysis of any cellular perturbation that alters cell division or differentiation.
Supplementary Material
Acknowledgments
This work is supported by NIH Grants R01-CA134839, R01-NS39511, P30-ES001247, and NS44701. JD is a recipient of the Paul Calabresi Career Development Award for Clinical Oncology (NIH-K12) and the Stephen E. and Catherine Pappas Foundation Award for Brain Tumor Research.
References
- 1.Brown MS, Stemmer SM, Simon JH, et al. White matter disease induced by high-dose chemotherapy: longitudinal study with MR imaging and proton spectroscopy. AJNR Am J Neuroradiol. 1998;19:217–21. [PMC free article] [PubMed] [Google Scholar]
- 2.Keime-Guibert F, Napolitano M, Delattre JY. Neurological complications of radiotherapy and chemotherapy. J Neurol. 1998;245:695–708. doi: 10.1007/s004150050271. [DOI] [PubMed] [Google Scholar]
- 3.Macdonald DR. Neurologic complications of chemotherapy. Neurol Clin. 1991;9:955–67. [PubMed] [Google Scholar]
- 4.Stemmer SM, Stears JC, Burton BS, Jones RB, Simon JH. White matter changes in patients with breast cancer treated with high-dose chemotherapy and autologous bone marrow support. AJNR Am J Neuroradiol. 1994;15:1267–73. [PMC free article] [PubMed] [Google Scholar]
- 5.Dietrich J, Han R, Yang Y, Mayer-Pröschel M, Noble M. CNS progenitor cells and oligodendrocytes are targets of chemotherapeutic agents in vitro and in vivo. J Biol. 2006;5:22. doi: 10.1186/jbiol50. [DOI] [PMC free article] [PubMed] [Google Scholar]
- 6.Han R, Yang YM, Dietrich J, Luebke A, Mayer-Pröschel M, Noble M. Systemic 5-fluorouracil treatment causes a syndrome of delayed myelin destruction in the central nervous system. J Biol. 2008;7:12. doi: 10.1186/jbiol69. [DOI] [PMC free article] [PubMed] [Google Scholar]
- 7.Durand B, Fero M, Roberts J, Raff M. p27Kip1 alters the response of cells to mitogen and is part of a cell-intrinsic timer that arrests the cell cycle and initiates differentiation. Curr Biol. 1998;6:431–40. doi: 10.1016/s0960-9822(98)70177-0. [DOI] [PubMed] [Google Scholar]
- 8.Gao F, Apperly J, Raff M. Cell-intrinsic timers and thyroid hormone regulate the probability of cell-cycle withdrawal and differentiation of oligodendrocyte precursor cells. Dev Biol. 1998;197:54–66. doi: 10.1006/dbio.1998.8877. [DOI] [PubMed] [Google Scholar]
- 9.Gao F, Durand B, Raff M. Oligodendrocyte precursor cells count time but not cell divisions before differentiation. Curr Biol. 1997;7:152–5. doi: 10.1016/s0960-9822(06)00060-1. [DOI] [PubMed] [Google Scholar]
- 10.Ibarrola N, Mayer-Proschel M, Rodriguez-Pena A, Noble M. Evidence for the existence of at least two timing mechanisms that contribute to oligodendrocyte generation in vitro. Dev Biol. 1996;180:1–21. doi: 10.1006/dbio.1996.0280. [DOI] [PubMed] [Google Scholar]
- 11.Noble M, Murray K, Stroobant P, Waterfield MD, Riddle P. Platelet-derived growth factor promotes division and motility and inhibits premature differentiation of the oligodendrocyte/type-2 astrocyte progenitor cell. Nature. 1988;333:560–2. doi: 10.1038/333560a0. [DOI] [PubMed] [Google Scholar]
- 12.Power J, Mayer-Proschel M, Smith J, Noble M. Oligodendrocyte precursor cells from different brain regions express divergent properties consistent with the differing time courses of myelination in these regions. Developmental Biology. 2002;245:362–75. doi: 10.1006/dbio.2002.0610. [DOI] [PubMed] [Google Scholar]
- 13.Raff MC, Lillien LE, Richardson WD, Burne JF, Noble MD. Platelet-derived growth factor from astrocytes drives the clock that times oligodendrocyte development in culture. Nature. 1988;333:562–565. doi: 10.1038/333562a0. [DOI] [PubMed] [Google Scholar]
- 14.Small RK, Riddle P, Noble M. Evidence for migration of oligodendrocyte-type-2 astrocyte progenitor cells into the developing rat optic nerve. Nature. 1987;328:155–7. doi: 10.1038/328155a0. [DOI] [PubMed] [Google Scholar]
- 15.Smith J, Ladi E, Mayer-Pröschel M, Noble M. Redox state is a central modulator of the balance between self-renewal and differentiation in a dividing glial precursor cell. Proc Natl Acad Sci USA. 2000;97:10032–37. doi: 10.1073/pnas.170209797. [DOI] [PMC free article] [PubMed] [Google Scholar]
- 16.Temple S. Division and differentiation of isolated CNS blast cells in microculture. Nature. 1989;340:471–3. doi: 10.1038/340471a0. [DOI] [PubMed] [Google Scholar]
- 17.Tokumoto YM, Applerly JA, Gao F-B, Raff MC. Postranscriptional regulation of p18 and p27 Cdk inhibitor proteins and the timing of oligodendrocyte differentiation. Dev Biol. 2002;245:224–234. doi: 10.1006/dbio.2002.0626. [DOI] [PubMed] [Google Scholar]
- 18.Tokumoto YM, Tang DG, Raff MC. Two molecularly distinct intracellular pathways to oligodendrocyte differentiation: role of a p53 family protein. EMBO J. 2001;20:5261–8. doi: 10.1093/emboj/20.18.5261. [DOI] [PMC free article] [PubMed] [Google Scholar]
- 19.Tokumoto YM, Durand B, Raff MC. An analysis of the early events when oligodendrocyte precursor cells are triggered to differentiate by thyroid hormone, retinoic acid, or PDGF withdrawal. Dev Biol. 1999;213:327–39. doi: 10.1006/dbio.1999.9397. [DOI] [PubMed] [Google Scholar]
- 20.Yakovlev AY, Boucher K, Mayer-Pröschel M, Noble M. Quantitative insight into proliferation and differentiation of O-2A progenitor cells in vitro: The clock model revisited. Proc Natl Acad Sci USA. 1998;95:14164–7. doi: 10.1073/pnas.95.24.14164. [DOI] [PMC free article] [PubMed] [Google Scholar]
- 21.Yakovlev AY, Mayer-Proschel M, Noble M. A stochastic model of brain cell differentiation in tissue culture. J Math Biol. 1998;37:49–60. doi: 10.1007/s002850050119. [DOI] [PubMed] [Google Scholar]
- 22.Yakovlev AY, Mayer-Proschel M, Noble M. Stochastic formulations of a clock model for temporally regulated generation of oligodendrocytes in vitro. Math Comput Model. 2000;125:37. [Google Scholar]
- 23.Boucher K, Yakovlev AY, Mayer-Proschel M, Noble M. A stochastic model of temporarily regulated generation of oligodendrocytes in vitro. Math Biosci. 1999;159:47–78. doi: 10.1016/s0025-5564(99)00010-3. [DOI] [PubMed] [Google Scholar]
- 24.Boucher K, Zorin A, Yakovlev AY, Mayer-Proschel M, Noble M. An alternative stochastic model of generation of oligodendrocytes in cell culture. J Math Biol. 2001;43:22–36. doi: 10.1007/s002850100085. [DOI] [PubMed] [Google Scholar]
- 25.von Collani E, Tsodikov A, Yakovlev A, Mayer-Proschel M, Noble M. A random walk model of oligodendrocyte generation in vitro and associated estimation problems. Math Biosci. 1999;159:189, 204. doi: 10.1016/s0025-5564(99)00017-6. [DOI] [PubMed] [Google Scholar]
- 26.Zorin AA, Yakovlev AY, Mayer-Proschel M, Noble M. Estimation problems associated with stochastic modeling of proliferation and differentiation of O-2A progenitor cells in vitro. Math Biosci. 2000;167:109–21. doi: 10.1016/s0025-5564(00)00040-7. [DOI] [PubMed] [Google Scholar]
- 27.Hyrien O, Mayer-Proschel M, Noble M, Yakovlev A. A stochastic model to analyze clonal data on multi-type cell populations. Biometrics. 2005;61:199–207. doi: 10.1111/j.0006-341X.2005.031210.x. [DOI] [PubMed] [Google Scholar]
- 28.Hyrien O, Mayer-Proschel M, Noble M, Yakovlev A. Estimating the lifespan of oligodendrocytes from clonal data on their development in cell culture. Math Biosci. 2005;193:255–74. doi: 10.1016/j.mbs.2004.07.003. [DOI] [PubMed] [Google Scholar]
- 29.Hyrien O, Ambescovic I, Mayer-Proschel M, Noble M, Yakovlev A. Stochastic modeling of oligodendrocytes generation in cell culture: model validation with time-lapse data. Theor Biol Med Model. 2006;3:21. doi: 10.1186/1742-4682-3-21. [DOI] [PMC free article] [PubMed] [Google Scholar]
- 30.Hyrien O, Chen R, Mayer-Proschel M, Noble M. Saddlepoint approximations to the moments of multitype age-dependent branching processes, with applications. Biometrics. 2010;66:567–77. doi: 10.1111/j.1541-0420.2009.01281.x. [DOI] [PMC free article] [PubMed] [Google Scholar]
- 31.Hyrien O. Pseudo-likelihood estimation for discretely observed multitype Bellman-Harris branching processes. J Stat Plan Infer. 2007;137:1375–88. [Google Scholar]
- 32.Jagers P. Branching Processes with Biological Applications. John Wiley & Sons; London: 1975. [Google Scholar]
- 33.Yakovlev AY, Yanev NM. Transient Processes in Cell Proliferation Kinetics. Springer-Verlag; Heidelberg: 1989. [Google Scholar]
- 34.Kimmel M, Axelrod DE. Branching Processes in Biology. Springer-Verlag; New York: 2002. [Google Scholar]
- 35.Ali-Osman F, Giblin J, Dougherty D, Rosenblum ML. Application of in vivo and in vitro pharmacokinetics for physiologically relevant drug exposure in a human tumor clonogenic cell assay. Cancer Res. 1987;47:3718–24. [PubMed] [Google Scholar]
- 36.Levin VA, Hoffman W, Weinkam RJ. Pharmacokinetics of BCNU in man: a preliminary study of 20 patients. Cancer Treat Rep. 1978;62:1305–12. [PubMed] [Google Scholar]
- 37.Henner WD, Peters WP, Eder JP, Antman K, Schnipper L, Frei E. Pharmacokinetics and immediate effects of high-dose carmustine in man. Cancer Treat Rep. 1986;70:877–80. [PubMed] [Google Scholar]
- 38.Cepko C, Ryder EF, Austin CP, Walsh C, Fekete DM. Lineage analysis using retrovirus vectors. Methods in Enzymology. 1995;254:387–419. doi: 10.1016/0076-6879(95)54027-x. [DOI] [PubMed] [Google Scholar]
- 39.Crump KS, Mode CJ. An age-dependent branching process with correlations among sister cells. J Appl Probab. 1969;6:205–10. [Google Scholar]
- 40.Olofsson P. Branching processes with local dependencies. Ann Appl Probab. 1996;6:238–68. [Google Scholar]
- 41.Hyrien O, Chen R, Zand MS. An age-dependent branching process model for the analysis of CFSE-labeling experiments. Biol Direct. 2010;5:41. doi: 10.1186/1745-6150-5-41. [DOI] [PMC free article] [PubMed] [Google Scholar]
- 42.Efron B, Tibshirani RJ. An Introduction to the Bootstrap. Chapman and Hall/CRC; 1994. [Google Scholar]
- 43.Rivers LE, Young KM, Rizzi M, et al. PDGFRA/NG2 glia generate myelinating oligodendrocytes and piriform projection neurons in adult mice. Nat Neurosci. 2008;11:1392–401. doi: 10.1038/nn.2220. [DOI] [PMC free article] [PubMed] [Google Scholar]
Associated Data
This section collects any data citations, data availability statements, or supplementary materials included in this article.