

Abstract
Rationale and Objectives
To evaluate the correlations of tracheal volume and collapsibility on inspiratory and end-expiratory computed tomography (CT) with lung volume and with lung function in smokers.
Materials and Methods
The institutional review board approved this study at each institution. 85 smokers (mean age 68, range 45–87 years; 40 females and 45 males) underwent pulmonary function tests and chest CT at full inspiration and end-expiration. On both scans, intrathoracic tracheal volume and lung volume were measured. Collapsibility of the trachea and the lung was expressed as expiratory/inspiratory (E/I) ratios of these volumes. Correlations of the tracheal measurements with the lung measurements and with lung function were evaluated by the linear regression analysis.
Results
Tracheal volume showed moderate or strong, positive correlations with lung volume on both inspiratory (r=0.661, p<0.0001) and end-expiratory (r=0.749, p<0.0001) scans. The E/I ratio of tracheal volume showed a strong, positive correlation with the E/I ratio of lung volume (r=0.711, p<0.0001). A weak, negative correlation was found between the E/I ratio of tracheal volume and the ratio of forced expiratory volume in the first second to forced vital capacity (FEV1/FVC) (r=−0.436, p<0.0001). Also, a weak, positive correlation was observed between the E/I ratio of tracheal volume and the ratio of residual volume to total lung capacity (RV/TLC) (r=0.253, p=0.02).
Conclusions
Tracheal volume and collapsibility, measured by inspiratory and end-expiratory CT scans, is related to lung volume and collapsibility. The highly collapsed trachea on end-expiratory CT does not indicate more severe airflow limitation or air-trapping in smokers.
Keywords: Tracheal volume, lung volume, chronic obstructive pulmonary disease, tracheomalacia
Introduction
The meaning behind the highly collapsed trachea, observed on expiratory scans of computed tomography (CT), is still controversial. While it has been acknowledged that the central airways markedly decrease in size on dynamic- or end-expiratory CT scans in patients with tracheomalacia (TM) or tracheobronchomalacia (TBM) [1–8], some studies have demonstrated that the highly collapsed trachea can also be observed on these expiratory scans in subjects with normal lung function [9, 10]. In patients with chronic obstructive pulmonary disease (COPD), published information on the size of the trachea is more limited. Although some investigations have demonstrated the presence of the highly collapsed central airways in COPD using dynamic-expiratory or end-expiratory scans [11–14], it still remains unclear whether or not the highly collapsed trachea indicates reduced lung function.
In 2003, Ederle and colleagues demonstrated that, in both normal subjects and subjects with obstructive pulmonary disease, cross-sectional area of the trachea correlated with mean lung density (MLD) and cross-sectional area of the lung on both inspiratory and end-expiratory CT scans [11]. They also showed that the changes in tracheal cross-sectional area (ΔCSA trachea) between inspiratory and expiratory scans significantly correlated to the changes in MLD (ΔMLD). Further, more recent studies have demonstrated significant correlations between MLD and lung volume (LV) [15, 16]. Based upon these observations, it can be predicted that the observations of Ederle and colleagues would be reproduced using volumetric measurements, such as LV and tracheal volume.
We therefore hypothesized that tracheal volume and changes in tracheal volume on inspiratory and end-expiratory CT scans would be correlated to LV and changes in LV among smokers. While CT-based volumetric analysis of the whole lung has been gradually performed in COPD [15–19], published information on tracheal volumetric measurements is still limited [20]. With the development of imaging technology, it has become easier to advance the methodology for measuring tracheal size from dimensional to volumetric indices. Furthermore, it would be of interest to evaluate whether or not tracheal volume and collapsibility is correlated with lung function, and whether or not volumetric measurements of the trachea are equivalent to dimensional measurements.
Thus, the aims of this study are: (i) to verify the correlations between tracheal volumetric measures, including tracheal collapsibility, and LV measures on inspiratory and end-expiratory CT scans, (ii) to evaluate the relationship between tracheal collapsibility and lung function, and (iii) to confirm the correlations between tracheal volumetric measures and dimensional measures.
Materials and Methods
This retrospective study was approved by the Institutional Review Board at each institution. Informed consent was obtained from all subjects. The subjects’ CT and clinical data utilized in this study were partially analyzed with a different objective for other research [15].
Subjects
From March 2005 to February 2008, a total of 184 subjects were enrolled in the Lung Tissue Research Consortium (LTRC), a multicenter trial for pulmonary diseases, at four institutions, including Mayo Clinic at Rochester, University of Michigan, University of Pittsburgh, and University of Colorado. CT scans and patients’ clinical information that were provided for this study were collected in accordance to the protocols outlined by the LTRC. Further information on the LTRC, including its mission and inclusion criteria, is available on the website [www.ltrcpublic.com]. Among the 184 subjects, 85 subjects, who underwent chest CT with two standardized protocols, were eventually selected and analyzed in this study. Exclusion criteria for this study included the following: (i) usage of different CT scanners that were not selected for this study (n=8), (ii) CT scans with contrast medium or different slice thickness (n=31), (iii) different tube current or voltage (n=15), (iv) no available end-expiratory CT scan (n=6), (v) no history of cigarette smoking (n=1), (vi) previous history of lung resection (n=5), (vii) severe artifacts on CT images (n=4), and (viii) presence of pneumothorax, lobar atelectasis, large bullae (>3cm in diameter), severe fibrosis, or a mass (>3cm in diameter) (n=29).
The characteristics of the 85 subjects are summarized in Table 1. 40 females and 45 males were included (mean age of 68 years, age range 45 to 87 years). All subjects were current or former smokers and their mean smoking index was 48.4 pack-years ± 32.9.
Table 1.
Clinical characteristics of the 85 subjects
| Mean ± SD | (Range) | |
|---|---|---|
| Age (years) | 67.8 ± 8.0 | (45 – 87) |
| Smoking index (pack-years) | 48.4 ± 32.9 | (2 – 180) |
| FEV1/FVC | 0.56 ± 0.14 | (0.17 – 0.83) |
| FEV1(%predicted) | 60.8 ± 23.6 | (14 – 126) |
| RV/TLC | 0.50 ± 0.10 | (0.32 – 0.73) |
| TLC (L) | 6.45 ± 1.34 | (4.10 – 10.20) |
| RV (L) | 3.24 ± 0.97 | (1.50 – 7.00) |
Definition of abbreviations:
FEV1, forced expiratory volume in the first second; FVC, forced vital capacity; RV, residual volume; TLC, total lung capacity;
Pulmonary Function Tests
All 85 subjects performed pre-bronchodilator spirometry, including forced expiratory volume in the first second (FEV1) and forced vital capacity (FVC), according to American Thoracic Society standards as described previously [21]. FEV1 was also expressed as the percentages of predicted values. Residual volume (RV) and total lung capacity (TLC) were measured by plethysmography [22]. The results of pulmonary function tests (PFT) are summarized in Table 1.
According to the Global Initiative for Chronic Obstructive Lung Disease (GOLD) staging [23], 85 subjects were classified as follows: smokers with normal lung function, n=14; GOLD stage 1, n= 14; stage 2, n=38; stage 3, n= 11; and stage 4, n=8.
Thin-section CT
All subjects were scanned at full inspiration and full expiration (end-expiration), without receiving a contrast medium. Prior to CT scanning, subjects were coached to hold their breath at full inspiration and full expiration. Among the 85 subjects, 46 subjects were scanned with 16-detector CT (LightSpeed 16 or LightSpeed Pro16, GE Medical Systems, Milwaukee, WI) Images were obtained using 140 kV and 300 mA. Rotation time was 0.53 second and the matrix size was 512 x 512 pixels. Images were reconstructed with a 1.25mm-slice thickness (with 0.625mm-overlapping), using the ‘Bone’ algorithm. The other 39 subjects were scanned with 64-detector CT (Sensation 64, Siemens Healthcare, Munich, Germany). Tube voltage was 140 kV and tube current varied by automatic regulation (approximately 75–450 mA), which was based upon the slice location and the subject’s body habitus. Rotation time was 0.5 second and the matrix size was 512 x 512 pixels. Images were reconstructed with a 1.0mm-slice thickness (with 0.5mm-overlapping), using the ‘B46f’ algorithm.
Measurements of the trachea
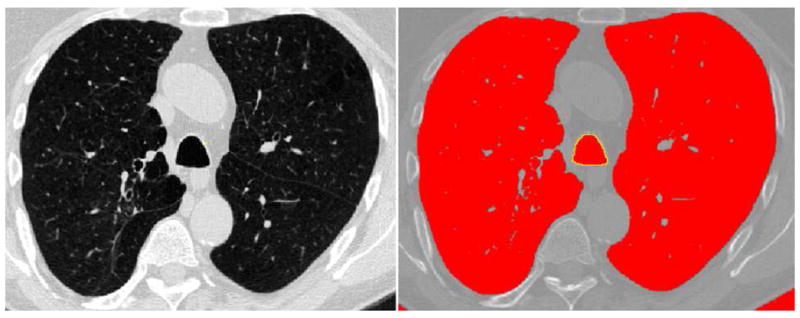
The cross-sectional area of the trachea and intrathoracic tracheal volume were measured by a thoracic radiologist (T.Y., with 9 years’ experience in interpreting thoracic CT), using open-source software (Image J, National Institutes of Health, Bethesda, MD) [http://rsb.info.nih.gov.ij], without prior knowledge of clinical information. On an axial CT image, the software automatically segmented the lumen of the trachea from the soft tissues in the mediastinum, using thresholds of −1024 and −500 Hounsfield unit (HU), which was followed by the measuring of the cross-sectional area of the trachea (Figure 1). To measure the cross-sectional area of the trachea, two anatomic levels were selected on inspiratory scans (1cm above the aortic arch and 1cm above the carina), according to the most recent investigation [9]. On end-expiratory scans, cross-sectional areas of the trachea were also measured at the same levels, determined by interpreting all anatomical observations. CT images were set with lung window to perform these measurements.
Fig. 1.
69-year-old man with chronic obstructive pulmonary disease (GOLD stage 2). An example of the measurement for tracheal cross-sectional area on his inspiratory CT scan is demonstrated. The boundary of the lower trachea is traced automatically by the software (yellow-colored line). Cross-sectional area of the trachea is calculated as 350.6 mm2.
Intrathoracic tracheal volume was also measured using the same software on both inspiratory and end-expiratory scans. In brief, the following process was performed. (i) The radiologist selected all CT images that include the trachea, from the top of the apex to the carina. (ii) The software showed the images for every two slices because the original scan had a 50%-overlap. (iii) Extra-tracheal air regions (the lungs, bronchi, and esophagus) were automatically segmented by the software and manually excluded on each image. (iv) A relatively large measuring area was set in the center of the chest, which included the trachea throughout the selected images. (v) The software measured cross-sectional areas of the trachea on the all selected images. (vi) The total cross-sectional area was calculated, and intrathoracic tracheal volume was obtained by multiplying the total cross-sectional area by slice thickness. It took approximately 20 minutes to complete the whole process per subject.
Collapsibility of the tracheal cross-sectional area or tracheal volume was calculated by the expiratory/inspiratory (E/I) ratios of these two indices.
Measurements of the lung volume
LV was full-automatically measured by different open-source software (Airway Inspector, Brigham and Women’s Hospital, Boston, MA) [www.airwayinspector.org], as described previously [15]. In brief, the software (i) segmented the lung parenchyma (−1024 to −500 HU) from the chest wall and the hilum; (ii) created a density histogram of the lung parenchyma; and (iii) measured LV by summing all pixels included in the histogram and multiplying them by slice thickness. In each subject, it was confirmed by an operator (T.Y.) that the software properly excluded the trachea and the main bronchi from the measured lung field. The E/I ratios of LV were calculated by the operator.
Reproducibility of tracheal volume measurements
Intraobserver error was tested by having one observer (T.Y.) measure tracheal volume twice on inspiratory scans in 20 subjects, who were randomly selected from a total of 85 subjects. The second measurement was performed 2 months after the first session. To evaluate interobserver error, two observers (T.Y. and A.D.) independently measured tracheal volume in the 20 subjects. Analysis of intra- and interobserver reproducibility was conducted using the Bland-Altman analysis [24].
Statistical analysis
All statistical analyses were performed using JMP 7.0 software (SAS Institute, Cary, NC). Data were expressed as mean ± standard deviation (SD). The linear regression analysis was used to estimate the relationships among measured CT indices, and between CT indices and PFT values. P values less than 0.05 were considered statistically significant.
Results
Reproducibility of tracheal volume measurements
The intra- and interobserver reproducibility of tracheal volume measurements is shown in Table 2. The mean difference did not appreciably deviate from zero, and the limits of agreement were small (Figure 2).
Table 2.
Reproducibility of tracheal volume measurements
| Mean difference ± SD | Limit of agreement | |
|---|---|---|
| Tracheal volume (ml) | ||
| Intraobserver error | 0.05 ± 0.13 | −0.20 to 0.30 |
| Interobserver error | 0.04 ± 0.15 | −0.22 to 0.29 |
Fig. 2.
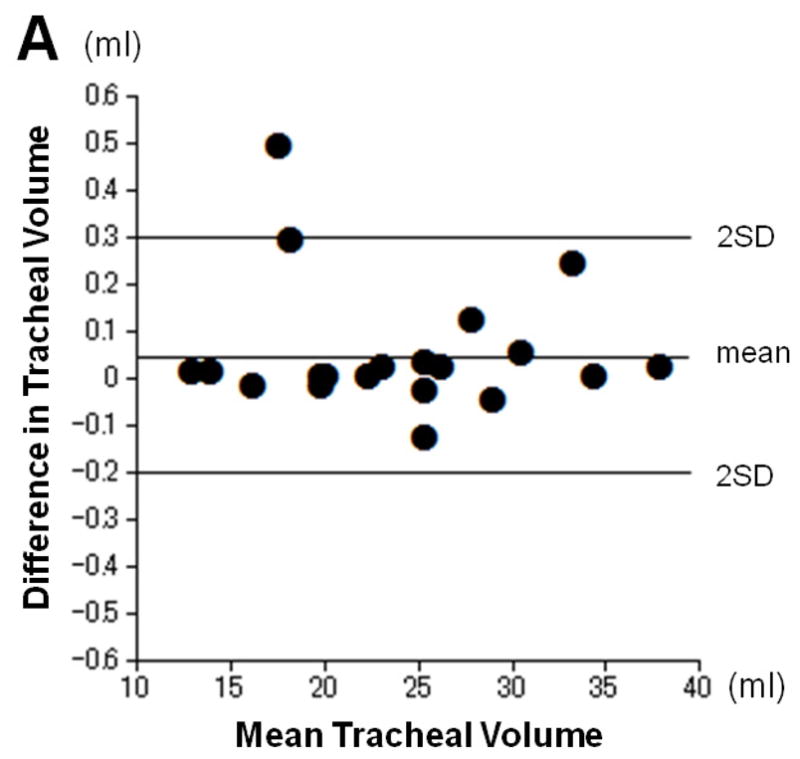
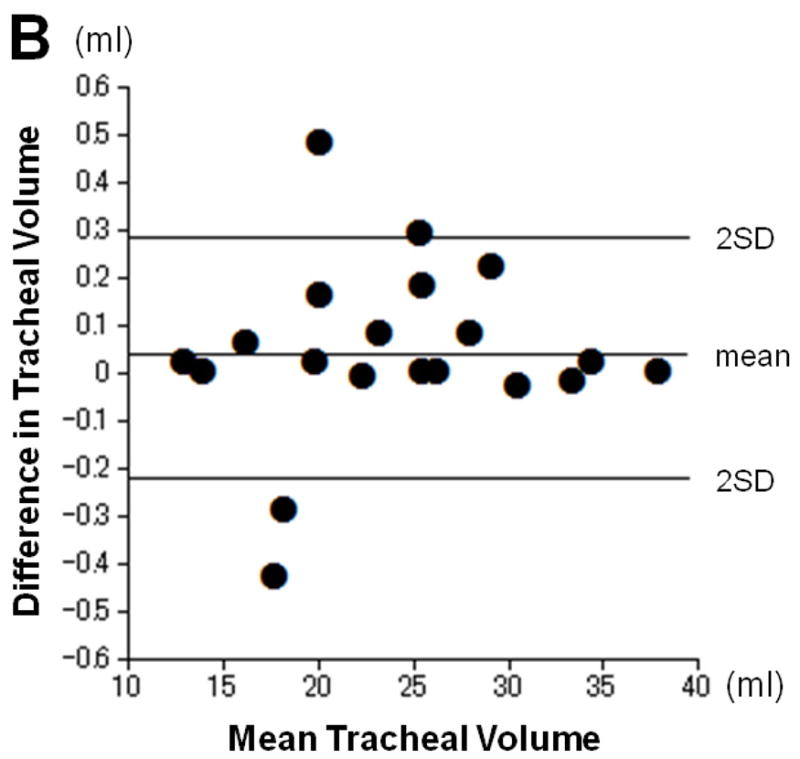
Intra- and inter-observer reproducibility for tracheal volume measurements. Plots show intraobserver (A) and interobserver (B) error for measurement of tracheal volume according to the Bland-Altman analysis. The mean of the two measurements and the difference between them are plotted. The mean difference does not appreciably deviate from zero, and limits of agreement are small.
Tracheal measurements
Table 3 demonstrates the measurements of the tracheal cross-sectional and tracheal volume. The mean cross-sectional area of the upper-trachea decreased from 273.3 mm2 ± 63.7 at inspiration to 236.4 mm2 ± 60.2 at end-expiration, and the mean E/I ratio was 0.87 ± 0.12. Similar observations were found for the lower trachea (273.1 mm2 ± 66.7 at inspiration, 234.4 mm2 ± 62.1 at end-expiration, and E/I ratio of 0.86 ± 0.11). The mean tracheal volume also decreased from 24.6 ml ± 6.8 at inspiration to 19.5 ml ± 6.1 at end-expiration, with the mean E/I ratio of 0.79 ± 0.13. Strong, positive correlations (p<0.0001) were found between measurements of the tracheal cross-sectional area and tracheal volume on both inspiratory and expiratory scans (upper trachea, r=0.855 at inspiration, r=0.879 at expiration; lower trachea, r=0.816 at inspiration, r=0.818 at expiration, respectively). The E/I ratios of tracheal cross-sectional areas also showed strong, positive correlations (p<0.0001) with the E/I ratios of tracheal volume (upper trachea, r=0.841; lower trachea, r=0.853, respectively).
Table 3.
Measurements of the trachea and lung volume on chest CT
| Inspiration | Expiration | E/I ratio | |
|---|---|---|---|
| Cross-sectional area (mm2) | |||
| Upper-trachea | 273.3 ± 63.7 | 236.4 ± 60.2 | 0.87 ± 0.12 |
| Lower-trachea | 273.1 ± 66.7 | 234.4 ± 62.1 | 0.86 ± 0.11 |
| Tracheal volume (ml) | 24.6 ± 6.8 | 19.5 ± 6.1 | 0.79 ± 0.13 |
| Lung volume (l) | 5.44 ± 1.35 | 3.83 ± 1.17 | 0.71 ± 0.14 |
Definition of abbreviations: E/I = expiratory/inspiratory
CT-based lung volume
CT-based lung volume was 5.44 L ± 1.35 at inspiration and 3.83 L ± 1.17 at expiration (Table 3). Inspiratory LV showed a strong, positive correlation with TLC (r=0.867, p<0.0001) and expiratory LV with RV (r=0.815, p<0.0001), respectively.
Correlations between tracheal volume and CT-based lung volume
Table 4 shows correlations between tracheal volume measures and LV measures. Moderate or strong, positive correlations were found between inspiratory tracheal volume and inspiratory LV (r=0.661, p<0.0001), and between expiratory tracheal volume and expiratory LV (r=0.749, p<0.0001, Figure 3). Further, the E/I ratio of tracheal volume demonstrated a strong, positive correlation with the E/I ratio of lung volume (r=0.711, p<0.0001, Figure 3).
Table 4.
Correlations of tracheal volume with CT-based lung volume and with lung function
|
CT-based lung volume |
Lung function |
|||||
|---|---|---|---|---|---|---|
| Inspiration | Expiration | E/I ratio | FEV1/FVC | FEV1 (%predicted) | RV/TLC | |
| Tracheal volume | ||||||
| Inspiration | 0.661a | 0.472a | −0.126 | −0.221d | −0.110 | −0.182 |
| Expiration | 0.677a | 0.749a | 0.293c | −0.445a | −0.179 | −0.020 |
| E/I ratio | 0.135 | 0.551a | 0.711a | −0.436a | −0.333a | 0.253d |
p<0.0001,
p<0.001,
p<0.01,
p<0.05
Definition of abbreviations: E/I = expiratory/inspiratory;
Fig. 3.
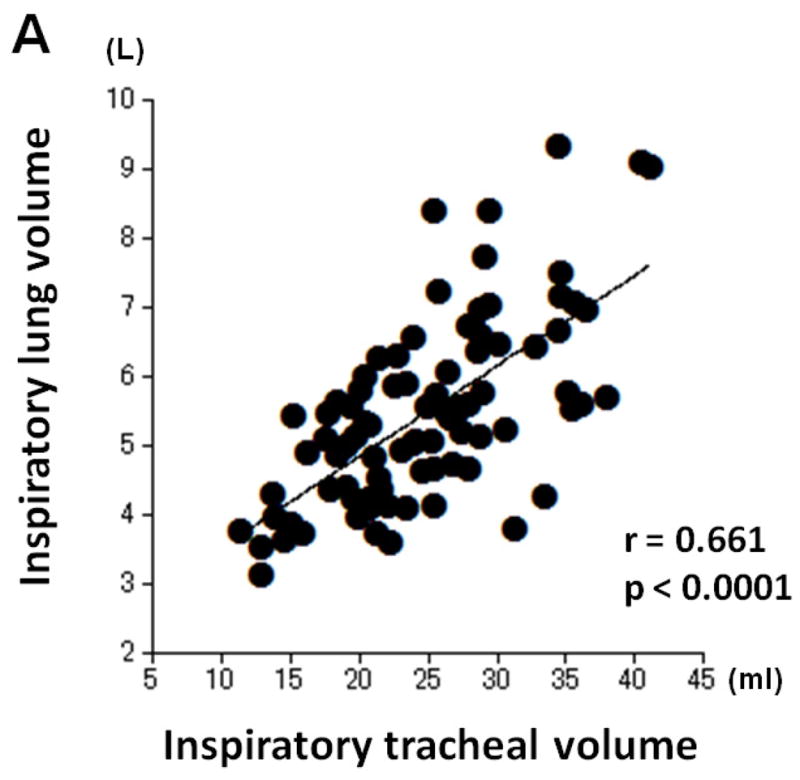
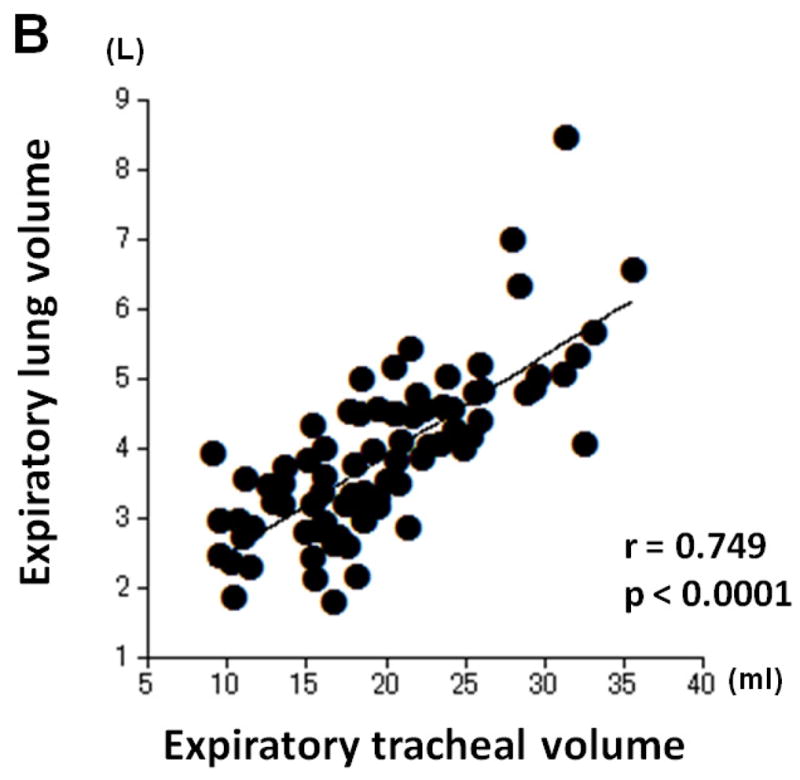
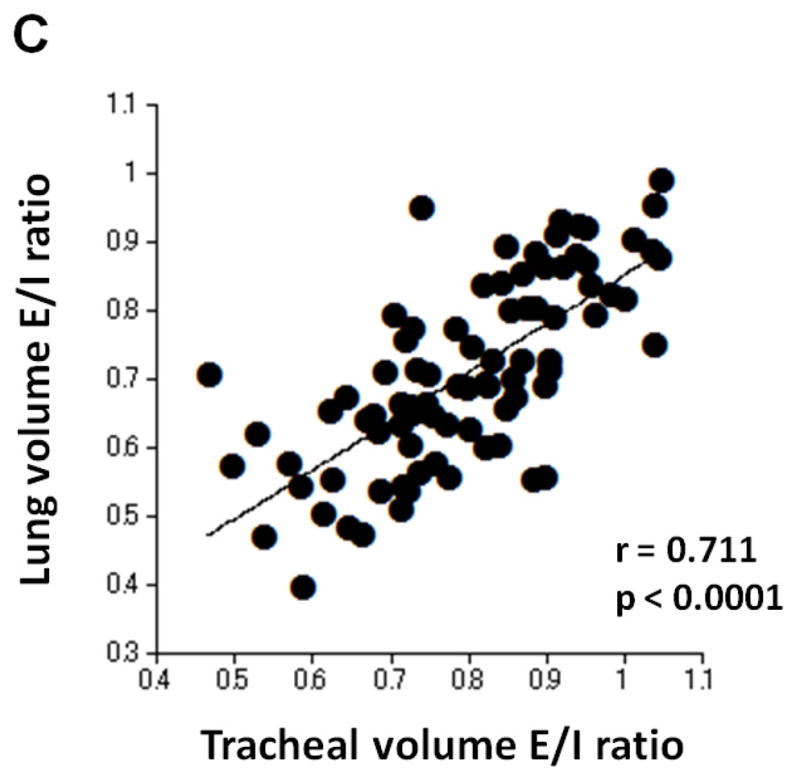
Correlations between measurements of tracheal volume and lung volume. Strong or moderate, positive correlations are found between inspiratory tracheal volume and inspiratory lung volume (A, r=0.661, p<0.0001), between expiratory tracheal volume and expiratory lung volume (B, r=0.749, p<0.0001), and between the E/I ratios of tracheal volume and lung volume (C, r=0.711, p<0.0001).
Correlations between tracheal volume and lung function
Correlations of tracheal volume measurements and PFT results are shown in Table 4. A moderate, negative correlation was found between end-expiratory tracheal volume and FEV1/FVC (r=−0.445, p=0.04). Also, the E/I ratio of tracheal volume showed moderate or weak, negative correlations with FEV1/FVC (r=−0.436, p<0.0001) and FEV1%predicted (r=−0.333, p<0.0001), and a weak, positive correlation with RV/TLC (r=0.253, p=0.02), suggesting that higher collapsibility of the trachea indicates less severe airflow limitation or air-trapping in the 85 subjects.
Discussion
In the current study, we first demonstrate tracheal volumetric measurements and their correlations with LV measurements. In addition to significant correlations between LV and tracheal volume both on inspiratory and end-expiratory scans, collapsibility of the trachea is strongly correlated with collapsibility of the lung. The E/I ratio of the trachea negatively correlates with FEV1/FVC and FEV1%P, suggesting that the highly collapsed trachea on end-expiratory scans indicates less severe airflow limitation in the subjects analyzed in the study. We believe therefore that the highly collapsed trachea on end-expiratory scans, which is included in the highly collapsed thorax, is not a morbid finding and should be distinguished from the abnormally collapsed trachea in TM/TBM. These observations would be of importance for future radiological and physiological studies of tracheal collapse in COPD or TM/TBM subjects, as well as for the accurate interpretation of tracheal collapse on clinical CT scans.
Although the correlation between tracheal collapsibility and lung collapsibility has not been assessed, the relationships between tracheal sizes, measured by CT or acoustic reflection techniques, and plethysmographic lung values (TLC, RV) have been investigated in early physiological studies using normal subjects [25–28]. Also, it has also been reported that, on both inspiratory and end-expiratory CT scans, cross-sectional areas of the trachea are correlated with cross-sectional areas of the lung in normal subjects and subjects with obstructive disease [11]. The current study can be considered to replicate previous observations using CT volumetric indices, such as tracheal volume and LV. Furthermore, this study first demonstrates the correlation between tracheal collapsibility and lung collapsibility, which can also be useful for future radiological and physiological studies of the central airways.
While tracheal collapse in COPD has been investigated in some studies [11–14, 29], it still remains ambiguous as to whether or not tracheal collapsibility is directly correlated with lung function. To the best of our knowledge, only a limited number of studies have discussed the relationship between tracheal collapsibility and PFT results [13, 14], which leads to the conclusion that high collapsibility of the trachea does not solely indicate compromised lung function. It has also been reported that no significant difference is found in the presence of airway malacia among GOLD stages [13]. Furthermore, similar to an early study by Thiriet and colleagues [10], Boiselle and colleagues have recently demonstrated that the highly collapsed trachea (>50% in cross-sectional area) on dynamic-expiratory CT scans, which is concordant with the current diagnostic criteria of TM/TBM, is frequently observed in subjects with normal lung function [9]. These results suggest that it still remains difficult to distinguish a severe tracheal collapse in normal subjects from an abnormal collapse in TM/TBM, and that it is useful to understand the mechanism of tracheal collapsibility using some other factors outside the trachea. The current study suggests that the highly collapsed trachea, observed on end-expiratory CT scans, indicates less severe airflow limitation or air-trapping in smokers. These observations can be partially explained by the prediction that LV would be maintained on end-expiratory scans in more severe COPD patients, due to severe air-trapping or expiratory airflow obstruction [15], resulting in smaller changes in intrathoracic pressure and in the tracheal size. However, it has also been acknowledged that smoking, severe emphysema, and chronic bronchitis are contributors to the development of TM/TBM [4]. Further, it can be predicted that the trachea can collapse more highly on dynamic-expiratory scans [1, 2, 4, 5]. Although published information is limited on the frequency of TM/TBM in the general COPD population, further research using dynamic-expiratory scans is needed to comprehend the prevalence and clinical impact of the highly collapsed trachea in subjects with COPD.
There are some important limitations in the current study. First, this study did not utilize dynamic-expiratory CT scans. It has already been acknowledged that end-expiratory CT scans are less sensitive in evaluating tracheal collapse than dynamic-expiratory scans, particularly in TM/TBM [1, 2, 4, 5]. In fact, compared with a study for COPD subjects using dynamic-expiratory scans [29], collapsibility of the trachea was much smaller and might have been underestimated in this study. However, based on the fact that end-expiratory scans have been used more frequently and proved to be effective in COPD analysis [15, 30, 31], we believe that it is still meaningful to demonstrate tracheal collapsibility using end-expiratory scans in general COPD subjects.
Second, it should be mentioned that inspiratory and end-expiratory scans were obtained without the spirometry-gated technique in our study, which may lead to questioning of whether or not these scans were truly obtained at subjects’ full inspiration and full expiration. In this study, inspiratory LV was smaller than plethysmographic TLC and expiratory LV larger than RV, which is similar to previous studies [17, 18, 32, 33]. These disturbances between CT-based lung volume and plethysmographic measures can be partially explained by a lack of patient cooperation, the difference of the body position, or the larger effort of breath-holding at expiratory CT scanning than at PFT.
Third, tracheal volume measured in the study requires further discussion. We measured intrathoracic tracheal volume, which was measured from the top of the apex to the carina, suggesting that the apical point would have been influenced by the location and size of the lung in each subject. However, it is known that the intrathoracic part of the trachea behaves differently from the extrathoracic part of the trachea [20]. Further, from the perspective of programming automatic measurements, we believe that this apical point is a reasonable and the easiest anatomical location for the standardized method.
Fourth, the number of subjects in the current study was relatively small. This may be one of the reasons that we rarely found subjects with severe tracheal collapse, compared to a large study, which enrolled more than 1000 smokers and found some cases with the highly collapsed trachea using similar end-expiratory CT scans [12].
Fifth, two different scanning protocols were used in this study, which may lead to a questioning of our original CT data and the reliability of measured parameters. Compared with other CT indices, such as mean lung density or low attenuation area percent, it is predictable that LV or tracheal volume are less sensitive to the differences in scanning protocols, since the upper threshold of −500HU is the only point to be influenced by the protocols. We believe therefore that the difference in the protocols did not severely impact the measurements, and that the major observations in the current study were not amplified.
In summary, we first measured tracheal volume and analyzed volumetric measurements of the trachea with lung indices using inspiratory and end-expiratory CT scans. Significant correlations were found between tracheal volume and lung volume, as well as correlations between collapsibility of the trachea and collapsibility of the lung. Further, higher collapsibility of the trachea did not indicate lower EFV1%predicted, lower FEV1/FVC, or higher RV/TLC in this study.
Acknowledgments
This study utilized data provided by the Lung Tissue Research Consortium (LTRC) supported by the National Heart, Lung, and Blood Institute (NHLBI). The authors thank Alba Cid, MS, and Kerianne R. Panos, MS, for their important suggestions.
Grant information: This study is supported by NIH K23HL089353-01A1 and a grant from the Parker B. Francis Foundation.
Footnotes
Note for Dr. San José Estépar
Please note that his first name is Raúl, and family name is San José Estépar. The authors would appreciate it if the editors would pay attention to his first/family name and accents.
Disclosures
Dr. Yamashiro, Dr. San Jose Estepar, Dr. Matsuoka, Dr. Bartholmai, Mr. Ross, Dr. Diaz, Dr. Murayama, Dr. Hatabu, and Dr. Washko have no conflicts of interest to disclose. Dr. Silverman received an honorarium for a talk on COPD genetics in 2006, and grant support and consulting fees from GlaxoSmithKline for two studies of COPD genetics. Dr. Silverman also received honoraria from Bayer in 2005, and from AstraZeneca in 2007 and 2008.
Publisher's Disclaimer: This is a PDF file of an unedited manuscript that has been accepted for publication. As a service to our customers we are providing this early version of the manuscript. The manuscript will undergo copyediting, typesetting, and review of the resulting proof before it is published in its final citable form. Please note that during the production process errors may be discovered which could affect the content, and all legal disclaimers that apply to the journal pertain.
References
- 1.Gilkeson RC, Ciancibello LM, Hejal RB, et al. Tracheobronchomalacia: dynamic airway evaluation with multidetector CT. Am J Roentgenol. 2001;176:205–210. doi: 10.2214/ajr.176.1.1760205. [DOI] [PubMed] [Google Scholar]
- 2.Aquino SL, Shepard JA, Ginns LC, et al. Acquired tracheomalacia: detection by expiratory CT scan. J Comput Assist Tomogr. 2001;25:394–399. doi: 10.1097/00004728-200105000-00011. [DOI] [PubMed] [Google Scholar]
- 3.Zhang J, Hasegawa I, Feller-Kopman D, et al. Dynamic expiratory volumetric CT imaging of the central airways: comparison of standard-dose and low-dose techniques. Acad Radiol. 2003;10:719–724. doi: 10.1016/s1076-6332(03)80117-4. [DOI] [PubMed] [Google Scholar]
- 4.Carden KA, Boiselle PM, Waltz DA, et al. Tracheomalacia and tracheobronchomalacia in children and adults: an in-depth review. Chest. 2005;127:984–1005. doi: 10.1378/chest.127.3.984. [DOI] [PubMed] [Google Scholar]
- 5.Baroni RH, Feller-Kopman D, Nishino M, et al. Tracheobronchomalacia: comparison between end-expiratory and dynamic expiratory CT for evaluation of central airway collapse. Radiology. 2005;235:635–641. doi: 10.1148/radiol.2352040309. [DOI] [PubMed] [Google Scholar]
- 6.Lee KS, Sun ME, Ernst A, et al. Comparison of dynamic expiratory CT with bronchoscopy in diagnosing airway malacia. Chest. 2007;131:758–764. doi: 10.1378/chest.06-2164. [DOI] [PubMed] [Google Scholar]
- 7.Ferretti GR, Jankowski A, Perrin MA, et al. Multi-detector CT evaluation in patients suspected of tracheobronchomalacia: comparison of end-expiratory with dynamic expiratory volumetric acquisitions. Eur J Radiol. 2008;68:340–346. doi: 10.1016/j.ejrad.2007.08.029. [DOI] [PubMed] [Google Scholar]
- 8.Boiselle PM, Ernst A. Tracheal morphology in patients with tracheomalacia: prevalence of inspiratory “lunate” and expiratory “frown” shapes. J Thorac Imaging. 2006;21:190–196. doi: 10.1097/01.rti.0000213647.42041.d0. [DOI] [PubMed] [Google Scholar]
- 9.Boiselle PM, O'Donnell CR, Bankier AA, et al. Tracheal collapsibility in healthy volunteers during forced expiration: assessment with multidetector CT. Radiology. 2009;252:255–262. doi: 10.1148/radiol.2521081958. [DOI] [PMC free article] [PubMed] [Google Scholar]
- 10.Thiriet M, Maarek JM, Chartrand DA, et al. Transverse images of the human thoracic trachea during forced expiration. J Appl Phsiol. 1989;67:1032–1040. doi: 10.1152/jappl.1989.67.3.1032. [DOI] [PubMed] [Google Scholar]
- 11.Ederle JR, Heussel CP, Hast J, et al. Evaluation of changes in central airway dimensions, lung area and mean lung density at paired inspiratory/expiratory high-resolution computed tomography. Eur Radiol. 2003;13:2454–2461. doi: 10.1007/s00330-003-1909-5. [DOI] [PubMed] [Google Scholar]
- 12.Ochs RA, Petkovska I, Kim HJ, et al. Prevalence of tracheal collapse in an emphysema cohort as measured with end-expiration CT. Acad Radiol. 2009;16:46–53. doi: 10.1016/j.acra.2008.05.020. [DOI] [PMC free article] [PubMed] [Google Scholar]
- 13.Sverzellati N, Rastelli A, Chetta A, et al. Airway malacia in chronic obstructive pulmonary disease: prevalence, morphology and relationship with emphysema, bronchiectasis and bronchial wall thickening. Eur Radiol. 2009;19:1669–1678. doi: 10.1007/s00330-009-1306-9. [DOI] [PubMed] [Google Scholar]
- 14.Lee CJ, Lee JH, Song JW, et al. Correlation of tracheal cross-sectional area with parameters of pulmonary function test in COPD. Tuberc Respir Dis. 1999;46:628–635. [Google Scholar]
- 15.Yamashiro T, Matsuoka S, Bartholmai BJ, et al. Collapsibility of lung volume by paired inspiratory and expiratory CT scans: correlations with lung function and mean lung density. Acad Radiol. 2010;17:489–495. doi: 10.1016/j.acra.2009.11.004. [DOI] [PMC free article] [PubMed] [Google Scholar]
- 16.Camiciottoli G, Cavigli E, Grassi L, et al. Prevalence and correlates of pulmonary emphysema in smokers and former smokers. A densitometric study of participants in the ITALUNG trial. Eur Radiol. 2009;19:58–66. doi: 10.1007/s00330-008-1131-6. [DOI] [PubMed] [Google Scholar]
- 17.Kauczor HU, Heussel CP, Fischer B, et al. Assessment of lung volumes using helical CT at inspiration and expiration: comparison with pulmonary function tests. Am J Roentgenol. 1998;171:1091–1095. doi: 10.2214/ajr.171.4.9763003. [DOI] [PubMed] [Google Scholar]
- 18.Zaporozhan J, Ley S, Eberhardt R, et al. Paired inspiratory/expiratory volumetric thin-section CT scan for emphysema analysis: comparison of different quantitative evaluations and pulmonary function test. Chest. 2005;128:3212–3220. doi: 10.1378/chest.128.5.3212. [DOI] [PubMed] [Google Scholar]
- 19.Iwano S, Okada T, Satake H, et al. 3D-CT volumetry of the lung using multidetector row CT: comparison with pulmonary function tests. Acad Radiol. 2009;16:250–256. doi: 10.1016/j.acra.2008.09.019. [DOI] [PubMed] [Google Scholar]
- 20.Griscom NT, Wohl ME. Tracheal size and shape: effects of change in intraluminal pressure. Radiology. 1983;149:27–30. doi: 10.1148/radiology.149.1.6611936. [DOI] [PubMed] [Google Scholar]
- 21.Miller MR, Hankinson J, Brusasco V, et al. ATS/ERS task force: standardisation of spirometry. Eur Respir J. 2005;26:319–338. doi: 10.1183/09031936.05.00034805. [DOI] [PubMed] [Google Scholar]
- 22.Stocks J, Quanjer PH. Reference values for residual volume, functional residual capacity and total lung capacity: ATS workshop on lung volume measurements / official statement of the European Respiratory Society. Eur Respir J. 1995;8:492–506. doi: 10.1183/09031936.95.08030492. [DOI] [PubMed] [Google Scholar]
- 23.Rabe KF, Hurd S, Anzueto A, et al. Global strategy for the diagnosis, management, and prevention of chronic obstructive pulmonary disease: GOLD executive summary. Am J Respir Crit Care Med. 2007;176:532–555. doi: 10.1164/rccm.200703-456SO. [DOI] [PubMed] [Google Scholar]
- 24.Bland JM, Altman DG. Statistical methods for assessing agreement between two methods of clinical measurement. Lancet. 1986;1:307–310. [PubMed] [Google Scholar]
- 25.Hoffstein V. Relationship between lung volume, maximal expiratory flow, forced expiratory volume in one second, and tracheal area in normal men and women. Am Rev Respir Dis. 1986;134:956–961. doi: 10.1164/arrd.1986.134.5.956. [DOI] [PubMed] [Google Scholar]
- 26.Hoffstein V, Castile RG, O'Donnell CR, et al. In vivo estimation of tracheal distensibility and hysteresis in normal adults. J Appl Physiol. 1987;63:2482–2489. doi: 10.1152/jappl.1987.63.6.2482. [DOI] [PubMed] [Google Scholar]
- 27.Martin TR, Castile RG, Fredberg JJ, et al. Airway size is related to sex but not lung size in normal adults. J Appl Physiol. 1987;63:2042–2047. doi: 10.1152/jappl.1987.63.5.2042. [DOI] [PubMed] [Google Scholar]
- 28.Dolyniuk MV, Fahey PJ. Relationship of tracheal size to maximal expiratory airflow and density dependence. J Appl Physiol. 1986;60:501–515. doi: 10.1152/jappl.1986.60.2.501. [DOI] [PubMed] [Google Scholar]
- 29.Heussel CP, Ley S, Biedermann A, et al. Respiratory lumenal change of the pharynx and trachea in normal subjects and COPD patients: assessment by cine-MRI. Eur Radiol. 2004;14:2188–2197. doi: 10.1007/s00330-004-2461-7. [DOI] [PubMed] [Google Scholar]
- 30.Akira M, Toyokawa K, Inoue Y, et al. Quantitative CT in chronic obstructive pulmonary disease: inspiratory and expiratory assessment. Am J Roentgenol. 2009;192:267–272. doi: 10.2214/AJR.07.3953. [DOI] [PubMed] [Google Scholar]
- 31.Matsuoka S, Kurihara Y, Yagihashi K, et al. Airway dimensions at inspiratory and expiratory multisection CT in chronic obstructive pulmonary disease: correlation with airflow limitation. Radiology. 2008;248:1042–1049. doi: 10.1148/radiol.2491071650. [DOI] [PubMed] [Google Scholar]
- 32.O’Donnell CR, Loring SH. Comparison of plethysmographic, helium dilution and CT-derive total lung capacity. Am J Respir Crit Care Med. 2005;171:A293. (abstract) [Google Scholar]
- 33.Garfield JL, Marchetti N, Gaughan JP, et al. Lung volume by plethsmography and CT in advanced COPD. Am J Respir Crit Care Med. 2009;179:A2902. (abstract) [Google Scholar]