

Abstract
In the vertebrate visual system, ON cells respond to positive contrasts and OFF cells respond to negative contrasts, and thus both ON and OFF cells exhibit rectification. We investigated the retinal circuits by which the ON pathway rectifies the OFF pathway. White noise was projected onto an in vitro preparation of the mammalian retina and excitatory currents were recorded from retinal ganglion cells under whole-cell voltage clamp. Currents in OFF cells were more rectified than those in ON cells: thus, currents in ON cells were able to signal both positive and negative contrasts, but currents in OFF cells were virtually restricted to negative contrasts. Blocking signals in the ON pathway derectified currents in OFF ganglion cells, thus allowing them to be modulated by positive contrasts, indicating that the ON pathway normally rectifies currents in OFF ganglion cells. Such cross-rectification from ON to OFF pathways required intact glycinergic inhibition, indicating that a glycinergic amacrine cell, most likely the AII amacrine cell, allows the ON bipolar cell to hyperpolarize the OFF bipolar cell close to the threshold for transmitter release, thus rectifying excitatory currents in the OFF ganglion cell. Asymmetrical rectification of ON and OFF cells may be an adaptation to natural scenes that have more contrast levels below the mean than above. Thus, in order for ON and OFF pathways to encode an equal number of contrast levels, the ON cells must signal some negative contrasts.
Introduction
The visual system consists of separate ON and OFF pathways that begin in the retina, travel through the lateral geniculate nucleus, and mix together to form the receptive fields of cortical neurons (Hirsch, 2003). An essential distinction between ON and OFF neurons is that they signal opposite contrasts: ON neurons signal positive contrasts (brightening), and OFF neurons signal negative contrasts (dimming). The light responses of ON and OFF neurons also show differences in receptive field size, temporal kinetics, maintained firing and noise correlations, presumably the result of being constructed of different interneurons, neurotransmitter receptors, and signaling cascades (Chichilnisky and Kalmar, 2002; Zaghloul et al., 2003; Margolis and Detwiler, 2007; Murphy and Rieke, 2008).
ON and OFF pathways run independently through the retina and consist of separate component neurons but are connected by “cross” circuits. In one such circuit, the ON bipolar cell couples electrically to the AII amacrine cell, which in turn makes glycinergic inhibitory synapses onto the OFF bipolar cell (Fig. 1). It has been known for some time that, under dim (scotopic) illumination, the AII amacrine cell is a necessary conduit of rod signals to both ON and OFF bipolar cells; during bright illumination, the AII amacrine cell is bypassed and cone signals flow directly to ON and OFF bipolar cells (Fig. 1). Recently, however, it was discovered that, during bright illumination, the AII amacrine cell allows the ON bipolar cell to inhibit the OFF bipolar cell and the OFF ganglion cell (Xin and Bloomfield, 1999; Roska and Werblin, 2001; Pang et al., 2007; Manookin et al., 2008). This “cross-inhibition” suppresses anomalous ON responses by the OFF ganglion cell and extends the response range of the OFF ganglion cell (Rentería et al., 2006; Manookin et al., 2008).
Figure 1.

The ON pathway cross-inhibits the OFF pathway via the AII amacrine cell. ON and OFF pathways start at the top of the diagram and continue to the bottom: the cone synapses onto both ON and OFF cone bipolar cells, which provide excitatory glutamatergic inputs (+) to ON and OFF ganglion cells, respectively. A cross-inhibitory circuit goes from left to right: the ON bipolar cell is coupled electrically to the AII amacrine cell, which inhibits (−) the OFF bipolar cell and the OFF ganglion cell. The ON bipolar cell receives feedback inhibition from a GABAergic amacrine cell. Note that, while recording excitatory currents, the inhibitory inputs to the OFF ganglion cell were blocked by voltage clamping at the reversal potential for chloride (Vm = ECl). Synaptic blockers are indicated in red (l-AP4, TPMPA, MFA, strychnine, and CNQX + d-AP5).
Here, we provide evidence that this AII amacrine cross circuit has another important function. We find that, during bright illumination, excitatory currents are less rectified in ON ganglion cells than in OFF ganglion cells; thus, ON cells can signal negative contrasts to some extent. The mechanism for this asymmetrical rectification is that the ON cone bipolar cell through the AII amacrine cell cross-inhibits the OFF bipolar cell and thus brings its set point closer to the threshold for tonic transmitter release, which rectifies its synaptic output onto the OFF ganglion cell. Rectifying the output of the OFF bipolar cell restricts it to signaling negative contrasts and ensures that it does not duplicate the function of the ON bipolar cell, which is to signal positive contrasts. Furthermore, through cross-inhibition, the ON bipolar cell appears to fine-tune the output of the OFF bipolar cell, rendering it more responsive to high frequencies and increasing its gain.
Materials and Methods
Tissue preparation and drugs.
An adult Hartley guinea pig (350–600 g) was anesthetized with ketamine (133 mg/kg), xylazine (13 mg/kg), and pentobarbital (100 mg/kg); both eyes were removed before the animal was killed by anesthetic overdose. All procedures were performed according to University of Pennsylvania and National Institutes of Health guidelines. A ∼1 cm2 piece of upper (dorsal) retina, attached to pigment epithelium, choroid, and sclera, was mounted flat in a chamber and superfused with Ames' medium (Sigma-Aldrich) near 34°C. The Ames' medium was saturated with 95% O2/5% CO2, adjusted to ∼300 mOsm with glucose, and contained the following (in mm): 120 NaCl, 3.1 KCl, 0.5 KH2PO4, 23 NaHCO3, 1.2 MgSO4, 1.15 CaCl2, plus amino acids and vitamins, pH 7.4. 1,2,5,6-Tetrahydropyridin-4-yl methylphosphinic acid (TPMPA) (50 μm; Sigma-Aldrich) was used to block GABAC receptors. Strychnine (2 μm; Sigma-Aldrich) was used to block glycine receptors. l-2-Amino-4-phosphonobutyric acid (l-AP4) (25 μm; Tocris Bioscience) was used to block mGluR6 receptors. 6-Cyano-7-nitroquinoxaline-2,3-dione (CNQX) (40 μm; Sigma-Aldrich) was used to blocked AMPA/kainate receptors, and d-(−)-2-amino-5-phosphonopentanoic acid (d-AP5) (100 μm; Sigma-Aldrich) was used to blocked NMDA receptors. Meclofenamic acid (MFA) (100 μm; Sigma-Aldrich) was used to block gap junctions. All drugs were applied by adding them to the Ames' superfusate.
Recording.
A glass electrode (6–10 MΩ) was formed with a Sutter P-87 puller (Sutter Instrument) and filled with the following (in mm): 110 Cs, 110 gluconate, 10 NaCl, 1 EGTA, 2.5 Na, 10 HEPES, 10 QX-314 (lidocaine N-ethyl bromide), 6 Lucifer yellow, which was adjusted to 310 mOsm with glucose and to pH 7.2 with gluconate. The calculated reversal potential for glutamate channels (Eglut), with equal permeability to Cs+ and Na+, was ∼2 mV, and the calculated reversal potential for Cl− channels equally permeable to Cl− and Br− (GABA, glycine, ECl−) was approximately −49 mV. The holding voltage was corrected for a calculated junction potential of −13 mV but not for voltage errors generated by the access resistance because these errors were small (Ra = 39 ± 5 MΩ; Ihold = −83 ± 28 pA; Va = −3 ± 1 mV). The access resistance limited voltage-clamp frequency to ∼80 Hz, above the ∼20 Hz bandwidth of the recorded signal (fvc = [2πCmRa]−1; Cm = 50 pF). The recordings were acquired with an AxoPatch 200B patch-clamp amplifier (eight-pole Bessel filter; fc = 1 kHz) and digitized at 2 kHz using pClamp 7 (Molecular Devices). The data were then downsampled digitally to 200 Hz and analyzed using IGOR (Wavemetrics).
To record excitatory currents, cells were voltage clamped at ECl (−49 mV), which is the reversal potential of inhibitory currents from amacrine cells, thus nullifying the driving force for inhibitory currents (Freed et al., 2003; Freed, 2005). The accuracy of the voltage clamp was assessed by blocking all inhibitory currents with strychnine and picrotoxin, stimulating with white noise, and then, by voltage clamping at different potentials, determining the reversal potential for excitatory currents. For the cell types examined here, the reversal potential corrected for access voltage (Va) was 0.7 ± 2.2 mV, not statistically different from the calculated Eglut of 2 mV, indicating that the membrane was clamped close to the holding voltage. The holding current at reversal was 68 ± 30 pA, approximately equal in absolute magnitude to the holding currents for our recordings of excitatory currents (−83 ± 28 pA). This suggests similar voltage-clamp errors at reversal and during our recordings, and therefore suggests that during recordings the membrane potential was set close to the holding potential.
Visual stimulus.
The stimulus was provided by a 556 nm light-emitting diode that projected diffusely over the entire ∼1 cm2 piece of retina. The circuitry driving the diode enabled a stimulus time constant of 140 μs. For the white noise stimulus, intensities were chosen at random from a Gaussian distribution at 1 kHz, and then filtered at 100 Hz (four-pole low-pass digital filter). The mean intensity of the stimulus was 3 × 10⁵ photons μm−2 s−1, resulting in a photoisomerization rate of 4.6 × 10⁴ R* s−1 for a rod and 3.3 × 10⁴ R* s−1 for an M cone (λrodmax = 500 nm; λconemax = 529 nm; rod outer segment, 16.2 μm × 3 μm2; cone outer segment, 8 μm × 3 μm2) (Yin et al., 2006). These photoisomerization rates indicate that, for the noncolor opponent ganglion cells recorded here from the upper retina, synaptic input is approximately equally divided between rods and M cone signals (Yin et al., 2006).
Analysis of recordings.
We modeled recorded currents with a linear–nonlinear model consisting of a linear filter and a static nonlinearity (Chichilnisky, 2001) (Fig. 2). This model has proven to accurately replicate synaptic currents in retinal ganglion cells by capturing their strong rectification (Kim and Rieke, 2001; Zaghloul et al., 2003). The filter component of the model is a linear approximation of the time course of these currents, and the static nonlinearity component corrects for nonlinearities including rectification at the synapse. A stimulus of temporally varying intensity s(t) is passed through the filter f(t) to give the linear prediction l(t):
where · denotes convolution. The model then passes the linear prediction through the static nonlinearity n:
where p(t) is the predicted output.
Figure 2.

Measuring gain and rectification from a linear–nonlinear (L–NL) model. The input to the L–NL model is white noise: this passes through two components of the model, a linear filter and a static nonlinearity (middle). The parameters of the model minimize the error between the output of the model and the average of the recorded currents (bottom). Rectification is measured from the static nonlinearity by comparing the range of current signaling the preferred contrast (a) to the total range of current (b) (see Materials and Methods). Gain is measured as the slope of the linear portion of the static nonlinearity (bracket). Note that, in this and subsequent figures, the static nonlinearity of the ON cell is flipped left to right to preserve the convention that an inward (negative) current corresponds to positive contrast.
In practice, the filter was constructed as the cross-correlation of the response and stimulus divided by the autocorrelation of the stimulus:
 |
where S(f) and R(f) are the Fourier transforms of the stimulus and recorded currents, respectively, * denotes the complex conjugate, and 〈…〉 denotes averaging across a series of overlapping 512-point windows incremented by ∼50 points and then across stimulus repetitions.
The static nonlinearity was constructed by graphing the recorded currents parametrically against the linear prediction, binning, and averaging groups of 20 data points that were closest in predicted value (Fig. 2). The data points were fit with a scaled version of the cumulative normal distribution: n(l) = α(βC(l) + γ) + δ, where l represents the values of the linear prediction, C(l) is the cumulative integral of the standard normal distribution; α and δ are a scaling factor and offset, respectively, for the recorded currents; and β and γ are a scaling factor and offset for the predicted currents (Chichilnisky, 2001; Zaghloul et al., 2003). The scaled cumulative normal distribution was used as the static nonlinearity component of the model.
The ability of the model to predict the recorded currents over multiple stimulus repetitions was assessed by calculating the correlation coefficient between the output of the model and the recorded currents, which averaged r = 0.74 ± 0.03 (12 cells). The model was generated from odd-number stimulus repetitions and currents recorded from even-numbered stimulus repetitions. The predictive ability of the model was then compared with that of the current averaged over stimulus repetitions, which is the maximum-likelihood prediction. The correlation between the average current and the recorded currents was r = 0.85 + 0.03. Thus, the model was 86 ± 1% as accurate as the average current at predicting the recorded currents.
There is an ambiguity in two of the components of the model: increasing the amplitude of the filter f(t) or adjusting the slope of the static nonlinearity n(l) by the same amount will not alter the output of the model. To resolve this ambiguity, we scaled the filter so that its output l(t) had the same variance as the stimulus s(t). By normalizing the filter in this consistent way, cell by cell differences in the gain of the model would be reflected in changes in the slope of n(l) (Baccus and Meister, 2002). Therefore, we measured gain as the slope of a line fit to the most linear portion of n(l). In practice, we adjusted the length of a line until it produced the best fit to the static nonlinearity (r > 0.85; number of points >10).
We measured rectification from the static nonlinearity by determining the range of currents devoted to the preferred temporal contrast—positive for ON cells and negative for OFF cells and comparing it with the entire range of currents. Thus, a rectification index was calculated as (a/b − 0.5)/0.5, where a is the range of currents signaling the preferred contrast and b is the entire current range (a and b in Fig. 2). Given this index, a static nonlinearity that was equally divided between the preferred and nonpreferred contrast would have a rectification index of zero, whereas a static nonlinearity that was completely devoted to the preferred contrast would have a rectification index of one.
The power spectrum was calculated as P(f) = 〈R(f)R*(f)〉, with the same windowing as for the filter.
A one-tailed t test for independent values was used when comparing ON versus OFF cells. A one-tailed t test for paired values was used when comparing the same cells under different conditions. An ANOVA was used to compare multiple cell types. Measurements are expressed as mean ± SEM; error bars in all figures represent SEM.
Determination of ON or OFF type.
During recording, Lucifer yellow diffused from the pipette into the cell, and after recording, the cell was photographed as a stack of optical sections through the entire depth of the inner plexiform layer (IPL), using a combination of epifluorescence optics, differential interference contrast optics, and a cooled CCD camera (Hamamatsu Photonics). The depth of the fluorescent dendrites was measured by counting the number of sections between the somas in the inner nuclear and ganglion cell layers. Cells were classified as ON or OFF by depth in the IPL and by the impulse response of their excitatory currents: ON cells were in the inner half of the IPL and had an initially inward (downward) impulse response; OFF cells were in the outer half of the IPL and had an initially outward (upward) impulse response (see Fig. 3C1,C2).
Figure 3.

Excitatory currents in OFF ganglion cells are more rectified than those in ON ganglion cells. A, The stimulus was white noise followed by a constant intensity equal to the average of the white noise. B1, B2, Excitatory currents from ON and OFF ganglion cells, respectively (ON β and G5). The currents are displayed with their baseline subtracted (Ibaseline). Note that the current deflections for the OFF cell are inward (downward) of the steady currents evoked by the mean intensity (Isteady), whereas deflections for the ON cell are both inward and outward of Isteady, indicating that the OFF cell is more rectified than the ON cell. C1, C2, Impulse responses of the same ON and OFF cells. D1, D2, Static nonlinearities from the same ON and OFF ganglion cells. Note that the static nonlinearity for the OFF cell is more curved than that for the ON cell. The result is that almost the entire range of currents from the OFF ganglion cell is restricted to signaling negative contrast, but the currents from the ON ganglion cell are more evenly divided between positive and negative contrasts, confirming that the OFF cell is more rectified than the ON cell. n(0) is the current associated with zero contrast. E (top right of figure), Rectification index measured from static nonlinearities of 31 ON cells (15 ON β, 16 G2) and 33 OFF cells (7 OFF β, 20 G5, 6 LED). Error bars indicate SEM.
Results
Excitatory currents in OFF ganglion cells are more rectified than those in ON ganglion cells
We recorded excitatory currents from ganglion cells, choosing small cells for best voltage-clamp control (cell body diameter <25 μm; dendritic field diameter <250 μm) (see Materials and Methods). The ON cells included ON β cell and the G2 cell of Rockhill et al. (2002); the OFF cells included the OFF β cell and the G5 cell of Rockhill et al. Some cells could be categorized as ON or OFF but were otherwise unclassified, as will be noted. The G5 was selected for experiments that required application of several different drugs (see Figs. 6, 8–10) because this cell type yielded particularly long and stable recording (typically 40 min). The local-edge cell was included with OFF cells because the ON component of their excitatory input drops out at high temporal frequencies (van Wyk et al., 2006). As a result, broad-spectrum white noise evokes a clear OFF response (Devries and Baylor, 1997; Zeck et al., 2005). By choosing small cells, we excluded the α and δ types (Boycott and Wässle, 1974; Cleland and Levick, 1974; Berson et al., 1998).
Figure 6.

Blocking glycinergic synapses has effects on excitatory currents in OFF ganglion cells that are similar to those of blocking the ON bipolar cell (compare with Fig. 5). A, Excitatory currents from an OFF ganglion cell in control conditions and with strychnine. Note that some current deflections fail to return to the baseline when strychnine is applied, consistent with a decrease in rectification (arrows). B, Static nonlinearities from same cell. Inset, Strychnine straightened the static nonlinearity and reduced rectification. C, Strychnine reduced rectification in most cells (10 G5). D, The effect of strychnine on gain was inconsistent. E, Power spectra of excitatory currents: strychnine reduced power at high frequencies and increased power at low frequencies. F, Strychnine reduced the middle frequency of the power spectrum for most cells.
Figure 8.

Augmenting the response of the ON bipolar cell increases rectification, increases gain, and reduces the middle frequency of excitatory currents in OFF ganglion cells. A, Excitatory currents from an OFF ganglion cell in control conditions and with TPMPA. Some current deflections returned to the baseline when TPMPA was applied, consistent with an increase in rectification (arrows). B, Static nonlinearities from the same cell. TPMPA increased the slope of the linear portion. Inset, TPMPA made the static nonlinearity more curved, consistent with an increase in gain and in rectification. C, Most cells lie above the diagonal, indicating that TPMPA increased rectification (13 G5, 2 unclassified). D, TPMPA increased gain in all cells. E, TPMPA decreased power at all frequencies. Inset, Spectra normalized to peak power show that TMPA decreased power at high frequencies more than at low frequencies. F, TPMPA reduced the middle frequency of the power spectrum for almost all cells. Note: The four red cells in C and F were subjected to additional control experiments (Fig. 9).
Figure 9.

Control experiments to confirm that the effect of TPMPA on the rectification of OFF ganglion cells depends on the ON bipolar cell. A, Excitatory currents from OFF ganglion cell in control conditions, in TPMPA, and then with the ON bipolar cell hyperpolarized by adding l-AP4 to TPMPA. Some current deflections return to the baseline when TPMPA is applied, but fail to do so when l-AP4 is added, consistent with an increase, and then a decrease in rectification (arrows). B, TPMPA increased gain in all cells, but adding l-AP4 to TPMPA decreased gain (4 G5 cells; the dashed lines connect the same cells under different conditions). C, TPMPA made the static nonlinearity more curved and thus increased rectification, but adding l-AP4 to TPMPA straightened the static nonlinearity and thus decreased rectification. D, Effect of drugs on rectification. Most cells are above the diagonal for TPMPA but go below it when l-AP4 is added to TPMPA, suggesting that l-AP4 blocked the effect of TPMPA.
Figure 10.

Blocking ON bipolar cells or glycine receptors suppresses the effect of TPMPA on the frequency response of OFF ganglion cells. A1, Power spectra of excitatory currents from an OFF ganglion cell (G5) normalized by the peak power. TPMPA shifted power to low frequencies. A2, Adding l-AP4 beforehand to block the ON bipolar cell reduced the effect of TPMPA on frequency response. A3, A plot of change in middle frequency attributable to TPMPA with l-AP4 added beforehand against the change attributable to TPMPA alone (4 G5 cells). Cells lie near 100% when l-AP4 is added beforehand, but between 70 and 90% without l-AP4, indicating that l-AP4 prevents TPMPA from reducing middle frequency. B1, Power spectra of excitatory currents from another OFF ganglion cell (G5) show that TPMPA shifted power to low frequencies. B2, Adding strychnine beforehand to block glycine receptors reduced the effect of TPMPA on frequency response. B3, A plot of change in middle frequency attributable to TPMPA with strychnine added beforehand against the change attributable to TPMPA alone (6 G5 cells, 1 unclassified). Cells lie near 100% when strychnine is added beforehand, but between 70 and 90% without strychnine, indicating that strychnine prevents TPMPA from reducing middle frequency.
The stimulus had equal intensity across the retina and extended beyond a ganglion cell receptive field. The first 10 s of the stimulus was white noise (SD/mean = 0.2) followed by 5 s of constant intensity equal to the mean intensity of the white noise (Fig. 3A). The stimulus was repeated 20–30 times. The white noise evoked a series of inward and outward current deflections; the following constant intensity evoked a steady current (Isteady). For OFF cells, the deflections were mostly inward and returned to a common baseline that was very close to the steady current (Ibaseline − Isteady = 6 ± 3 pA; seven cells) (Fig. 3B2). For ON cells, however, the deflections were both inward and outward from the steady current, although there was an outward limit to these deflections that formed a baseline farther from the steady current (Ibaseline − Isteady = 47 ± 19 pA; nine cells; p < 0.05 for ON vs OFF) (Fig. 3B1).
To see how positive and negative currents deflections were related to temporal contrast, we constructed static nonlinearities, which are plots of current versus neural contrast (Chichilnisky, 2001) (see Materials and Methods). Neural contrast was defined as the output of a linear filter but changed in sign for the ON cell to keep the convention that ON cells respond to positive contrast. The value of the static nonlinearities at zero contrast is termed n(0). For ON cells, static nonlinearities exhibited inward deflections from n(0) for positive contrasts and outward deflections from n(0) for negative contrasts (Fig. 3D1). Yet significantly for OFF cells, the static nonlinearities exhibited inward deflections from n(0) for negative contrasts but limited outward deflections from n(0) for positive contrasts (Fig. 3D2). Thus, excitatory currents from OFF cells were virtually restricted to signaling negative contrasts and were more rectified than those from ON cells.
To quantify rectification from the static nonlinearity, we calculated how much of the entire range of currents was devoted to signaling the preferred contrast—positive for ON cells and negative for OFF cells—and then summarized the result with a rectification index (see Materials and Methods). By this index, OFF cells showed significantly greater rectification than ON cells; among ON cells, the ON β showed less rectification than the G2, but either ON β or G2 showed significantly less rectification than any of the OFF cell types (ANOVA; rectification index, 0.81 ± 0.02 for 33 OFF cells vs 0.59 ± 0.05 for 31 ON cells; p < 0.01) (Fig. 3E).
A low rate of tonic transmitter release rectifies excitatory currents in OFF ganglion cells
We hypothesized that excitatory inputs to OFF ganglion cells are more rectified than those onto ON cells because of a lower rate of transmitter release at zero contrast (i.e., a lower rate of tonic release). Thus, for OFF cells, transmitter release could increase to signal negative contrasts but could not decrease to signal positive contrasts, whereas for ON cells transmitter release could increase to signal positive contrasts and decrease to signal negative contrasts.
To test this, we measured the tonic current attributable to tonic transmitter release, using the glutamate receptors on the ganglion cell as sensors for transmitter release. First, we measured steady current under control conditions (Isteady). For ON cells, we curtailed transmitter release with l-AP4, and for OFF cells, we blocked glutamate receptors with CNQX plus d-AP5, and measured the steady current again (I0). The value of I0 is a measure of the current associated with zero release, and thus the difference between Isteady and I0 is a measure of the tonic current attributable to tonic release (Itonic = Isteady − I0) (Fig. 4B,D). The result was that OFF ganglion cells exhibited less tonic current than ON ganglion cells, suggesting less tonic transmitter release (Itonic = −9 ± 4 pA for seven OFF cells; −48 ± 17 pA for eight ON cells; p = 0.05) (Fig. 4E). In four of these eight ON cells, I0 was also measured with CNQX plus d-AP5 to block glutamate receptors, and its value was not different from I0 measured using l-AP4 (difference = 1 ± 2 pA; p = 0.60).
Figure 4.
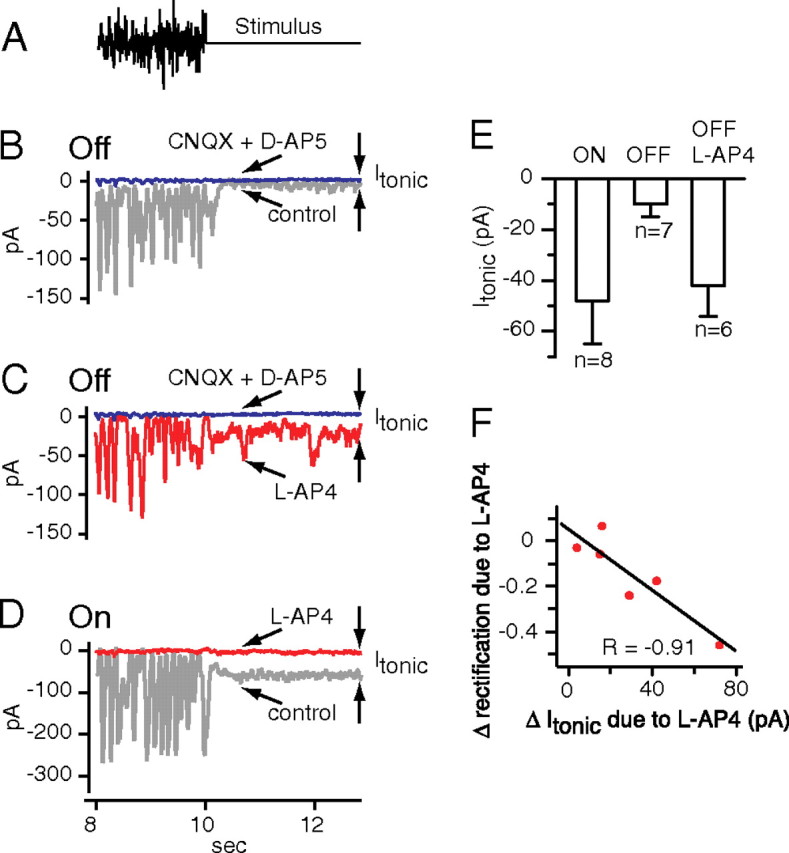
Effect of hyperpolarizing the ON bipolar cell on tonic excitatory currents from OFF ganglion cells. A, The stimulus: white noise followed by steady mean intensity. B, Excitatory currents from an OFF ganglion cell (type G5) include current deflections evoked by the white noise and a steady current evoked by the mean intensity. Blocking glutamate receptors with CNQX plus d-AP5 reduced steady current very little, indicating a small tonic current. C, Same OFF cell as in B. Hyperpolarizing the ON bipolar cell with l-AP4 increased tonic current. D, Excitatory currents from an ON ganglion cell (type G2). Hyperpolarizing ON bipolar cells with l-AP4 substantially reduced the steady currents, indicating a larger tonic current than for the OFF cell in B. E, Tonic currents measured for ON and OFF cells, and for OFF cells during the application of l-AP4 (ON cells: 5 G2, 3 unclassified; OFF cells: 6 G5, 1 LED). Error bars indicate SEM. F, When the ON bipolar cell was hyperpolarized with l-AP4, OFF cells showed an increase in tonic current that was correlated with a decrease in rectification (6 G5 cells).
As we observed before for both ON and OFF cells, excitatory currents were limited at their most outward extent to a baseline (Fig. 3B1,B2). We found that, when receptors were blocked or transmitter release curtailed, the resulting steady current was very close to this baseline (Fig. 4B–D), indicating that, when a deflection returns to baseline, transmitter release was minimal (Ibaseline − I0 = −7 ± 4 pA for three OFF cells; −8 ± 8 pA for eight ON cells; average for ON and OFF cells, −8 ± 7 pA). Thus, the white noise stimulus apparently modulated transmitter release deeply enough that release was virtually halted for short intervals of time.
Blocking the ON bipolar cell reduces rectification of excitatory currents in OFF ganglion cells
The ON bipolar cell couples electrically with the AII amacrine cell, which in turn makes glycinergic synapses onto the OFF bipolar cell (Fig. 1). We hypothesized that this circuit allows the ON bipolar cell to hyperpolarize the OFF bipolar cell to the threshold for transmitter release, limiting its tonic release of transmitter and rectifying its output. If so, hyperpolarizing the ON cone bipolar cell should depolarize the OFF cone bipolar cell above the threshold for transmitter release, thus increasing tonic transmitter release and decreasing rectification at excitatory inputs to OFF ganglion cells.
To test this, we recorded excitatory currents in OFF ganglion cells, and then hyperpolarized the ON bipolar cell with l-AP4. l-AP4 significantly increased tonic current from −10 ± 5 to −42 ± 12 pA, indicating an increase in tonic transmitter release (six cells; p = 0.03) (Fig. 4C,E). l-AP4 also decreased rectification significantly in all cells tested from 0.73 ± 0.06 to 0.47 ± 0.06 (12 cells; p < 0.01) (Fig. 5A,C,D). Washing away l-AP4 returned rectification to normal, with no significant difference between wash and control (0.75 ± 0.12; five cells; p = 0.63). Furthermore, the decrease in rectification was negatively correlated with the increase in tonic current, supporting the idea that the rectification decrease was attributable to an increase in tonic current (r = −0.91) (Fig. 4F). Apparently, under control conditions, the ON bipolar cell minimizes tonic transmitter release from the OFF bipolar cell and thus rectifies excitatory currents in the OFF ganglion cell.
Figure 5.
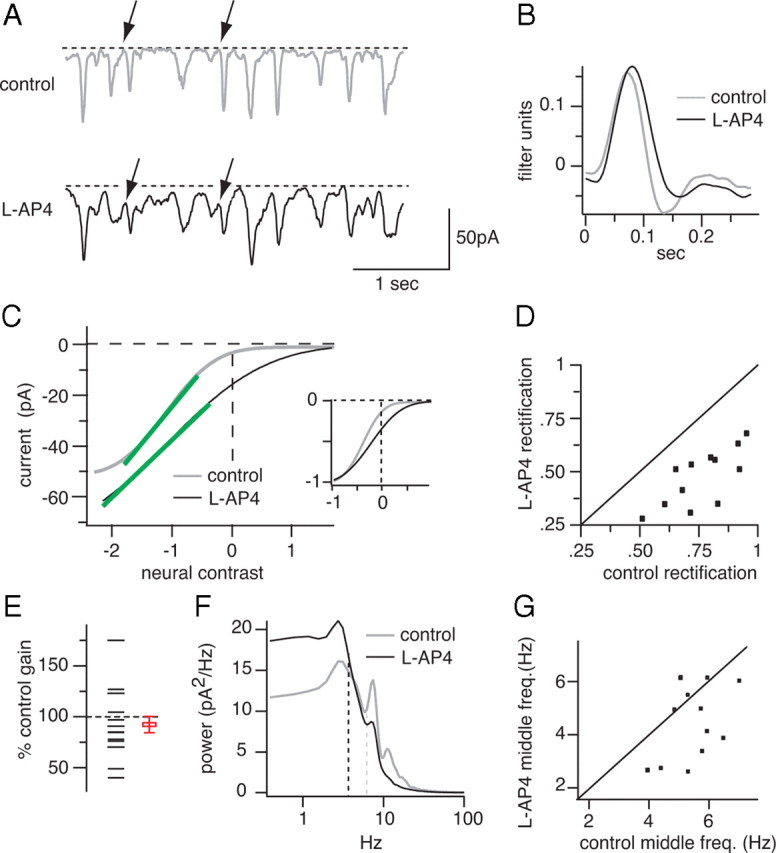
Blocking the ON bipolar cell reduces rectification, gain, and the middle frequency of excitatory currents from OFF ganglion cells. A, Excitatory currents evoked by white noise from an OFF ganglion cell in control conditions and with l-AP4. Some current deflections fail to return to the baseline when l-AP4 is applied, consistent with a decrease in rectification (arrows). l-AP4 elongates current deflections. B, l-AP4 elongated the impulse response, consistent with elongated current deflections in A. C, Static nonlinearities from the same cell. The slope of the linear portion decreases, indicating a gain decrease (green lines). The inset shows static nonlinearities scaled to match current and contrast ranges. l-AP4 straightened the static nonlinearity and reduced rectification. D, Plot of rectification index in l-AP4 against rectification index in control conditions; each data point is a cell. All data points lie below the diagonal; thus, l-AP4 reduced rectification in all cells (2 OFF β, 10 G5). E, l-AP4 reduced gain in most cells. In this and subsequent figures, the open square and error bar shows the mean and SEM. F, Power spectra of excitatory currents: l-AP4 reduced power at high frequencies and increased power at low frequencies. Frequency response was measured by finding a middle frequency that had equal power above and below (dashed vertical lines). G, A plot of middle frequency with l-AP4 against middle frequency in control conditions. Most cells lie below the diagonal, indicating a decrease in middle frequency.
Blocking the ON bipolar cell decreases gain and slows excitatory currents in OFF ganglion cells
Cross-inhibition from ON bipolar cells and excitation from cones converge onto most OFF bipolar cells (Molnar and Werblin, 2007). This combination of ON inhibition and OFF excitation should increase the gain compared with the gain of either input alone. Therefore, blocking ON bipolar cells should reduce the gain of the responses of most OFF bipolar cells and thus should reduce the gain of excitatory currents in their postsynaptic OFF ganglion cells (Fig. 1). To test this, we recorded excitatory currents from OFF ganglion cells and then applied l-AP4. Gain was measured as the slope of the linear part of the static nonlinearity (see Materials and Methods). As expected, most cells (8 of 12) showed a gain decrease (Fig. 5E).
ON cells have measurably faster response kinetics than OFF (Chichilnisky and Kalmar, 2002) and might impart these kinetics to OFF bipolar cells through cross-inhibition. Thus, blocking cross-inhibition might decrease the high-frequency response of the OFF bipolar cell. To measure frequency content, we calculated the power spectra of excitatory currents recorded from OFF ganglion cells (see Materials and Methods). As expected, l-AP4 increased power at low frequencies and decreased power at high frequencies (Fig. 5F). Also, l-AP4 elongated the impulse response from 118 ± 7 to 130 ± 13 ms, consistent with a slowing of the response of the OFF bipolar cell (time to first zero crossing after t = 0; p = 0.06) (Fig. 5B).
To quantify changes in frequency content, we calculated the middle frequency that divided the integral of the power spectrum into two equal areas. l-AP4 reduced middle frequency significantly in 9 of 12 cells; averaged for all cells, middle frequency declined significantly from 5.6 ± 0.2 to 4.6 ± 0.4 Hz (p < 0.01) (Fig. 5G). Washing away l-AP4 returned middle frequency to normal (five cells; control, 5.4 ± 0.7 Hz; wash, 5.1 ± 0.4 Hz; p = 0.4). Apparently, under control conditions, the ON cone bipolar cell shifts the output of OFF bipolar cells to higher frequencies.
Blocking glycinergic synapses has effects similar to blocking the ON bipolar cell
If the ON bipolar cell rectifies the output of the OFF bipolar cell via the AII amacrine cell, then blocking the synapse between the AII amacrine cell and the OFF bipolar cell should have effects similar to those of blocking the ON bipolar cell (Fig. 1). To test this, we recorded excitatory currents from OFF ganglion cells, and then blocked glycine receptors with its antagonist strychnine. Strychnine reduced the rectification index significantly from 0.76 ± 0.03 to 0.66 ± 0.07 and reduced the middle frequency from 6.5 ± 0.3 to 5.1 ± 0.4 Hz (10 cells; p < 0.01) (Fig. 6). However, only one-half of the cells (5 of 10) showed a gain decrease, slightly different from l-AP4 for which most cells (8 of 12) showed a gain decrease. Possibly strychnine has an inconsistent effect because it blocks inhibition from the AII and from an additional 40% of the total amacrine population that is glycinergic and that may have various functions in the retina circuit (MacNeil and Masland, 1998; Menger et al., 1998). Except for this difference, however, blocking glycinergic synapses had effects that were similar to blocking the ON bipolar cell, consistent with the idea that the ON bipolar cell rectifies excitatory currents in the OFF ganglion cell via the AII amacrine cell.
Augmenting the response of the ON bipolar cell rectifies the output of the OFF bipolar cell and shifts it to lower frequencies
If blocking the ON bipolar cell decreases rectification at the output of the OFF bipolar cell, then augmenting the response of the ON bipolar cell should have the opposite effect. Figure 7 shows that TPMPA augments excitatory currents in ON ganglion cells, presumably by blocking inhibitory GABAC feedback onto ON bipolar cells and augmenting signals in the ON bipolar cell. Thus, we recorded excitatory currents from OFF ganglion cells, and then augmented the signals of the ON bipolar cell with TPMPA. TPMPA increased the rectification index significantly from 0.73 ± 0.05 to 0.83 ± 0.05, increased gain significantly to 150 ± 10% of control value, and decreased middle frequency significantly from 5.9 ± 0.4 to 4.6 ± 0.4 Hz (15 cells; p < 0.01) (Fig. 8).
Figure 7.

TPMPA augments excitatory currents in ON ganglion cells. A, Excitatory currents from an ON ganglion cell in control conditions and with TPMPA. B, Static nonlinearities from the same cell: TPMPA increased the slope of the linear portion, indicating an increase in gain. Inset, Scaling nonlinearities brings them into register, indicating no change in rectification. C, Most cells lie near the diagonal, indicating TPMPA caused no consistent change in rectification (5 ON β, 5 G2). D, TPMPA increased gain in most cells. E, Power spectra of excitatory currents: TPMPA increased power at all frequencies but increased power at low frequencies more, as shown by the normalized spectra in the inset. F, TPMPA reduced the middle frequency of the power spectrum for most cells.
Augmenting ON bipolar cell signals with TPMPA and blocking them with l-AP4 had opposite effects on rectification and gain at the output of the OFF bipolar cell. Yet both TPMPA and l-AP4 reduced high-frequency content. This is seemingly paradoxical, but TPMPA removes high frequencies from the signals coming from the ON bipolar cell, which should remove high frequencies from cross-inhibition to the OFF bipolar cell (Fig. 7E,F). l-AP4 has the same effect because it abolishes this cross-inhibition and thus removes a source of high frequencies.
If the effect of TPMPA on OFF bipolar cells is mediated by cross-inhibition, then it should be blocked by blocking the ON bipolar cell. To test this, we recorded excitatory currents from OFF cells, and then applied TPMPA as before, but then added l-AP4 to block the ON bipolar cell. Rectification increased to 116 ± 8% of control values in TPMPA, but then decreased to 69 ± 4% of control values in l-AP4 (four cells) (Fig. 9D). Gain first increased with TPMPA to 137 ± 17% of control value, but then decreased with l-AP4 to 88 ± 15% of control value (Fig. 9B), suggesting that the effects of TPMPA on the OFF bipolar cell depend on cross-inhibition.
The ON cone bipolar cell alters the frequency response of the OFF cone bipolar cell
We have shown that TPMPA shifts the output of the OFF bipolar cell toward lower frequencies. This could be an indirect effect of TPMPA via the ON bipolar cell and cross-inhibition or it could be a direct effect of TPMPA on the OFF bipolar cell (Fig. 1). To test this, we applied TPMPA alone or with l-AP4 applied beforehand to block the ON bipolar cell (Fig. 10A1,A2). TPMPA alone reduced the middle frequency to 85 ± 4% of control, but with l-AP4 beforehand it had no effect (to 101 ± 4% of control; p < 0.05; four cells) (Fig. 10A3). This result indicates that the ON cone bipolar cell can alter the frequency response of the OFF cone bipolar cell indirectly via cross-inhibition.
If the effect of the ON cone bipolar cell on the frequency response of the OFF cone bipolar cell is mediated by cross-inhibition, then it should be blocked when the glycinergic synapses are blocked (Fig. 1). To test this, we applied TPMPA alone or with strychnine applied beforehand to block glycinergic synapses (Fig. 10B1,B2). When applied alone, TPMPA reduced the middle frequency to 81 ± 3% of control, but when strychnine was added beforehand it had significantly less effect (to 97 ± 2% of control; p < 0.01; seven cells) (Fig. 10B3). This result confirmed that the ON cone bipolar cell can alter the frequency response of the OFF cone bipolar cell indirectly through cross-inhibition. It surprised us that TPMPA worked through the ON bipolar cell and through cross-inhibition and apparently had no observable direct effect on the OFF bipolar cell, but this may be explained by a higher density of GABAC receptors on the ON bipolar cell than on the OFF bipolar cell (Wässle et al., 1998; Sagdullaev et al., 2006; Eggers et al., 2007).
The effect of blocking the ON bipolar cell depends on gap junctions
The ON bipolar cell couples electrically with the AII amacrine cell by means of gap junctions (Fig. 1). If the ON bipolar cell rectifies the output of OFF bipolar cell via the AII amacrine cell, then when gap junctional conductance is reduced, l-AP4 should be less able to reduce rectification in OFF cells. Although a blocker specific to the ON bipolar→AII gap junction is presently unavailable, MFA suppresses the conductance of gap junctions throughout the retina, including those between the ON bipolar and the AII amacrine cells (Pan et al., 2007; Manookin et al., 2008; Veruki and Hartveit, 2009). Thus, we recorded excitatory currents from six OFF ganglion cells and then applied l-AP4 alone or with MFA beforehand. As expected, l-AP4 alone decreased the rectification ratio to 72 ± 5% of control, but when MFA was applied beforehand, l-AP4 had significantly less effect (95 ± 2% of control; p < 0.01) (Fig. 11). Thus, the effect of blocking the ON bipolar cell, which is to reduce rectification OFF cells, depends on conductive gap junctions.
Figure 11.
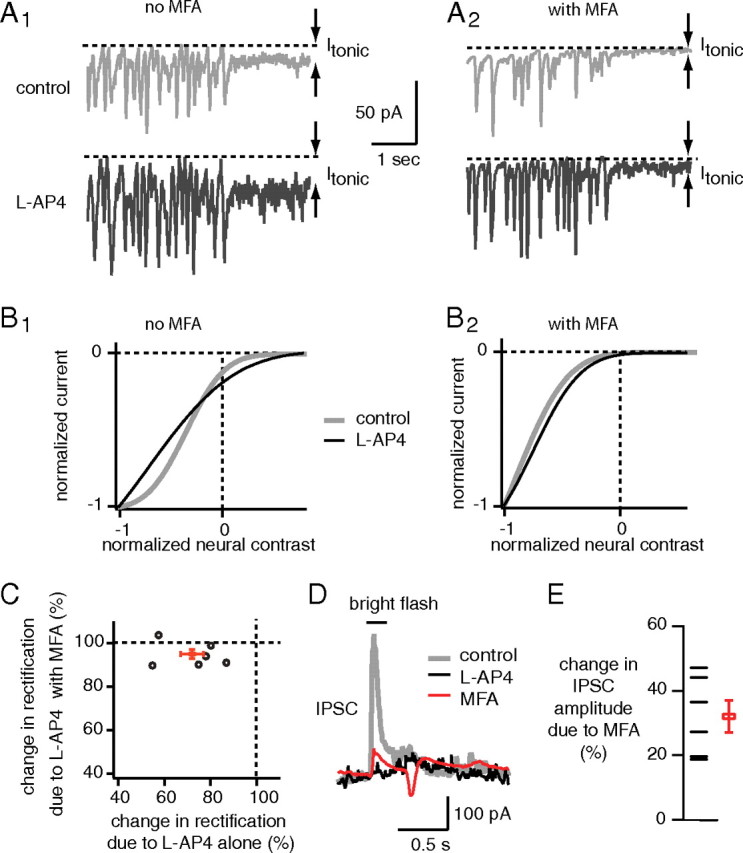
The effect on the OFF ganglion cell of blocking the ON bipolar cell depends on gap junctions. A1, A2, Excitatory currents from an OFF ganglion cells (G5). l-AP4 alone increased tonic current (Itonic) (A1), but not when MFA was added beforehand (A2). Note that MFA alone reduced tonic current (compare control traces in A1 and A2). B1, B2, l-AP4 alone straightened out the static nonlinearity (B1) but not when MFA was added beforehand (B2). C, A plot of percentage change in rectification attributable to l-AP4 with MFA added beforehand against the change attributable to l-AP4 alone. Most cells (1 LED, 4 G5, 1 unclassified) lie near 100% when MFA is applied beforehand, but between 50 and 90% without MFA, indicating that MFA hampers l-AP4 from changing rectification index. D, IPSCs evoked by light flash (200 ms) from an OFF ganglion cell (G5; membrane voltage clamped at 0 mV ≈ Eglut). l-AP4 suppressed the IPSC because it blocked the ON bipolar cell (Fig. 1). MFA suppressed the IPSC, suggesting that it substantially blocks the gap junction between the ON cone bipolar and the AII amacrine cell (Manookin et al., 2008). E, Summary of effect of MFA on peak amplitude of IPSC (2 LED, 3 G5, 1 unclassified).
The AII inhibits OFF ganglion cells directly in addition to inhibiting the OFF bipolar cell. If MFA suppresses the ON bipolar-AII amacrine cell gap junction, MFA should prevent signals from reaching the AII amacrine cell and thus should suppress this direct inhibition. (Manookin et al., 2008) (Fig. 1). To test this idea, we recorded IPSCs from six OFF cells by voltage clamping at the reversal potential for excitatory currents. MFA reduced the ON IPSC amplitude to 32 ± 5% of control, indicating that MFA suppressed conductance of the ON bipolar–AII amacrine cell gap junction. MFA alone always increased rectification of excitatory currents in OFF ganglion cells (six of six), usually decreased its middle frequency (five of six), and always increased gain (six of six) (data not shown). These effects of MFA alone may be attributable to blocking gap junctions throughout retinal circuitry (Pan et al., 2007). Possibly because of the widespread effects of MFA on retinal circuitry, MFA beforehand caused l-AP4 to have inconsistent effects on the gain and middle frequency of excitatory currents from OFF ganglion cells (data not shown).
Discussion
The ON bipolar cell rectifies the output of the OFF bipolar cell, increases its gain, and increases its response to high frequencies
The circuit diagram of Figure 1 and our results help explain how the ON bipolar cell modifies excitatory currents in the OFF ganglion cell, setting their rectification, gain, and frequency response. Rectification is explained by considering the circuit resting at equilibrium during a constant light intensity: the ON cone bipolar cell sends current to the AII amacrine cell through gap junctions, depolarizing it, causing it to release glycine onto the OFF cone bipolar cell. This inhibition hyperpolarizes the OFF cone bipolar cell to near the threshold for glutamate release. Thus, when dynamic stimulation begins, such as the white noise stimulus used here, dimming depolarizes the OFF bipolar cell and increases its release of glutamate, but brightening hyperpolarizes the OFF bipolar cell below threshold and fails to decrease release. The inability of the OFF bipolar cell to decrease release rectifies excitatory currents in the OFF ganglion cell.
How the ON bipolar cell increases the gain of excitatory currents in some OFF ganglion cells is explained by considering that the ON cone bipolar cell, via the AII amacrine cell inhibits some OFF cone bipolar cells (Molnar and Werblin, 2007): for these cells, brightening causes an increase in inhibition at the same time that the cone withdrawals excitation; dimming causes a withdrawal of inhibition at the same time that the cone increases excitation. A similar “push–pull” circuit has been described previously for the excitatory and inhibitory synaptic inputs to ganglion cells, and for differential electronic circuits, and is known to increase gain (Belgum et al., 1987; Molnar et al., 2009). Increasing the gain of signals in the OFF bipolar cell increases the gain of excitatory currents in the OFF ganglion cell.
How the ON bipolar cell increases the frequency response of excitatory currents in OFF ganglion cells is explained because the output of the ON cone bipolar cell is modified by GABAC feedback, which has slow kinetics (Eggers and Lukasiewicz, 2006). Thus, the feedback filters out low frequencies, causing the ON cone bipolar cell to have a high-pass output (Freed et al., 2003). The resulting high frequencies are transmitted via the AII amacrine cell to the OFF cone bipolar cell and then to excitatory currents in the OFF ganglion cell.
AII amacrine cell mediates ON to OFF cross-rectification
There are many glycinergic amacrine cell types that send their dendrites to both ON and OFF sublamina, which could transmit signals from ON bipolar to OFF pathways (Strettoi et al., 1992; MacNeil and Masland, 1998; Menger et al., 1998; MacNeil et al., 2004). Among them, the AII amacrine cell is the most likely to mediate cross-inhibition and rectification from ON to OFF pathways for multiple reasons. First, the AII is the most common amacrine cell in mammalian retina, comprising ∼13% of the total population (MacNeil and Masland, 1998) and ∼20–30% of the glycinergic amacrine cells (Menger et al., 1998). Second, the AII cell is electrically coupled to ∼80% of ON cone bipolar cells, a coupling that is not altered by light or dark adaptation (Pang et al., 2007; Petrides and Trexler, 2008). Third, originally the AII amacrine cell was proposed to be inoperable under photopic conditions (Smith et al., 1986; Mills and Massey, 1995) and to be confined to transmitting rod signals under scotopic conditions to both ON and OFF pathways, as part of the following circuit: rod→rod bipolar cell→AII amacrine cell→ON and OFF cone bipolar cells. Yet the AII has been shown to operate in bright light (Nelson, 1977; Dacheux and Raviola, 1986; Xin and Bloomfield, 1999) and to carry signals between ON and OFF pathways under photopic conditions (Manookin et al., 2008). Finally, our experiments show that the derectifying effect of blocking the ON bipolar cell depends on gap junctions (Fig. 11) and strongly suggest that the AII amacrine cell mediates cross-rectification of the OFF bipolar cell by the ON bipolar cell.
The balance of inhibition and excitation maintains asymmetrical rectification at two sequential stages
We have focused on the following circuit: ON bipolar cell→AII amacrine→OFF cone bipolar→OFF ganglion cell, but there is also the more direct circuit ON bipolar cell→AII amacrine→OFF ganglion cell (Fig. 1). This direct circuit provides ON reinforcing inhibition that participates with excitation from OFF bipolar cells in a push–pull circuit (Manookin et al., 2008). Thus, the AII amacrine cell participates in two push–pull circuits in sequence, both part of the OFF pathway: one that impinges on the OFF bipolar cell and another that impinges on the OFF ganglion cell. The advantage of a push–pull circuit is that it can increase gain, as mentioned already, but it can also linearize the membrane potential and removes distortion introduced by rectification at synapses (Molnar et al., 2009). A push–pull circuit does not, however, necessarily linearize the final output of the neuron: the outputs of both OFF bipolar cell and OFF ganglion cell are clearly rectified and thus nonlinear (Zaghloul et al., 2003).
OFF bipolar and OFF ganglion cells have rectified outputs because inhibition from the AII amacrine cell combines with excitation to bring their membrane voltage close to a threshold. For the OFF bipolar cell, the threshold is for glutamate release; for the OFF ganglion cell, the threshold is for spiking. The OFF ganglion cell may require inhibition to “squelch” firing because, unlike the ON ganglion cell, without synaptic input the OFF ganglion cell fires spontaneously (Margolis and Detwiler, 2007). By setting membrane potential toward threshold in each circuit, the AII ensures that the output of the OFF bipolar cell is more rectified than that of the ON bipolar cell and that the spike train of the OFF ganglion cell is more rectified than that of the ON ganglion cell (Zaghloul et al., 2003). Thus, it appears that the asymmetrical rectification of ON and OFF pathways is attributable to inhibitory input from the AII amacrine cell balancing excitatory input in the context of a push–pull circuit.
Asymmetrical rectification may equalize contrasts between ON and OFF pathways
Why are inhibitory and excitatory inputs so carefully balanced to provide more rectification in the OFF than the ON pathway? The answer may lie in the distribution of light intensities in natural scenes, which is negatively skewed and thus has a preponderance of intensities below the mean (Brady and Field, 2000). When filtered by bipolar receptive fields, there is a greater number of negative contrasts (dimming) than positive contrasts (brightening) (Burkhardt et al., 2006). If contrasts are to be apportioned equally between ON and OFF pathways, thus ensuring that ON and OFF pathways convey equal amount of information, the ON bipolar cell should respond to some negative contrasts in addition to its complement of positive contrasts, and the OFF bipolar cell should be restricted to negative contrasts. Apparently the ability of the AII amacrine circuit, which allows the ON bipolar cell to rectify the output of the OFF bipolar cell, and thus limit its signaling to negative contrasts, is a subtle but important element of retinal design.
Rectification of ON and OFF signals may reduce the cost of visual processing
Without rectification, a single visual neuron could signal both positive and negative contrasts. Avoiding rectification would reduce distortion and might obviate the need for complex push–pull circuits to relinearize membrane potentials. This raises the question: what is the value of having two separate rectified pathways when one large linear pathway might do the job? The answer may be to reduce spike rate. A neuron whose spike train signaled both positive and negative contrasts would require a high spike rate at zero contrast. Instead, positive and negative contrasts are apportioned between ON and OFF pathways (with some negative contrasts for the ON pathway). The result is that, for natural and white noise stimulation, both ON and OFF cells fire in bursts separated by quiescent periods: thus, there is little “spontaneous” or “background” firing under natural stimulation (Meister and Berry, 1999; Koch et al., 2004, 2006). Since most natural stimuli have temporal contrasts concentrated near zero (Brady and Field, 2000), where spike rate is low (Zaghloul et al., 2003), linking a low spike rate to low contrast saves spikes. Similarly, glutamate release at the bipolar→ganglion cell synapse is bursty and typically quiescent near zero temporal contrast, which apparently saves glutamate (Freed, 2005). Saving either spikes or glutamate may be energetically important, because spiking and glutamatergic synaptic transmission use ∼40% of the total ATP requirements of the nervous system [Howarth et al. (2010), with correction from Alle et al. (2009)].
Footnotes
This work was supported by National Eye Institute Grant EY-013333 (M.A.F.).
References
- Alle H, Roth A, Geiger JR. Energy-efficient action potentials in hippocampal mossy fibers. Science. 2009;325:1405–1408. doi: 10.1126/science.1174331. [DOI] [PubMed] [Google Scholar]
- Baccus SA, Meister M. Fast and slow contrast adaptation in retinal circuitry. Neuron. 2002;36:909–919. doi: 10.1016/s0896-6273(02)01050-4. [DOI] [PubMed] [Google Scholar]
- Belgum JH, Dvorak DR, McReynolds JS, Miyachi E. Push-pull effect of surround illumination on excitatory and inhibitory inputs to mudpuppy retinal ganglion cells. J Physiol. 1987;388:233–243. doi: 10.1113/jphysiol.1987.sp016612. [DOI] [PMC free article] [PubMed] [Google Scholar]
- Berson DM, Pu M, Famiglietti EV. The zeta cell: a new ganglion cell type in cat retina. J Comp Neurol. 1998;399:269–288. doi: 10.1002/(sici)1096-9861(19980921)399:2<269::aid-cne9>3.0.co;2-z. [DOI] [PubMed] [Google Scholar]
- Boycott BB, Wässle H. The morphological types of ganglion cells of the domestic cat's retina. J Physiol. 1974;240:397–419. doi: 10.1113/jphysiol.1974.sp010616. [DOI] [PMC free article] [PubMed] [Google Scholar]
- Brady N, Field DJ. Local contrast in natural images: normalisation and coding efficiency. Perception. 2000;29:1041–1055. doi: 10.1068/p2996. [DOI] [PubMed] [Google Scholar]
- Burkhardt DA, Fahey PK, Sikora MA. Natural images and contrast encoding in bipolar cells in the retina of the land- and aquatic-phase tiger salamander. Vis Neurosci. 2006;23:35–47. doi: 10.1017/S0952523806231043. [DOI] [PubMed] [Google Scholar]
- Chichilnisky EJ. A simple white noise analysis of neuronal light responses. Network. 2001;12:199–213. [PubMed] [Google Scholar]
- Chichilnisky EJ, Kalmar RS. Functional asymmetries in ON and OFF ganglion cells of primate retina. J Neurosci. 2002;22:2737–2747. doi: 10.1523/JNEUROSCI.22-07-02737.2002. [DOI] [PMC free article] [PubMed] [Google Scholar]
- Cleland BG, Levick WR. Properties of rarely encountered types of ganglion cells in the cat's retina and an overall classification. J Physiol. 1974;240:457–492. doi: 10.1113/jphysiol.1974.sp010618. [DOI] [PMC free article] [PubMed] [Google Scholar]
- Dacheux RF, Raviola E. The rod bipolar pathway in the rabbit retina; a depolarizing bipolar and amacrine cell. J Neurosci. 1986;6:331–345. doi: 10.1523/JNEUROSCI.06-02-00331.1986. [DOI] [PMC free article] [PubMed] [Google Scholar]
- Devries SH, Baylor DA. Mosaic arrangement of ganglion cell receptive fields in rabbit retina. J Neurophysiol. 1997;78:2048–2060. doi: 10.1152/jn.1997.78.4.2048. [DOI] [PubMed] [Google Scholar]
- Eggers ED, Lukasiewicz PD. Receptor and transmitter release properties set the time course of retinal inhibition. J Neurosci. 2006;26:9413–9425. doi: 10.1523/JNEUROSCI.2591-06.2006. [DOI] [PMC free article] [PubMed] [Google Scholar]
- Eggers ED, McCall MA, Lukasiewicz PD. Presynaptic inhibition differentially shapes transmission in distinct circuits in the mouse retina. J Physiol. 2007;582:569–582. doi: 10.1113/jphysiol.2007.131763. [DOI] [PMC free article] [PubMed] [Google Scholar]
- Freed MA. Quantal encoding of information in a retinal ganglion cell. J Neurophysiol. 2005;94:1048–1056. doi: 10.1152/jn.01276.2004. [DOI] [PubMed] [Google Scholar]
- Freed MA, Smith RG, Sterling P. Timing of quantal release from the retinal bipolar terminal is regulated by a feedback circuit. Neuron. 2003;38:89–101. doi: 10.1016/s0896-6273(03)00166-1. [DOI] [PubMed] [Google Scholar]
- Hirsch JA. Synaptic physiology and receptive field structure in the early visual pathway of the cat. Cereb Cortex. 2003;13:63–69. doi: 10.1093/cercor/13.1.63. [DOI] [PubMed] [Google Scholar]
- Howarth C, Peppiatt-Wildman CM, Attwell D. The energy use associated with neural computation in the cerebellum. J Cereb Blood Flow Metab. 2010;30:403–414. doi: 10.1038/jcbfm.2009.231. [DOI] [PMC free article] [PubMed] [Google Scholar]
- Kim KJ, Rieke F. Temporal contrast adaptation in the input and output signals of salamander retinal ganglion cells. J Neurosci. 2001;21:287–299. doi: 10.1523/JNEUROSCI.21-01-00287.2001. [DOI] [PMC free article] [PubMed] [Google Scholar]
- Koch K, McLean J, Berry M, Sterling P, Balasubramanian V, Freed MA. Efficiency of information transmission by retinal ganglion cells. Curr Biol. 2004;14:1523–1530. doi: 10.1016/j.cub.2004.08.060. [DOI] [PubMed] [Google Scholar]
- Koch K, McLean J, Segev R, Freed MA, Berry MJ, 2nd, Balasubramanian V, Sterling P. How much the eye tells the brain. Curr Biol. 2006;16:1428–1434. doi: 10.1016/j.cub.2006.05.056. [DOI] [PMC free article] [PubMed] [Google Scholar]
- MacNeil MA, Masland RH. Extreme diversity among amacrine cells: implications for function. Neuron. 1998;20:971–982. doi: 10.1016/s0896-6273(00)80478-x. [DOI] [PubMed] [Google Scholar]
- MacNeil MA, Heussy JK, Dacheux RF, Raviola E, Masland RH. The population of bipolar cells in the rabbit retina. J Comp Neurol. 2004;472:73–86. doi: 10.1002/cne.20063. [DOI] [PubMed] [Google Scholar]
- Manookin MB, Beaudoin DL, Ernst ZR, Flagel LJ, Demb JB. Disinhibition combines with excitation to extend the operating range of the OFF visual pathway in daylight. J Neurosci. 2008;28:4136–4150. doi: 10.1523/JNEUROSCI.4274-07.2008. [DOI] [PMC free article] [PubMed] [Google Scholar]
- Margolis DJ, Detwiler PB. Different mechanisms generate maintained activity in ON and OFF retinal ganglion cells. J Neurosci. 2007;27:5994–6005. doi: 10.1523/JNEUROSCI.0130-07.2007. [DOI] [PMC free article] [PubMed] [Google Scholar]
- Meister M, Berry MJ., 2nd The neural code of the retina. Neuron. 1999;22:435–450. doi: 10.1016/s0896-6273(00)80700-x. [DOI] [PubMed] [Google Scholar]
- Menger N, Pow DV, Wässle H. Glycinergic amacrine cells of the rat retina. J Comp Neurol. 1998;401:34–46. doi: 10.1002/(sici)1096-9861(19981109)401:1<34::aid-cne3>3.0.co;2-p. [DOI] [PubMed] [Google Scholar]
- Mills SL, Massey SC. Differential properties of 2 gap junctional pathways made by AII amacrine cells. Nature. 1995;377:734–737. doi: 10.1038/377734a0. [DOI] [PubMed] [Google Scholar]
- Molnar A, Werblin F. Inhibitory feedback shapes bipolar cell responses in the rabbit retina. J Neurophysiol. 2007;98:3423–3435. doi: 10.1152/jn.00838.2007. [DOI] [PubMed] [Google Scholar]
- Molnar A, Hsueh HA, Roska B, Werblin FS. Crossover inhibition in the retina: circuitry that compensates for nonlinear rectifying synaptic transmission. J Comput Neurosci. 2009;27:1573–6873. doi: 10.1007/s10827-009-0170-6. [DOI] [PMC free article] [PubMed] [Google Scholar]
- Murphy GJ, Rieke F. Signals and noise in an inhibitory interneuron diverge to control activity in nearby retinal ganglion cells. Nat Neurosci. 2008;11:318–326. doi: 10.1038/nn2045. [DOI] [PMC free article] [PubMed] [Google Scholar]
- Nelson R. Cat cones have rod input: a comparison of the response properties of cones and horizontal cell bodies in the retina of the cat. J Comp Neurol. 1977;172:109–135. doi: 10.1002/cne.901720106. [DOI] [PubMed] [Google Scholar]
- Pan F, Mills SL, Massey SC. Screening of gap junction antagonists on dye coupling in the rabbit retina. Vis Neurosci. 2007;24:609–618. doi: 10.1017/S0952523807070472. [DOI] [PMC free article] [PubMed] [Google Scholar]
- Pang JJ, Abd-El-Barr MM, Gao F, Bramblett DE, Paul DL, Wu SM. Relative contributions of rod and cone bipolar cell inputs to AII amacrine cell light responses in the mouse retina. J Physiol. 2007;580:397–410. doi: 10.1113/jphysiol.2006.120790. [DOI] [PMC free article] [PubMed] [Google Scholar]
- Petrides A, Trexler EB. Differential output of the high-sensitivity rod photoreceptor: AII amacrine pathway. J Comp Neurol. 2008;507:1653–1662. doi: 10.1002/cne.21617. [DOI] [PMC free article] [PubMed] [Google Scholar]
- Rentería RC, Tian N, Cang J, Nakanishi S, Stryker MP, Copenhagen DR. Intrinsic ON responses of the retinal OFF pathway are suppressed by the ON pathway. J Neurosci. 2006;26:11857–11869. doi: 10.1523/JNEUROSCI.1718-06.2006. [DOI] [PMC free article] [PubMed] [Google Scholar]
- Rockhill RL, Daly FJ, MacNeil MA, Brown SP, Masland RH. The diversity of ganglion cells in a mammalian retina. J Neurosci. 2002;22:3831–3843. doi: 10.1523/JNEUROSCI.22-09-03831.2002. [DOI] [PMC free article] [PubMed] [Google Scholar]
- Roska B, Werblin F. Vertical interactions across ten parallel, stacked representations in the mammalian retina. Nature. 2001;410:583–587. doi: 10.1038/35069068. [DOI] [PubMed] [Google Scholar]
- Sagdullaev BT, McCall MA, Lukasiewicz PD. Presynaptic inhibition modulates spillover, creating distinct dynamic response ranges of sensory output. Neuron. 2006;50:923–935. doi: 10.1016/j.neuron.2006.05.015. [DOI] [PubMed] [Google Scholar]
- Smith RG, Freed MA, Sterling P. Microcircuitry of the dark-adapted cat retina: functional architecture of the rod-cone network. J Neurosci. 1986;6:3505–3517. doi: 10.1523/JNEUROSCI.06-12-03505.1986. [DOI] [PMC free article] [PubMed] [Google Scholar]
- Strettoi E, Raviola E, Dacheux RF. Synaptic connections of the narrow-field, bistratified rod amacrine cell (AII) in the rabbit retina. J Comp Neurol. 1992;325:152–168. doi: 10.1002/cne.903250203. [DOI] [PubMed] [Google Scholar]
- van Wyk M, Taylor WR, Vaney DI. Local edge detectors: a substrate for fine spatial vision at low temporal frequencies in rabbit retina. J Neurosci. 2006;26:13250–13263. doi: 10.1523/JNEUROSCI.1991-06.2006. [DOI] [PMC free article] [PubMed] [Google Scholar]
- Veruki ML, Hartveit E. Meclofenamic acid blocks electrical synapses of retinal AII amacrine and on-cone bipolar cells. J Neurophysiol. 2009;101:2339–2347. doi: 10.1152/jn.00112.2009. [DOI] [PubMed] [Google Scholar]
- Wässle H, Koulen P, Brandstätter JH, Fletcher EL, Becker CM. Glycine and GABA receptors in the mammalian retina. Vision Res. 1998;38:1411–1430. doi: 10.1016/s0042-6989(97)00300-3. [DOI] [PubMed] [Google Scholar]
- Xin D, Bloomfield SA. Comparison of the responses of AII amacrine cells in the dark- and light-adapted rabbit retina. Vis Neurosci. 1999;16:653–665. doi: 10.1017/s0952523899164058. [DOI] [PubMed] [Google Scholar]
- Yin L, Smith RG, Sterling P, Brainard DH. Chromatic properties of horizontal and ganglion cell responses follow a dual gradient in cone opsin expression. J Neurosci. 2006;26:12351–12361. doi: 10.1523/JNEUROSCI.1071-06.2006. [DOI] [PMC free article] [PubMed] [Google Scholar]
- Zaghloul KA, Boahen K, Demb JB. Different circuits for ON and OFF retinal ganglion cells cause different contrast sensitivities. J Neurosci. 2003;23:2645–2654. doi: 10.1523/JNEUROSCI.23-07-02645.2003. [DOI] [PMC free article] [PubMed] [Google Scholar]
- Zeck GM, Xiao Q, Masland RH. The spatial filtering properties of local edge detectors and brisk-sustained retinal ganglion cells. Eur J Neurosci. 2005;22:2016–2026. doi: 10.1111/j.1460-9568.2005.04390.x. [DOI] [PubMed] [Google Scholar]