

Abstract
Hydrolysis and oxidation of LDL stimulate LDL entrapment in the arterial wall and promote inflammation and atherosclerosis via various mechanisms including lipoprotein fusion and lipid droplet formation. To determine the effects of FFA on these transitions, we hydrolyzed LDL by phospholipase A2 (PLA2), removed FFA by albumin, and analyzed structural stability of the modified lipoproteins. Earlier, we showed that heating induces LDL remodeling, rupture, and coalescence into lipid droplets resembling those found in atherosclerotic lesions. Here, we report how FFA affect these transitions. Circular dichroism showed that mild LDL lipolysis induces partial β-sheet unfolding in apolipoprotein B. Electron microscopy, turbidity, and differential scanning calorimetry showed that mild lipolysis promotes LDL coalescence into lipid droplets. FFA removal by albumin restores LDL stability but not the protein conformation. Consequently, FFA enhance LDL coalescence into lipid droplets. Similar effects of FFA were observed in minimally oxidized LDL, in LDL enriched with exogenous FFA, and in HDL and VLDL. Our results imply that FFA promote lipoprotein coalescence into lipid droplets and explain why LDL oxidation enhances such coalescence in vivo but hampers it in vitro. Such lipid droplet formation potentially contributes to the pro-atherogenic effects of FFA.
Keywords: lipoprotein fusion and rupture, free fatty acids, lipoprotein oxidation, albumin, thermal stability, atherosclerosis
In atherosclerosis, LDL-derived lipids are deposited in the subendothelium of the arterial wall. According to the “response to retention” hypothesis, atherogenesis is initiated upon LDL retention by the arterial proteoglycans and LDL modification by the resident hydrolases and oxidative agents (1–3). These modifications trigger a cascade of pro-inflammatory and pro-apoptotic responses that are caused, in part, by the toxic effects of the oxidized phospholipids and their hydrolytic products such as FFA and lyso-phosphatidylcholine (PC) (4, 5). Hydrolytic and oxidative modifications can also induce LDL aggregation, fusion, and coalescence into lipid droplets, which further enhance LDL retention in the arterial wall (6). LDL-derived small extracellular lipid droplets (30–400 nm) are prominent in early atherosclerotic lesions (7) and are observed in the experimental models of atherosclerosis [(8) and references therein]. Most of the lipids found in fibrous atherosclerotic plaques are present in such droplets [reviewed in (9)]. Moreover, fusion of modified LDL accelerates LDL uptake by arterial macrophages, eventually leading to foam cell formation and progression of atherosclerotic plaques containing large (400–6,000 nm) LDL-derived intracellular lipid droplets (7). Hence, the atherogenic potential of LDL is linked to their propensity to fuse and coalesce into lipid droplets.
Because nonmodified LDL do not fuse under physiologic conditions, modifications such as oxidation, lipolysis, and proteolysis are thought to be prerequisites for lipoprotein fusion [(1–4, 10) and references therein]. The effects of these modifications on LDL aggregation and fusion have been attributed to the packing defects in the particle surface (6, 8), which may result from an imbalance between this surface and the apolar core (12). A similar imbalance leading to lipoprotein fusion and rupture can result from other perturbations such as heating, chemical denaturation, detergents, etc. [reviewed in (13)]. For example, heating leads to irreversible remodeling of LDL into smaller and larger particles; the former resemble small dense LDL and the latter are apparent products of LDL fusion (14). Further heating leads to irreversible rupture of these particles and release of their core lipids that coalesce into droplets; the size and morphology of these droplets resemble the extracellular lipid droplets found in atherosclerotic lesions (7, 14). Hence, heating provides a useful tool to accelerate LDL remodeling and coalescence into lipid droplets and to monitor these transitions in real time.
Surprisingly, in LDL isolated from human plasma, oxidation progressively inhibits heat-induced remodeling and rupture (15). Consequently, contrary to the accepted notion, oxidation per se inhibits rather than promotes LDL remodeling. This prompted us to postulate that fusion and coalescence of oxidized LDL in the arterial wall are facilitated by other factors, such as the enhanced binding of oxidized LDL to the arterial proteoglycans, the imbalance between the FFA generation by lipases and removal by albumin, etc. (15). Here, we test the effects of PC hydrolysis by phospholipase A2 (PLA2) and removal of its products by albumin on heat-induced LDL remodeling, rupture, and lipid droplet formation.
Enzymes from the PLA2 family hydrolyze PCs at the sn-2 position to generate lyso-PC and FFA. Several types of secretory PLA2 (16, 17) and the lipoprotein-associated PLA2 (Lp-PLA2) that preferentially hydrolyses oxidized PCs in LDL (18) provide biomarkers of inflammation and atherosclerosis [reviewed in (19–22)]. Moreover, Lp-PLA2 has emerged as a causative agent of atherosclerosis and as a new therapeutic target (17, 23–27). Lp-PLA2 (28) and phospholipase C (29) are reportedly enriched in the small dense LDL and/or in the electronegative LDL, which may promote fusion of these LDL and contribute to their enhanced pro-atherogenic properties (29).
We hypothesize that the pro-atherogenic properties of PLA2 result in part from the direct effects of its products on LDL fusion and rupture. This hypothesis is based on the effects of PLA2 and its products, lyso-PC and FFA (which promote positive and negative bilayer curvature, respectively), on specific steps in lipid bilayer fusion (30, 31). In addition, PLA2 enzymes can lyse various membranes, including cell membranes in erythrocytes as well as the membranes in various bacteria and viruses (32), which is important for the immune response. We speculate that the ability of PLA2 to promote membrane fusion and lysis may extend to lipoprotein fusion and rupture. This is suggested by studies from Hakala et al. (16) showing that LDL hydrolysis by PLA2 in the presence of arterial proteoglycans causes LDL fusion; in those studies, FFA were removed from LDL by using near-physiologic concentrations of albumin (20 mg/ml) in an essentially FFA-free state. Even though albumin is believed to remove most FFA produced upon lipolysis of plasma lipoproteins, excess FFA generated locally can partition into lipoproteins (33), particularly in the acidic environment of atherosclerotic lesions where albumin has impaired ability to remove FFA (34). Here, we test the effects of FFA retained in LDL on the heat-induced lipoprotein fusion and coalescence into lipid droplets. To do so, we compare the effects of PC hydrolysis in native and in oxidized LDL in the presence and in the absence of albumin. The results imply a potentially important role of FFA in the in vivo formation of lipoprotein-derived lipid droplets.
MATERIALS AND METHODS
Isolation of lipoproteins
Human lipoproteins from five healthy volunteers were used. Plasma was donated at a blood bank in compliance with the Institutional Review Board protocols and with written consent obtained from the volunteers. Single-donor lipoproteins were isolated from fresh EDTA-treated plasma by KBr density gradient ultracentrifugation in the density range 0.94–1.006 g/ml for VLDL, 1.019–1.063 g/ml for LDL, and 1.063–1.21 g/ml for HDL (35). Lipoproteins from each class migrated as a single band on the agarose gel and on the nondenaturing gel. Lipoprotein stock solutions were dialyzed against buffer A (10 mM Na phosphate buffer, 0.25 mM EDTA, 0.02% NaN3, pH 7.5), degassed, and stored in the dark at 4°C. The stock solutions were used within 2 weeks during which no protein degradation was detected by SDS PAGE and no changes in the net charge were observed on the agarose gel. Protein concentration was determined by a modified Lowry assay.
Preparation and characterization of lipoproteins hydrolyzed by PLA2
Lipoprotein solutions (3 mg/ml protein concentration) were dialyzed against buffer B (10 mM Tris, pH 7.5) and were incubated with porcine pancreatic PLA2 (Sigma) in buffer B containing 2 mM CaCl2 for 12 h at 37°C following established protocols (36). To obtain lipoproteins hydrolyzed to stage 1, 2, or 3, we used 0.05, 0.5, or 5 μg of PLA2, respectively. The reaction was stopped by adding EDTA to a final concentration of 15 mM. To remove FFA from the lipoproteins, 20 mg/ml of essentially fatty acid-free human serum albumin (HSA; Sigma) was included in some incubation mixtures (16); this albumin concentration corresponds to the average value found in the interstitial fluid of the arterial intima (37). The lipoproteins were reisolated by ultracentrifugation. The complete removal of albumin from the lipoproteins with which it was coincubated was confirmed by SDS PAGE (see Fig. 1B). Lipoproteins from the same plasma pool were subjected to identical incubation and reisolation procedures but without PLA2 to assess the effects of spontaneous hydrolysis at 37°C, i. e., hydrolysis in the absence of exogenous PLA2; such hydrolysis results from the hydrolytic activity of apolipoprotein (apo)B (38, 39) and the LDL-associated Lp-PLA2. Such spontaneously hydrolyzed LDL (marked S) as well as those hydrolyzed to stages 1–3 by PLA2 (marked by the stage number) were dialyzed against buffer A for further studies.
Fig. 1.

Changes in LDL moieties upon PC hydrolysis. LDL were hydrolyzed upon incubation for 12 h at 37°C either spontaneously (S) or in the presence of 0.05 (1), 0.5 (2) or 5 μg/ml PLA2 (3). (0) stands for native nonmodified LDL, (1·HSA) indicates particles from which FFA have been removed by albumin. A: Net charge on LDL assessed by agarose gel electrophoresis. The migration pattern is very similar for stages 1 and 2. B: Protein modification assessed by SDS PAGE (4–20%, Denville blue stain). C: Lipid composition assessed by thin-layer chromatography. Error bars indicate the standard error or mean from five independent measurements.
LDL enrichment with exogenous oleic acid
Sodium oleate (>99% purity, from Sigma) was used. Native LDL (2 mg/ml protein) and a freshly prepared emulsion of oleic acid (8 mM) in 10 mM Na phosphate buffer, 250 mM EDTA, were coincubated at 37°C for 4 h or 12 h. Unbound oleic acid was removed by gel filtration using Superose 6 10/300 GL column by elution in buffer A at a flow rate of 0.5 ml/min. The final concentrations of oleic acid incorporated into LDL, which were determined by quantitative TLC analysis, were 1.5 mM after 4 h and 3 mM after 12 h of incubation, a significant enrichment as compared with unmodified LDL (0.065–0.01 mM).
Oxidation of LDL
LDL minimally oxidized by Cu2+ (moxLDL) were obtained following established protocols [(15) and references therein]. Briefly, LDL solution (0.1 mg/ml protein) was incubated with 5 µM CuSO4 at 37°C in buffer B for 1 h. The reaction was quenched by adding EDTA to a final concentration of 250 mM, followed by cooling to 4°C and dialysis against buffer A. LDL oxidation under these conditions corresponds to the end of the lag phase during which the core antioxidants are consumed (as monitored by visible absorption spectra of core carotenoids, such as those shown in supplementary Fig. II A) and the beginning of the propagation phase during which conjugated dienes are produced [as monitored by absorbance at 234 nm (15, 40)]. MoxLDL prepared by this method showed no protein fragmentation by SDS PAGE, no significant changes in the apoB conformation by circular dichroism (CD) spectroscopy (15), and no changes in lipid composition by TLC (see Fig. 8C). Hydrolysis of moxLDL by PLA2 to stage 1 (1·moxLDL) was done as described for native LDL in the absence or in the presence of 20 mg/ml FFA-free albumin to produce minimally oxidized and hydrolyzed FFA-free LDL (1·moxLDL·HSA). The LDL modified by these methods were reisolated by density gradient centrifugation, dialyzed against buffer A, and used for stability studies.
Fig. 8.

Combined effects of mild oxidation and hydrolysis on LDL stability assessed by heating in CD experiments. Minimally oxidized LDL (mox), prepared as described in Methods, were hydrolyzed by PLA2 to stage 1 (1·mox) and treated with albumin to remove FFA (1·mox·HSA). The LDL (2 mg/ml in buffer A, placed in 1 mm path length cell) that were modified by these methods or were native (0) were heated at a rate of 11°C/h. The melting data were recorded at 280 nm by CD (A) and turbidity (dynode voltage) (B). TLC shows formation of FFA and lyso-PC upon hydrolysis of moxLDL to stage 1 (C). Quantitative lipid analysis based on the TLC data (D). Error bars indicate the standard error of the mean for five independent measurements.
Gel electrophoresis
SDS PAGE was performed using a 4–20% gradient system. The gels were run at 150 V for 2 h and stained with Denville Blue protein stain. Agarose gels were performed using a TITAN lipoprotein gel electrophoresis system. LDL samples containing 4 µg protein were loaded on the precast gels that were run using barbital-sodium barbital buffer at 60 V for 40 min and at 125 V for 7 min. The gels were dried at 70°C for 20 min, stained with 0.1% w/v Fat Red 7B stain in 95% methanol, destained in 75% methanol, and dried at 70°C.
Lipid analysis
Native and hydrolyzed LDL were analyzed by TLC for total lipid composition and by GC for FFA composition. The total amount of FFA was within the range reported for normal human plasma LDL (41). The lipids were extracted by the Folch method (42) with 2:1 chloroform:methanol and were dried under nitrogen. For TLC, known amounts of dry lipids were analyzed using hexane:ether:acetic acid (70:30:1) to separate apolar lipids, or chloroform:methanol:water:acetic acid (65:25:4:1) to separate polar lipids.
For quantitative analysis of LDL lipids by TLC, Image J software (National Institutes of Health, Bethesda, MD) was used to calculate the band areas corresponding to PC, FFA, and lyso-PC. A calibration plot of the peak area versus the amount of sample was obtained from the analysis of the charred spots corresponding to known amounts of lipids; the plot was linear with R = 0.99. This plot was used to determine the relative amount of PC, FFA, and lyso-PC for each LDL sample. To minimize the errors resulting from variations in the length of the TLC run and in the charring conditions, the standards were spotted in each plate. The relative fraction of each lipid was plotted as a mean of five independent experiments with the standard error of mean reported for each fraction.
For GC, fatty acid methyl esters of neutral, polar, and apolar lipids were prepared as described (43). Briefly, the extracted dry lipids were dissolved in 0.3 ml dry benzene, 0.35 ml dry methanol, and 0.35 ml dry boron trifluoride in methanol in a capped vial. The vials were kept at 100°C for 30 min. After cooling, 1.5 ml water was added to stop the reaction, 5 ml of hexane was added, and the mixture was vortexed for 30 s. The aqueous and organic phases were separated by centrifugation. The top hexane layer was removed and dried under N2. The dry lipids were resuspended in 100 µL ultrapure hexane and were injected into GC. The fatty acids were analyzed on a fused silica capillary column, 30 m × 0.25 mm (Supelco) installed in Shimadzu GC-14A gas chromatograph equipped with a hydrogen flame ionization detector. Hydrogen was the carrier gas at 3 psi. The injections were made at 100°C; after 30 s, the oven temperature was programmed to increase at 20°C/min to 180°C, and then at 5°C/min to 240°C (44). The fatty acid peaks were identified by comparing the relative retention times of the unknowns with those of standards run before and after the unknowns.
CD spectroscopy, turbidity, and right-angle light scattering
CD data were recorded by using an AVIV-400 spectropolarimeter equipped with thermoelectric temperature controller and total fluorescence accessory. Far-ultraviolet (UV) CD spectra (185–250 nm) were recorded from lipoprotein solutions in buffer A to assess protein secondary structure. To assess lipoprotein stability, heat-induced changes in CD were monitored at a constant wavelength of 280 nm for lipoprotein rupture and repacking of apolar core lipids into droplets. Earlier, we showed that such repacking induces a large negative peak in near-UV CD that is centered at 320 nm and extends beyond 280 nm (17). This peak probably originates from the induced CD of apolar lipids such as cholesterol esters and triglycerides, which are the only lipoprotein moieties that reportedly show induced CD at these wavelengths [(14) and references therein]. Furthermore, heat-induced increase in the particle size due to fusion, rupture, and coalescence into lipid droplets was monitored by turbidity (that is proportional to the dynode voltage, V, recorded in CD experiments) or by right-angle light scattering [that was recorded by using total fluorescence accessory in the spectropolarimeter as described (45)]. The CD, turbidity, and light scattering melting data were recorded at the same wavelength from lipoprotein samples that were heated at a rate of 11°C/h. Far-UV CD data were normalized to protein concentration and expressed as molar residue ellipticity, [Θ]. ORIGIN software was used for data processing and display.
Differential scanning calorimetry
The heat capacity Cp(T) was recorded using an upgraded MC2 microcalorimeter (MicroCal, Amherst, MA) as described (14). The data were recorded from LDL solutions (2 mg/ml protein in buffer A) during heating from 5 to 110°C at a rate of 90°C/h under N2 pressure of 40 psi. The buffer baselines were subtracted from the data. ORIGIN software was used for the data collection and analysis.
EM and adsorption and fluorescence spectroscopy
Lipoproteins were visualized by negative staining electron microscopy (EM) using a CM12 transmission electron microscope (Philips Electron Optics) as described (14, 15). PHOTOSHOP and EXCEL software were used for the analysis of particle size distribution; 200–250 particles were used for such an analysis. Absorption spectra of normal and hydrolyzed LDL (0.5 mg/ml protein in buffer A) were recorded at 25°C using Varian Cary-300 UV/Vis spectrophotometer. Fluorescence emission spectra were recorded of LDL solutions (0.05 mg/ml protein in buffer A) at 25°C using a Fluoromax-2 spectrofluorimeter. The spectra were recorded from 320–500 nm with excitation at 280 nm and 5 nm bandwidth for excitation and emission.
All experiments in this study were repeated 3–5 times to ensure reproducibility.
RESULTS
Biochemical characterization of hydrolyzed LDL
Agarose gel was used to assess the net charge on LDL hydrolyzed to various stages (Fig. 1A). Spontaneous hydrolysis at 37°C or hydrolysis by PLA2 to stage 1 produced no changes in the net charge on LDL (lanes S and 1, Fig. 1A). However, hydrolysis to stage 3 induced an increase in the net negative charge on LDL, which resulted from the generation of large amounts of FFA (lane 3).
To test whether lipoprotein coincubation at 37°C with PLA2 led to proteolysis, lipoproteins hydrolyzed to stages 1–3 were subjected to SDS PAGE. At 0.05 μg PLA2 (lane 1·HSA, Fig. 1B), no apoB proteolysis in LDL was detected, yet at 0.5–5 μg PLA2, apoB showed progressive fragmentation (lanes 2·HSA and 3·HSA, Fig. 1B). Because our main focus was on the effects of PC hydrolysis, most of the data reported here pertain to lipoproteins hydrolyzed to stage 1 to minimize the apo lipoprotein modifications.
TLC was used to assess total lipid composition in LDL that were either native or hydrolyzed to stages 1 to 3. Quantitative analysis clearly showed a progressive reduction in PC content with a concomitant increase in lyso-PC and FFA upon hydrolysis (Fig. 1C). The latter was further confirmed by GC, which was used to analyze fatty acid composition in native LDL and in LDL that have been hydrolyzed upon 12 h incubation at 37°C, either spontaneously or in the presence of 0.05 to 5 μg PLA2 (0, S, 1, and 3, Fig. 2). An increase in FFA upon spontaneous hydrolysis was observed with further progressive increase upon increasing PLA2 concentration (Fig. 2).
Fig. 2.
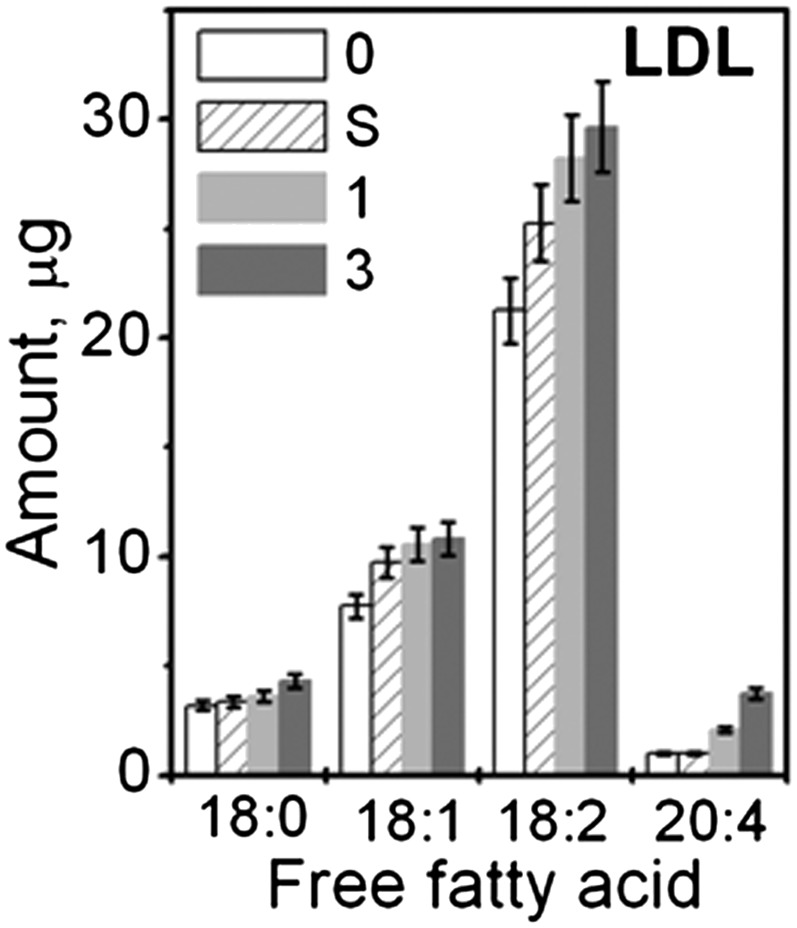
Gas chromatographic analysis of FFA in LDL. LDL were native (0) or hydrolyzed spontaneously (S) or in the presence of 0.05 (1) or 5 μg/ml PLA2 (3). The data show an average of three independent measurements. Error bars indicate the range of deviations among individual measurements.
Effects of mild hydrolysis by PLA2 on the structural transitions in LDL
The protein secondary structure in LDL was assessed by far-UV CD. Figure 3 shows CD spectra of native LDL (0) and of LDL that have been hydrolyzed to stage 1 (1) and treated by albumin to remove FFA (1·HSA). The spectrum of native LDL showed negative peaks at 208 and 218 nm and a positive peak at 195 nm characteristic of the mixture of α-helix and β-sheet in apoB (14, 46). LDL hydrolysis by PLA2 led to a reduction in spectral intensity, indicating partial unfolding of the secondary structure. Removal of FFA by albumin led to further reduction in CD intensity and changes in spectral shape indicating additional unfolding. The secondary structure that was lost was assessed from the difference between the CD spectra of native LDL and of LDL that have been hydrolyzed to stage 1 and albumin-treated, Θ(0)-Θ(1·HSA) (Fig. 3, insert). This difference spectrum showed a negative peak at 218 nm and a positive peak at 197 nm, which is characteristic of the β-sheet. Similar CD changes were observed in the spontaneously hydrolyzed LDL (supplementary Fig. I A). Hence, mild LDL hydrolysis and FFA removal lead to a progressive unfolding of the β-sheet structure in apoB.
Fig. 3.
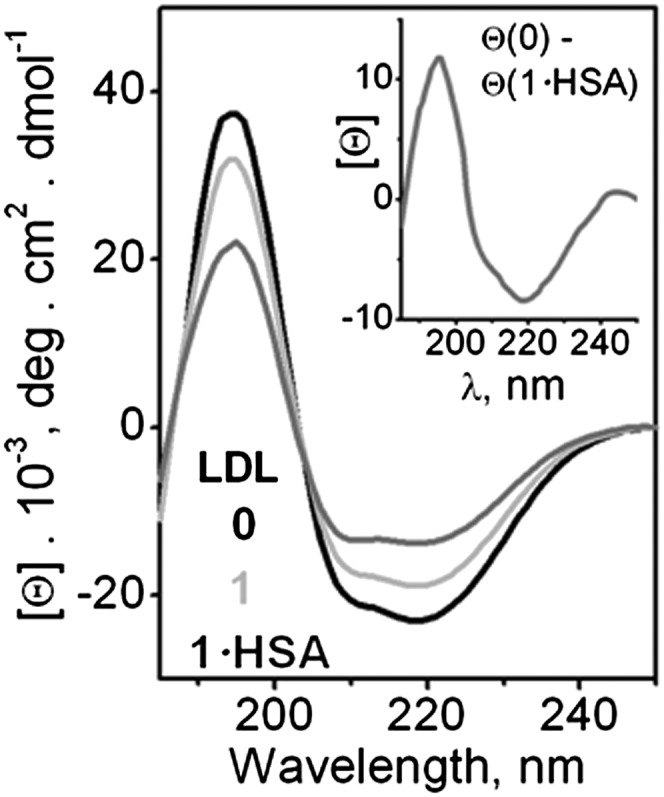
Changes in the protein secondary structure upon LDL hydrolysis. Far-UV CD spectra were recorded at 25°C from LDL solutions containing 20 µg/ml protein in buffer A. LDL were native (0) or hydrolyzed to stage 1 by using 0.05 μg/ml PLA2 (1) and albumin-treated (1·HSA). Insert: Difference spectrum, [Θ](0)- [Θ](1·HSA), shows unfolding of the β-sheet structure in apoB upon LDL hydrolysis to stage 1 and removal of FFA.
Near-UV/vis absorption spectra were recorded to test for possible chemical modifications produced by PLA2 in the apolar core of LDL. The signal from carotenoids did not change upon hydrolysis to stages 1–3, suggesting an intact LDL core (supplementary Fig. II A). Furthermore, intrinsic Trp fluorescence spectra showed that LDL hydrolysis to stages 1–3 did not affect the wavelength of maximal fluorescence, 333 nm, indicating largely buried Trp (supplementary Fig. II B). However, hydrolyzed LDL showed a progressive reduction in fluorescence emission, which probably reflected changes in the Trp environment upon PC hydrolysis as well as the accompanying conformational changes in apoB, which are indicated by far-UV CD (Fig. 3).
To assess the combined effects of hydrolytic and thermal modifications on the particle morphology, we used negative stain EM. Figure 4 shows electron micrographs of native LDL (0) and of LDL that have been hydrolyzed to stage 1 (1) and albumin-treated (1·HSA). The particles were visualized at 22°C before and after heating to 100°C at a rate of 90°C/h. The particle size and morphology before heating did not change upon hydrolysis or removal of its products by albumin (Fig. 4A–C and supplementary Fig. III). However, the hydrolytic products had a large effect on the size and morphology of the heated LDL (Fig. 4D–F). Heating of native LDL induced remodeling into smaller and larger LDL-like particles that are apparent products of LDL fusion, followed by lipoprotein rupture and release of apolar core lipids that coalesce into droplets (14). Such small and large particles are clearly seen in Fig. 4D; the particle size analysis at various stages of heat denaturation was reported earlier (14). In contrast to native LDL, most LDL hydrolyzed to stage 1 coalesced into large lipid droplets upon heating (Fig. 4E). Similar large droplets were detected upon heating of spontaneously hydrolyzed LDL (not shown). This suggests that, contrary to the notion proposed in our earlier studies (15), mild PC hydrolysis promotes LDL rupture and coalescence into lipid droplets. Importantly, Fig. 4F shows that this effect is partially abolished upon removal of the hydrolytic products by albumin; heating of LDL that have been hydrolyzed to stage 1 and albumin-treated (1·HSA) produced small and large LDL-like particles and relatively small lipid droplets. These results suggest that FFA generated in LDL upon spontaneous or PLA2-induced hydrolysis promote heat-induced LDL rupture and coalescence into large lipid droplets, whereas removal of FFA by albumin hampers formation of such droplets.
Fig. 4.
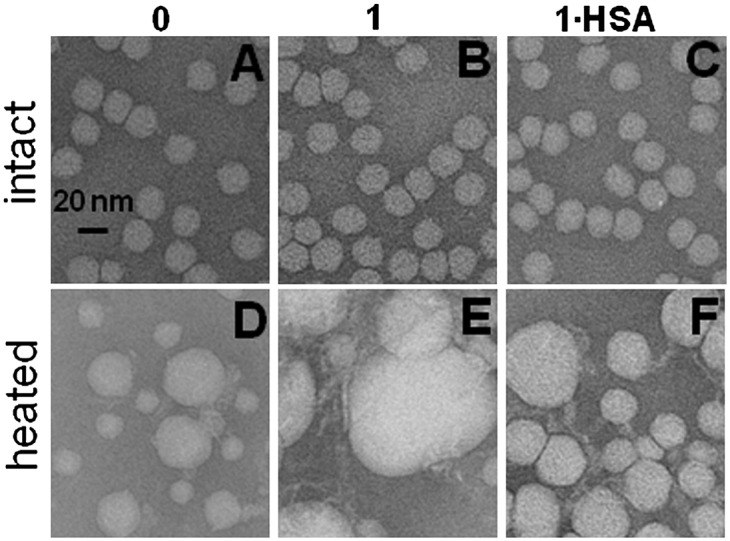
Electron micrographs of negatively stained LDL showing combined effects of mild hydrolysis and heating. LDL were native (0) or hydrolyzed by PLA2 to stage 1 (1) and albumin-treated (1·HSA). LDL solutions (2 mg/ml protein in buffer A) were heated to 100°C at a rate of 90°C/h. The images were recorded at 25°C before (top) and after heating (bottom). Bar size is 20 nm. Typical size of lipid droplets observed upon heating of native (0) or albumin-treated LDL (1·HSA) was around 40 nm (D, F), whereas LDL hydrolyzed to stage 1 produced larger 80–100 nm droplets (E).
To test this notion by other techniques, we monitored in real time thermal transitions in LDL during heating at a rate of 11°C/h. The heating data were recorded at 280 nm by CD (for lipid repacking upon LDL rupture) and by right-angle light scattering and turbidity (for increase in the particle size due to LDL fusion, rupture, and coalescence into lipid droplets). Heating above 80°C led to an increase in the amplitude of the negative near-UV CD (Fig. 5A), turbidity (Fig. 5B), and light scattering (not shown), reflecting lipid droplet formation upon LDL rupture. The heating data of native LDL and of LDL that have been hydrolyzed to stage 1 and treated with albumin were very similar in the transition range, suggesting formation of similar-size particles (0 and 1·HSA in Fig. 5A, B). In contrast, LDL hydrolyzed to stage 1 without albumin treatment showed much larger heat-induced increase in the amplitude of near-UV CD and turbidity, suggesting formation of larger lipid droplets (1, Fig. 5). This is consistent with the electron micrographs showing larger lipid droplets formed upon heating of LDL hydrolyzed to stage 1 (Fig. 4E). Spontaneously hydrolyzed LDL showed a similar trend (supplementary Fig. I B, C). Taken together, our EM, CD, turbidity, and light-scattering data clearly show that: i) mild hydrolysis promotes heat-induced LDL rupture and formation of large lipid droplets; and ii) this effect is mainly due to FFA because preferential removal of FFA by albumin hampers LDL rupture and reduces the droplet size.
Fig. 5.

Effects of mild hydrolysis on LDL rupture assessed from the heating data in CD experiments. LDL were native (0) or hydrolyzed by PLA2 to stage 1 (1) and albumin-treated (1·HSA). LDL solutions (2 mg/ml protein in buffer A, placed in 1 mm path length cells) were heated at a rate of 11°C/h. The melting data were recorded at 280 nm by CD to monitor repacking of apolar lipids (A) and by turbidity (dynode voltage) to monitor increase in the particle size upon rupture and coalescence into lipid droplets (B).
To better characterize the effects of the hydrolytic products on the thermal transitions in LDL, we used differential scanning calorimetry (DSC). Figure 6 shows heat capacity data, Cp(T), recorded during LDL heating from 5–100°C at a rate of 90°C/h. In native LDL, three peaks corresponding to three structural transitions were observed in this (Fig. 6, black) and earlier studies [(14) and references therein]. The peak at near-physiologic temperatures reflects smectic-to-disorder phase transition in the lipid core, which is reversible [(47) and references therein]. Two high-temperature transitions are irreversible; the broader peak I centered at 75°C involves LDL remodeling into larger and smaller particles, and the sharper peak II involves lipoprotein rupture and coalescence into lipid droplets (14). Figure 6 shows that the lipid core transition is unchanged upon LDL hydrolysis to stage 1 or FFA removal by albumin. This result, together with the visible absorption spectra indicating intact carotenoids in the core of hydrolyzed LDL (supplementary Fig. II A), suggests strongly that LDL hydrolysis by PLA2 significantly alters the lipoprotein surface but not its core. Furthermore, the DSC peak at 75°C remains unchanged upon LDL hydrolysis to stage 1 with or without albumin (Fig. 6), suggesting that LDL remodeling into small and large particles is not significantly affected by PC hydrolysis. In contrast, the sharp high-temperature peak that reflects lipoprotein rupture is shifted in hydrolyzed LDL; the apparent peak temperature is lower in LDL hydrolyzed to stage 1 (77°C) and higher in LDL hydrolyzed to stage 1 and albumin-treated (85°C) as compared with nonmodified LDL (80°C). As a result, in LDL hydrolyzed to stage 1 (1, Fig. 6), fusion precedes rupture by only ∼2°C, whereas in native LDL and particularly in LDL hydrolyzed to stage 1 and albumin-treated (1·HSA, Fig. 6), fusion and rupture are well-resolved by 5 and 10°C, respectively. Taken together, our DSC data support the notion that generation of FFA upon mild PC hydrolysis promotes LDL rupture and coalescence into lipid droplets, whereas removal of FFA by albumin hampers it.
Fig. 6.
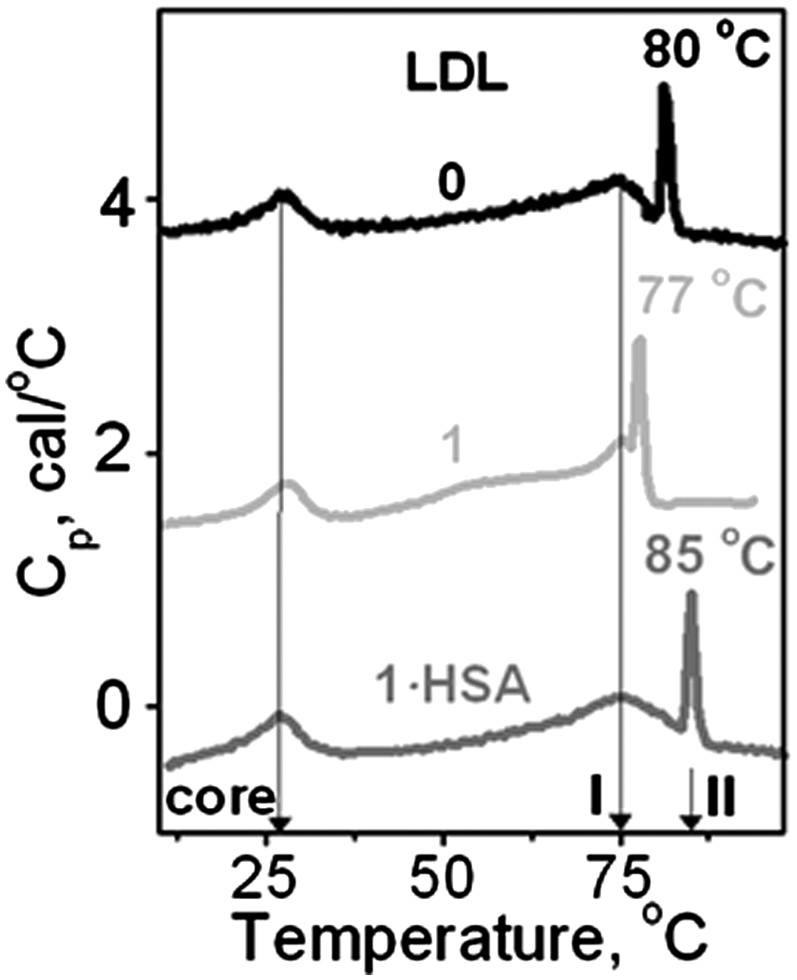
Effect of mild hydrolysis on the structural transitions in LDL assessed by differential scanning calorimetry. Excess heat capacity Cp(T) was recorded from LDL solutions (2 mg/ml protein in buffer A) during heating at a rate of 90°C/h. Line coding is as in Fig. 5. Peak temperatures of the smectic-to-disorder phase transition in the cholesterol esters (core) and LDL remodeling into small and large particles (I) are shown by arrows. Peak temperatures of LDL rupture and coalescence into lipid droplets (II) are indicated.
The secondary structure of apoB in LDL before and after heating to 100°C was assessed by far-UV CD. The results of this and earlier studies of native LDL (14) showed irreversible thermal unfolding of the predominantly β-sheet conformation (supplementary Fig. IV A). Furthermore, LDL hydrolyzed to stage 1, in which the apoB β-sheets have been largely unfolded upon hydrolysis (Fig. 3), showed predominantly α-helical conformation before heating; these α-helices unfolded irreversibly upon heating to 100°C (supplementary Fig. IV B). These results suggest that the β-sheets in apoB are labile to perturbations such as heating or hydrolysis and unfold prior to the α-helices.
Effect of hydrolysis by hepatic lipase on LDL stability
To test whether FFA produced by lipases other than PLA2 also reduce LDL stability, we used HL to hydrolyze LDL. Unlike PLA2, HL hydrolyzes not only PCs in the lipoprotein surface but also triacylglycerides in the core with FFA produced in both reactions (48). Under conditions of our experiments, HL caused lipolysis but did not lead to apoB modification detectable by SDS PAGE (see supplementary data for detail). Such limited hydrolysis significantly reduced LDL stability that was assessed by turbidity in the heating experiments (supplementary Fig. V). Thus, similar to PLA2, lipolysis by HL destabilizes LDL and promotes lipoprotein rupture.
Effect of enrichment with oleic acid on LDL stability
To test whether incorporation of exogenous FFA in the absence of lipolysis promotes lipoprotein rupture, LDL were enriched with oleic acid as described in the Methods. The agarose gel showed that such enrichment leads to an increase in the net negative charge on LDL (Fig. 7A). EM data showed that this enrichment has no detectable effect on the size and shape of the particle at an ambient temperature prior to heating (Fig. 7B). The heating data recorded by DSC showed that LDL enrichment with oleic acid to a final concentration up to 3 mM leads to a progressive low-temperature shift in the temperature of LDL fusion and rupture (Fig. 7C); the heating data recorded by turbidity showed a similar effect (Fig. 7D), indicating a large reduction in the temperature of LDL rupture and lipid droplet formation. Consequently, similar to FFA produced upon lipolysis, incorporation of exogenous FFA such as oleic acid destabilizes LDL and promotes heat-induced lipid droplet formation.
Fig. 7.

Effect of enrichment with exogenous oleic acid on thermal stability of LDL. Final concentrations of oleic acid (in mM) are shown by numbers; 0 stands for nonmodified LDL whose intrinsic oleic acid content ranges from 0.065–0.01 mM. A: Agarose gel electrophoresis shows that enrichment in oleic acid to a final concentration of 3 mM increases the net negative charge on LDL. B: Electron micrographs show that the particle shape and size (d∼22 nm) do not change upon such enrichment. C: DSC data, which were recorded at a heating rate of 90°C/h, show a progressive reduction in the apparent temperature of fusion and rupture with increasing concentration of oleic acid in LDL. D: Representative turbidity data, which were recorded during heating from 5 to 98°C at a rate of 11°C/h, show a reduction in the apparent temperature of fusion and rupture of LDL upon enrichment in oleic acid.
Effects of mild oxidation and PLA2 hydrolysis on LDL remodeling
Combined effects of mild LDL oxidation and PC hydrolysis are particularly relevant because oxidized PCs in LDL form preferred in vivo substrates for Lp-PLA2 [reviewed in (25)]. To assess such combined effects on LDL stability, we used moxLDL. CD and turbidity melting data showed a small reduction in the amplitude of the rupture transition in moxLDL as compared with native LDL (Fig. 8, solid and dashed black lines), which is consistent with the observation that oxidation progressively hampers LDL remodeling and rupture in vitro (14). Hydrolysis of moxLDL to stage 1 (1·mox) led to a significant reduction in PC and increase in FFA and lyso-PC as assessed by TLC (Fig. 8C, D). Importantly, such hydrolysis led to a large increase in the amplitude of the thermal transition (1·moxLDL, gray circles in Fig. 8), indicating formation of large lipid droplets which were also observed by EM (data not shown). This enhanced rupture and lipid droplet formation by 1·moxLDL was abolished upon FFA removal by albumin, as evident from the large reduction in the transition amplitude (1·moxLDL·HSA, gray dotted line in Fig. 8). In summary, similar to nonoxidized LDL, i) hydrolysis of moxLDL to stage 1 greatly enhances lipoprotein rupture and coalescence into large lipid droplets; and ii) this enhancement is due to FFA and is abolished upon FFA removal.
Comparison with other plasma lipoproteins
To test the effect of PC hydrolysis on the heat-induced rupture of other lipoproteins, we analyzed human plasma HDL and VLDL that have been hydrolyzed by PLA2 and treated with albumin. Representative HDL data are shown in Fig. 9. The results reveal that, similar to LDL, HDL hydrolysis to stage 1 leads to a small but significant increase in FFA (Fig. 9A) and significantly increases the amplitude of the heat-induced rupture, indicating formation of larger lipid droplets (line 1, Fig. 9B); this amplitude decreases upon FFA removal by albumin (1·HSA, Fig. 9B), indicating a reduction in the droplet size. In VLDL, hydrolysis by using 0.05 μg/ml PLA2 promoted heat-induced rupture and coalescence into large lipid droplets at ambient temperature (supplementary Fig. VI B), leading to a rapid lipid phase separation that precluded further studies. Furthermore, similar to LDL, VLDL rupture was hampered upon FFA removal by albumin (data not shown). Importantly, similar to LDL (Fig. 1B), hydrolysis of HDL or VLDL to stage 1 produced no apolipoprotein fragmentation or cross-linking detected by SDS PAGE; hence, the only lipoprotein modification observed at this stage was PC hydrolysis. We conclude that, similar to LDL, mild hydrolysis of PC by PLA2 in HDL or VLDL produces FFA that promote lipoprotein rupture, whereas FFA removal by albumin hampers it.
Fig. 9.

Effect of HDL hydrolysis to stages 1 on the heat-induced HDL remodeling. Human HDL intact (0) or hydrolyzed by using 0.05 μg/ml PLA2 to stage 1 (1). Mildly hydrolyzed HDL were treated with albumin to remove FFA (1·HSA). A: GC analysis of FFA in HDL that were native or hydrolyzed to stage 1. The data show an average of three independent measurements; error bars indicate deviations among individual measurements. B: HDL solutions (0.1 mg/ml protein in buffer A) were heated at a rate of 11°C/h and the melting data were recorded at 222 nm by right-angle light scattering measured in CD experiments for increase in the particle size. The negative baseline slope is an instrumental artifact (45). Lipoprotein fusion into larger HDL-like particles (I) followed by rupture and coalescence into lipid droplets (II) are indicated.
DISCUSSION
The results reported here reveal that the heat-induced coalescence of LDL into lipid droplets is greatly enhanced upon FFA incorporation and is hampered upon FFA removal by albumin. The underlying mechanism for these effects probably relates to the lytic activity of FFA. Similar effects of FFA were observed in LDL that have been hydrolyzed spontaneously upon incubation at 37°C (supplementary Fig. I B, C), hydrolyzed enzymatically by PLA2 (Figs. 5, 6) or by HL (supplementary Fig. V), enriched with exogenous oleic acid (Fig. 7), or oxidized (Fig. 8). Hence, the observed effects are not limited to one particular origin of FFA. Furthermore, these effects of FFA are not limited to LDL because similar effects were observed in HDL upon mild hydrolysis by PLA2 (Fig. 9). Moreover, hydrolysis of VLDL by PLA2 destabilized the lipoproteins to such an extent that they coalesced into lipid droplets at ambient temperatures without heating (supplementary Fig. VI). Consequently, the ability of FFA to promote lipoprotein rupture and coalescence into lipid droplets is a general phenomenon that is not limited to high temperatures but also applies to near-physiologic temperatures.
The results of our in vitro studies are relevant to physiologic conditions of elevated levels of FFA, which may result from the enhanced lipolysis by enzymes such as PLA2 and/or impaired removal of the lipolytic products by albumin. For example, albumin's ability to remove FFA is impaired under acidic conditions in advanced atherosclerotic plaques; under these conditions, LDL retain some of the FFA generated locally upon lipolysis (34). Another example is type-2 diabetes that is characterized by elevated levels of plasma FFA [(49) and references therein]. Our results suggest that these FFA are likely to promote formation of large VLDL- or LDL-derived lipid droplets in atherosclerotic plaques. Furthermore, our results help explain the earlier reports of enhanced lipid droplet formation from oxidized LDL in vivo, even though in vitro studies of isolated LDL showed that their remodeling and droplet formation was impaired upon oxidation (15). We propose that, because oxidized PCs on LDL are preferential substrates of Lp-PLA2 (18), the hydrolytic products generated by Lp-PLA2, particularly FFA, provide a driving force for lipid droplet formation by oxidized LDL in the arterial wall.
Finally, our results suggest that LDL remodeling and coalescence into lipid droplets is not significantly affected by the conformational changes in apoB such as irreversible unfolding of the β-sheet structure. Such progressive β-sheet unfolding was detected upon LDL hydrolysis to stage 1 followed by FFA removal (Fig. 3). This result is consistent with the far-UV CD spectra of hydrolyzed LDL reported by Greco et al. (11). Furthermore, LDL heating also leads to preferential unfolding of the β-sheet structure in apoB (supplementary Fig. IV A) (14). Moreover, preferential unfolding of the β-sheet structure in apoB was observed upon progressive oxidation of small VLDL (50). We conclude that various structural perturbations, including PC hydrolysis, oxidation, and thermal denaturation, lead to preferential unfolding of the β-sheet structure in apoB-containing lipoproteins. Hence, even though the amphipathic β-sheet rich domains are believed to irreversibly anchor apoB to the lipid surface and to be more strongly associated with this surface than the α-helix rich domains (51), the β-structure in apoB is more labile and tends to unfold more readily than the α-helical structure.
Supplementary Material
Acknowledgments
The authors thank Michael Gigliotti and Cheryl England for help with lipoprotein isolation and biochemical analyses.
Footnotes
Abbreviations:
- apo
- apolipoprotein
- CD
- circular dichroism
- DSC
- differential scanning calorimetry
- EM
- electron microscopy
- HSA
- human serum albumin
- Lp-PLA2
- lipoprotein-associated phospholipase A2
- moxLDL
- minimally oxidized LDL
- PC
- phosphatidylcholine
- PLA2
- phospholipase A2
- UV
- ultraviolet
This work was supported by the National Institutes of Health grants RO1 GM 067260 and HL 026355. Its contents are solely the responsibility of the authors and do not necessarily represent the official views of the National Institutes of Health.
The online version of this article (available at http://www.jlr.org) contains supplementary data in the form of six figures.
REFERENCES
- 1.Williams K. J., Tabas I. 1995. The response-to-retention hypothesis of early atherogenesis. Arterioscler. Thromb. Vasc. Biol. 15: 551–561. [DOI] [PMC free article] [PubMed] [Google Scholar]
- 2.Camejo G., Hurt-Camejo E., Wiklund O., Bondjers G. 1998. Association of apo B lipoproteins with arterial proteoglycans: pathological significance and molecular basis. Atherosclerosis. 139: 205–222. [DOI] [PubMed] [Google Scholar]
- 3.Skålén K., Gustafsson M., Rydberg E. K., Hultén L. M., Wiklund O., Innerarity T. L., Borén J. 2002. Subendothelial retention of atherogenic lipoproteins in early atherosclerosis. Nature. 417: 750–754. [DOI] [PubMed] [Google Scholar]
- 4.Chisolm G. M., Steinberg D. 2000. The oxidative modification hypothesis of atherogenesis: an overview. Free Radic. Biol. Med. 28: 1815–1826. [DOI] [PubMed] [Google Scholar]
- 5.de Winther M. P., Hofker M. H. 2000. Scavenging new insights into atherogenesis. J. Clin. Invest. 105: 1039–1041. [DOI] [PMC free article] [PubMed] [Google Scholar]
- 6.Oörni K., Pentikäinen M. O., Ala-Korpela M., Kovanen P. T. 2000. Aggregation, fusion, and vesicle formation of modified low density lipoprotein particles: molecular mechanisms and effects on matrix interactions. J. Lipid Res. 41: 1703–1714. [PubMed] [Google Scholar]
- 7.Guyton J. R., Klemp K. F. 1994. Development of the atherosclerotic core region. Chemical and ultrastructural analysis of microdissected atherosclerotic lesions from human aorta. Arterioscler. Thromb. 14: 1305–1314. [DOI] [PubMed] [Google Scholar]
- 8.De Spirito M., Brunelli R., Mei G., Bertani F. R., Ciasca G., Greco G., Papi M., Arcovito G., Ursini F., Parasassi T. 2006. Low density lipoprotein aged in plasma forms clusters resembling subendothelial droplets: aggregation via surface sites. Biophys. J. 90: 4239–4247. [DOI] [PMC free article] [PubMed] [Google Scholar]
- 9.Guyton J. R. 2001. Phospholipid hydrolytic enzymes in a ‘cesspool’ of arterial intimal lipoproteins: a mechanism for atherogenic lipid accumulation. Arterioscler. Thromb. Vasc. Biol. 21: 884–886. [DOI] [PubMed] [Google Scholar]
- 10.Plihtari R., Hurt-Camejo E., Oörni K., Kovanen P. T. 2010. Proteolysis sensitizes LDL particles to phospholipolysis by secretory phospholipase A2 group V and secretory sphingomyelinase. J. Lipid Res. 51: 1801–1809. [DOI] [PMC free article] [PubMed] [Google Scholar]
- 11.Greco G., Balogh G., Brunelli R., Costa G., De Spirito M., Lenzi L., Mei G., Ursini F., Parasassi T. 2009. Generation in human plasma of misfolded, aggregation-prone electronegative low density lipoprotein. Biophys. J. 97: 628–635. [DOI] [PMC free article] [PubMed] [Google Scholar]
- 12.Liu H., Scraba D. G., Ryan R. O. 1993. Prevention of phospholipase-C induced aggregation of low density lipoprotein by amphipathic apolipoproteins. FEBS Lett. 316: 27–33. [DOI] [PubMed] [Google Scholar]
- 13.Gursky O. 2005. Apolipoprotein structure and dynamics. Curr. Opin. Lipidol. 16: 287–294. [DOI] [PubMed] [Google Scholar]
- 14.Jayaraman S., Gantz D. L., Gursky O. 2005. Structural basis for thermal stability of human low-density lipoprotein. Biochemistry. 44: 3965–3971. [DOI] [PubMed] [Google Scholar]
- 15.Jayaraman S., Gantz D. L., Gursky O. 2007. Effects of oxidation on the structure and stability of human low-density lipoprotein. Biochemistry. 46: 5790–5797. [DOI] [PubMed] [Google Scholar]
- 16.Hakala J. K., Oörni K., Pentikäinen M. O., Hurt-Camejo E., Kovanen P. T. 2001. Lipolysis of LDL by human secretory phospholipase A(2) induces particle fusion and enhances the retention of LDL to human aortic proteoglycans. Arterioscler. Thromb. Vasc. Biol. 21: 1053–1058. [DOI] [PubMed] [Google Scholar]
- 17.Oörni K., Kovanen P. T. 2009. Lipoprotein modification by secretory phospholipase A(2) enzymes contributes to the initiation and progression of atherosclerosis. Curr. Opin. Lipidol. 20: 421–427. [DOI] [PubMed] [Google Scholar]
- 18.Davis B., Koster G., Douet L. J., Scigelova M., Woffendin G., Ward J. M., Smith A., Humphries J., Burnand K. G., Macphee C. H., et al. 2008. Electrospray ionization mass spectrometry identifies substrates and products of lipoprotein-associated phospholipase A2 in oxidized human low density lipoprotein. J. Biol. Chem. 283: 6428–6437. [DOI] [PubMed] [Google Scholar]
- 19.Yedgar S., Cohen Y., Shoseyov D. 2006. Control of phospholipase A2 activities for the treatment of inflammatory conditions. Biochim. Biophys. Acta. 1761: 1373–1382. [DOI] [PubMed] [Google Scholar]
- 20.Jönsson-Rylander A. C., Lundin S., Rosengren B., Pettersson C., Hurt-Camejo E. 2008. Role of secretory phospholipases in atherogenesis. Curr. Atheroscler. Rep. 10: 252–259. [DOI] [PubMed] [Google Scholar]
- 21.Corson M. A. 2009. Emerging inflammatory markers for assessing coronary heart disease risk. Curr. Cardiol. Rep. 11: 452–459. [DOI] [PubMed] [Google Scholar]
- 22.Rosenson R. S., Gelb M. H. 2009. Secretory phospholipase A2: a multifaceted family of proatherogenic enzymes. Curr. Cardiol. Rep. 11: 445–451. [DOI] [PubMed] [Google Scholar]
- 23.Macphee C. H., Nelson J. J., Zalewski A. 2005. Lipoprotein-associated phospholipase A2 as a target of therapy. Curr. Opin. Lipidol. 16: 442–446. [DOI] [PubMed] [Google Scholar]
- 24.Wilensky R. L., Shi Y., Mohler E. R., Hamamdzic D., Burgert M. E., Li J., Postle A., Fenning R. S., Bollinger J. G., Hoffman B. E., et al. 2008. Inhibition of lipoprotein-associated phospholipase A2 reduces complex coronary atherosclerotic plaque development. Nat. Med. 14: 1059–1066. [DOI] [PMC free article] [PubMed] [Google Scholar]
- 25.Wilensky R. L., Macphee C. H. 2009. Lipoprotein-associated phospholipase A(2) and atherosclerosis. Curr. Opin. Lipidol. 20: 415–420. [DOI] [PubMed] [Google Scholar]
- 26.Braun L. T., Davidson M. H. 2010. Lp-PLA2: a new target for statin therapy. Curr. Atheroscler. Rep. 12: 29–33. [DOI] [PubMed] [Google Scholar]
- 27.White H. 2010. Editorial: why inhibition of lipoprotein-associated phospholipase A2 has the potential to improve patient outcomes. Curr. Opin. Cardiol. 25: 299–301. [DOI] [PubMed] [Google Scholar]
- 28.Gaubatz J. W., Gillard B. K., Massey J. B., Hoogeveen R. C., Huang M., Lloyd E. E., Raya J. L., Yang C. Y., Pownall H. J. 2007. Dynamics of dense electronegative low density lipoproteins and their preferential association with lipoprotein phospholipase A(2). J. Lipid Res. 48: 348–357. [DOI] [PubMed] [Google Scholar]
- 29.Bancells C., Villegas S., Blanco F. J., Benitez S., Gallego I., Beloki L., Perez-Cuellar M., Ordonez-Llanos J., Sanchez-Quesada J. L. 2010. Aggregated electronegative low-density lipoprotein in human plasma shows high tendency to phospholipolysis and particle fusion. J. Biol. Chem. 285: 32425–32435. [DOI] [PMC free article] [PubMed] [Google Scholar]
- 30.Brown W. J., Chambers K., Doody A. 2003. Phospholipase A2 (PLA2) enzymes in membrane trafficking: mediators of membrane shape and function. Traffic. 4: 214–221. [DOI] [PubMed] [Google Scholar]
- 31.Chernomordik L. V., Kozlov M. M. 2008. Mechanics of membrane fusion. Nat. Struct. Mol. Biol. 15: 675–683. [DOI] [PMC free article] [PubMed] [Google Scholar]
- 32.Desbois A. P., Smith V. J. 2010. Antibacterial free fatty acids: activities, mechanisms of action and biotechnological potential. Appl. Microbiol. Biotechnol. 85: 1629–1642. [DOI] [PubMed] [Google Scholar]
- 33.Chung B. H., Tallis G. A., Cho B. H., Segrest J. P., Henkin Y. 1995. Lipolysis-induced partitioning of free fatty acids to lipoproteins: effect on the biological properties of free fatty acids. J. Lipid Res. 36: 1956–1970. [PubMed] [Google Scholar]
- 34.Lähdesmäki K., Plihtari R., Soininen P., Hurt-Camejo E., Ala-Korpela M., Oörni K., Kovanen P. T. 2009. Phospholipase A(2)-modified LDL particles retain the generated hydrolytic products and are more atherogenic at acidic pH. Atherosclerosis. 207: 352–359. [DOI] [PubMed] [Google Scholar]
- 35.Schumaker V. N., Puppione D. L. 1986. Sequential flotation ultracentrifugation. Methods Enzymol. 128: 155–170. [DOI] [PubMed] [Google Scholar]
- 36.Hakala J. K., Oörni K., Ala-Korpela M., Kovanen P. T. 1999. Lipolytic modification of LDL by phospholipase A2 induces particle aggregation in the absence and fusion in the presence of heparin. Arterioscler. Thromb. Vasc. Biol. 19: 1276–1283. [DOI] [PubMed] [Google Scholar]
- 37.Smith E. B. 1990. Transport, interactions and retention of plasma proteins in the intima: the barrier function of the internal elastic lamina. Eur. Heart J. 11(Suppl. E): 72–81. [DOI] [PubMed] [Google Scholar]
- 38.Parthasarathy S., Barnett J. 1990. Phospholipase A2 activity of low density lipoprotein: evidence for an intrinsic phospholipase A2 activity of apoprotein B-100. Proc. Natl. Acad. Sci. USA. 87: 9741–9745. [DOI] [PMC free article] [PubMed] [Google Scholar]
- 39.Reisfeld N., Lichtenberg D., Dagan A., Yedgar S. 1993. Apolipoprotein B exhibits phospholipase A1 and phospholipase A2 activities. FEBS Lett. 315: 267–270. [DOI] [PubMed] [Google Scholar]
- 40.Esterbauer H., Gebicki J., Puhl H., Jürgens G. 1992. The role of lipid peroxidation and antioxidants in oxidative modification of LDL. Free Radic. Biol. Med. 13: 341–390. [DOI] [PubMed] [Google Scholar]
- 41.Skipski V. P., Barclay M., Barclay R. K., Fetzer V. A., Good J. J., Archibald F. M. 1967. Lipid composition of human serum lipoproteins. Biochem. J. 104: 340–352. [DOI] [PMC free article] [PubMed] [Google Scholar]
- 42.Folch J., Lees M., Sloane Stanley G. H. 1957. A simple method for the isolation and purification of total lipides from animal tissues. J. Biol. Chem. 226: 497–509. [PubMed] [Google Scholar]
- 43.Morrison W. R., Smith L. M. 1964. Preparation of fatty acid methyl esters and dimethylacetals from lipids with boron fluoride-methanol. J. Lipid Res. 5: 600–608. [PubMed] [Google Scholar]
- 44.Myher J. J., Kuksis A., Pind S. 1989. Molecular species of glycerophospholipids and sphingomyelins of human erythrocytes: improved method of analysis. Lipids. 24: 396–407. [DOI] [PubMed] [Google Scholar]
- 45.Benjwal S., Verma S., Röhm K. H., Gursky O. 2006. Monitoring protein aggregation during thermal unfolding in circular dichroism experiments. Protein Sci. 15: 635–639. [DOI] [PMC free article] [PubMed] [Google Scholar]
- 46.Scanu A., Hirz R. 1968. Human serum low-density lipoprotein protein: its conformation studied by circular dichroism. Nature. 218: 200–201. [DOI] [PubMed] [Google Scholar]
- 47.Prassl R., Pregetter M., Amenitsch H., Kriechbaum M., Schwarzenbacher R., Chapman J. M., Laggner P. 2008. Low density lipoproteins as circulating fast temperature sensors. PLoS One. 3(12): e4079. [DOI] [PMC free article] [PubMed] [Google Scholar]
- 48.Deckelbaum R. J., Ramakrishnan R., Eisenberg S., Olivecrona T., Bengtsson-Olivecrona G. 1992. Triacylglycerol and phospholipid hydrolysis in human plasma lipoproteins: role of lipoprotein and hepatic lipase. Biochemistry. 31: 8544–8551. [DOI] [PubMed] [Google Scholar]
- 49.Zhang W. Y., Schwartz E., Wang Y., Attrep J., Li Z., Reaven P. 2006. Elevated concentrations of nonesterified fatty acids increase monocyte expression of CD11b and adhesion to endothelial cells. Arterioscler. Thromb. Vasc. Biol. 26: 514–519. [DOI] [PubMed] [Google Scholar]
- 50.Guha M., Gursky O. 2010. Effects of oxidation on structural stability and remodeling of human very low density lipoprotein. Biochemistry. 49: 9584–9593. [DOI] [PMC free article] [PubMed] [Google Scholar]
- 51.Wang L., Walsh M. T., Small D. M. 2006. Apolipoprotein B is conformationally flexible but anchored at a triolein/water interface: a possible model for lipoprotein surfaces. Proc. Natl. Acad. Sci. USA. 103: 6871–6876. [DOI] [PMC free article] [PubMed] [Google Scholar]
Associated Data
This section collects any data citations, data availability statements, or supplementary materials included in this article.