

Abstract
The “Polynesian motif” defines a lineage of human mtDNA that is restricted to Austronesian-speaking populations and is almost fixed in Polynesians. It is widely thought to support a rapid dispersal of maternal lineages from Taiwan ∼4000 years ago (4 ka), but the chronological resolution of existing control-region data is poor, and an East Indonesian origin has also been proposed. By analyzing 157 complete mtDNA genomes, we show that the motif itself most likely originated >6 ka in the vicinity of the Bismarck Archipelago, and its immediate ancestor is >8 ka old and virtually restricted to Near Oceania. This indicates that Polynesian maternal lineages from Island Southeast Asia gained a foothold in Near Oceania much earlier than dispersal from either Taiwan or Indonesia 3–4 ka would predict. However, we find evidence in minor lineages for more recent two-way maternal gene flow between Island Southeast Asia and Near Oceania, likely reflecting movements along a “voyaging corridor” between them, as previously proposed on archaeological grounds. Small-scale mid-Holocene movements from Island Southeast Asia likely transmitted Austronesian languages to the long-established Southeast Asian colonies in the Bismarcks carrying the Polynesian motif, perhaps also providing the impetus for the expansion into Polynesia.
Main Text
The colonization of Polynesia has been debated for several centuries, but for the last few decades, the “out of Taiwan” model, based in the first instance on linguistic arguments, has remained the most widely favored explanation. This model suggests that the Austronesian-speaking populations of Island Southeast Asia (ISEA), Near Oceania, and Remote Oceania (including Polynesians) have a common origin among early Taiwanese agricultural groups who dispersed into ISEA ∼4000 years ago (4 ka), reaching Near Oceania ∼3.5 ka.1,2 These people are often considered largely responsible for the Lapita phenomenon, a cultural complex including finely decorated dentate-stamped pottery, obsidian tools, and shell ornaments that first appeared on the coasts of the Bismarck Archipelago ∼3.5 ka, spreading into Remote Oceania ∼3 ka. Alternative models propose that there have been maritime contacts between Southeast Asia and Near Oceania from the end of the Pleistocene ∼12 ka,3 or at least before the mid-Holocene, by ∼6 ka,4 leading to the formation of spheres of interaction along a “voyaging corridor” between Near Oceania and ISEA.5–7 Hybrid models suggest involvement of both incoming Austronesian speakers from ISEA and indigenous populations in the Bismarck Archipelago.8 Recently, it has been suggested that Taiwan's role as source of the Austronesian languages may have emerged as it became incorporated into the periphery of maritime networks centered farther to the south, with minimal gene flow.9
Questions about prehistoric dispersals can be addressed more directly by archaeogenetics than by either archaeology or linguistics. The “Polynesian motif” and its descendants comprise a clade of mtDNA lineages that together account for >90% of Polynesian mtDNAs.10–12 For the last 15 years, it has been recognized that the age and distribution of this clade are key to resolving the issue of the peopling of Polynesia.10,13–16 However, most of the data so far available come from the first hypervariable segment of the mtDNA control region (HVS-I), the interpretation of which has been highly controversial because of its poor phylogeographic resolution. Some have argued that its variation supports the “out of Taiwan” model for Pacific maternal lineages,10–12,15,16 whereas others have argued for an origin for the motif—and therefore the maternal ancestry of the vast majority of islanders themselves—before the mid-Holocene in Wallacea, Eastern Indonesia.13,14,17
Molecular-clock estimates based on the genetic diversity accumulated within founder lineages—that is to say, the level of variation that has arisen since a particular lineage arrived in a particular location—can be used as a proxy for colonization times.18 However, HVS-I sequences, and indeed synonymous sites from complete coding-region sequences, lack the chronological resolution needed to distinguish models that differ in predicted dispersal times by only a few thousand years. To provide the necessary precision, we calibrated the mutation rate for the entire mtDNA genome, and to be confident of the accuracy of the clock, we also corrected for the effects of purifying selection.19 We then applied the improved clock, with both the simple unbiased ρ statistic and maximum likelihood (ML), to the analysis of 157 complete mtDNA genomes (81 new to this study; see Table S1 available online) belonging to haplogroup B4 from mainland East and Southeast Asians, aboriginal Taiwanese, Island Southeast Asians, and Near and Remote Oceanians (as well as two Native Americans). For our purposes, ISEA includes the Philippines, Indonesia, and Malaysian Borneo; Near Oceania (the western Pacific) includes New Guinea, the Bismarck Archipelago, Bougainville, and the Solomon Islands; and Remote Oceania includes Island Melanesia southeast of the Solomons (including Vanuatu and Fiji), Polynesia, and Micronesia (Figure 1).
Figure 1.
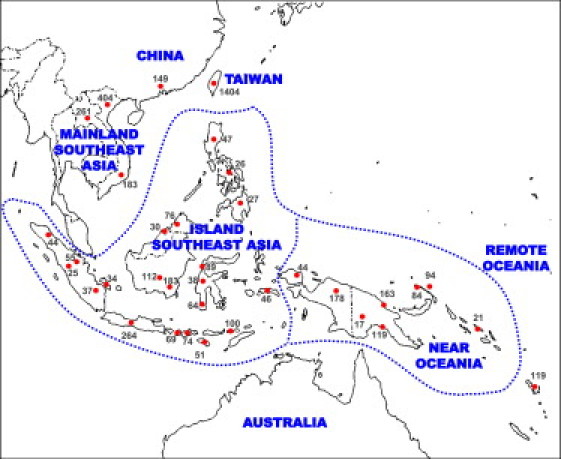
Map Showing China, Taiwan, MSEA, ISEA, Near Oceania, and Remote Oceania
Sampling locations and sample sizes for HVS-I sequences used in the Surfer analyses are indicated. MSEA denotes Mainland Southeast Asia; ISEA denotes Island Southeast Asia.
DNA sequencing at the University of Leeds used an ABI 16-capillary 3130XL DNA Analyzer and the protocol of Torroni et al.,20 and DNA sequencing at Taipei used an ABI 48-capillary 3730/3730X DNA Analyzer. The work was approved by the University of Leeds, Faculty of Biological Sciences Ethics Committee and the Human Experiment Committee of the Mackay Memorial Hospital in Taipei, and the samples were collected with the appropriate informed consent of the subjects. We generated 16 of the 81 new mtDNA genomes by denaturing high-performance liquid chromatography (dHPLC) and hybridization with a previously sequenced root-type B4a1a1a sequence;21 heteroduplexes indicated differences from the root type. We ran the samples on an automated 3500HT Wave (Transgenomic) dHPLC instrument and analyzed the results with the Navigator software. We sequenced all samples with elution profiles that differed from the standard fragment and the two most different samples in the scattergraph of the Navigator software for each temperature in each fragment in order to check for undetected mutations in the dHPLC analysis. As additional checks, we also sequenced random fragments from each sample and completely sequenced four samples. We detected no extra mutations in any fragments presenting standard elution profiles.
We carried out the phylogenetic analysis via the reduced-median algorithm22 with the Network 4.5 software with a total of 164 sequences (Figure S1). These included all of the available B4a sequences (34–157 in Table S1), additional sequences representing the overall structure of the B4 tree (1–33 in Table S1), and seven sequences to root the B4 network and represent the roots of haplogroups B, R, and N (unnumbered sequences in Table S1).
To provide the maximum possible detail about the phylogeography of the lineages, we also analyzed 4793 HVS-I sequences, including published sequences from Taiwan,17,23,24 the Philippines,17,25,26 the rest of ISEA,17,26–28 the north coast of New Guinea,29 Karkar Island,30 the Papua New Guinea highlands,31 the south coast of New Guinea,32 the Bismarck Archipelago,33 Bougainville,33 the Solomon Islands,33 Vanuatu,34 Tonga,32 Samoa,35 and Madagascar.36 All previously unpublished B4 data are shown in Table S2 and Figure 1, along with sample size and location information. Some of the data did not include the full stretch of HVS-I that we used in the analysis (positions 16051–16400), but the available stretches included >90% of the variation, and their inclusion greatly strengthened the analysis because of their key locations.
We tested all of the unclassified B4a samples in the Leeds laboratory at positions 6719, 10238, 12239, and 15745, defining haplogroup B4a1a by direct sequencing. Position 6719 was determined by restriction analysis in Taipei by using the enzyme NalIII, whereas position 10238 was determined by direct sequencing. Almost all of the samples fell into B4a1a (Figure S1), the offshore clade identified by Trejaut et al.23
The published HVS-I sequences, except for the Philippine data of Tabbada et al.,25 had not been tested for any marker for B4a1a, but we can safely assume that the great majority of B4a∗ (that is, excluding B4a1a1) lineages in ISEA and Taiwanese Austronesian-speaking aboriginals belong to B4a1a. With the exception of B4a2, which can be identified from its HVS-I motif, all of the B4a samples we tested from aboriginal Taiwanese Austronesian-speakers, and >93% of the ISEA samples analyzed, belonged to this clade.
All of the available samples in the Leeds laboratory, and most of those in Taipei, were also tested by sequencing for the transition at position 14022 that defines B4a1a1 (Table S2). All of the B4a1a∗ samples (with transitions at HVS-I positions 16189, 16217, and 16261) tested from the north coast of New Guinea (except for one [Table S2], plus a published B4a1a1∗ sequence from the Trobriand Islands), the south coast of New Guinea, and the Bismarck Archipelago were from B4a1a1. One sample in ISEA (from Ujung Pandang) was from B4a1a1∗ (Table S2), and two from the Philippines (one from Mindanao and one from an undetermined location) have also been detected.25 For variation within New Guinea and the Pacific in published data (not tested for 14022), we assumed that the samples belong mainly to the B4a1a1 clade, because 98.6% of the samples that we tested were from this clade.
We estimated clade ages for both complete genomes and HVS-I19 and analyzed different data sets independently in order to explore different geographical aspects of the diversity in the B4a1a tree. We excluded Remote Pacific sequences from clade age estimates because they have undergone severe founder effects and redispersals (although they were used to calculate founder ages for the locations concerned). For ML analyses, four different trees were used, including the same set of deeper lineages, but differing in the B4a1a data included: tree 1 included all the available B4a1a complete mtDNAs from Taiwan, ISEA, and Near Oceania, tree 2 included only the B4a1a data set from Taiwan, tree 3 included only the B4a1a data set from ISEA, and tree 4 included only the B4a1a1 data set from the Bismarck Archipelago. The sequences used in each tree are shown in Table S1.
We carried out founder analysis to estimate settlement times as we previously did, using the f1 criterion to identify founder sequence types by screening out likely back-migration and back-mutation.18,37,38 Founder age estimates use only the ρ statistic because no way yet exists of employing ML for this purpose. Cross-comparison of age estimates via both approaches (e.g., Table 1) shows that they give comparable results, albeit with wider confidence intervals for ρ.
Table 1.
Age Estimates for B4a1a1 and B4a1a1a
| Indonesia (yr) | Bismarcks (yr) | Overall (yr) | |
|---|---|---|---|
| B4a1a1 | |||
| Maximum likelihood | 6000 (3400; 8650) | 8400 (4850; 12,050) | 6800 (4950; 8700) |
| Complete genome clock, ρ | 5650 (1050; 10,400) | 9300 (3600; 15,200) | 7900 (3450; 12,450) |
| Synonymous, ρ | 4300 (850; 7750) | 8550 (1500; 15,600) | 6500 (2000; 11,000) |
| Control region, ρa | 0 (0) | 12250 (0; 25,650) | 9300 (2250; 16,350) |
| B4a1a1a | |||
| Maximum likelihood | 4000 (2000; 6000) | 6650 (4500; 8850) | 5300 (4050; 6600) |
| Complete genome clock, ρ | 3900 (1950; 5850) | 6950 (3600; 10,400) | 5850 (3850; 7800) |
| Synonymous, ρ | 4750 (950; 8500) | 9050 (800; 17,350) | 7150 (1750; 12,550) |
| Control region, ρ | 3450 (250; 6600) | 12,000 (5350; 18,650) | 7700 (4300; 11,100) |
B4a1a1 and B4a1a1a are defined by the “pre-motif” and the Polynesian motif, respectively. Estimates with associated 95% confidence limits are shown for Indonesia, the Bismarck Archipelago, and the overall data set via maximum likelihood (complete genomes) and ρ for three different molecular clocks, two of them with independent sources of variation (control region and synonymous clocks).
Corresponds to paragroup B4a1a1∗.
We calculated haplotype diversity as before17 and calculated the mean number of pairwise differences (π) and the ρ statistic with Network 4.5. We also used ρ, usually presented as a measure of time depth, as a diversity index for different geographic regions. Note that the associated age estimates in these cases do not correspond to the time of arrival of the clade into each geographic region, because in most cases diversity is carried over from the source to the sink and must be excluded from any age estimates, as is done systematically in a founder analysis. Thus, in the founder analyses, a founder age, corresponding to a ρ value that excludes any diversity present in the hypothetical source population or populations, was used to approximate the arrival time of a clade in a geographic region. There is one particular case, however, in which the raw age estimate calculated from the diversity of a clade is meaningful in terms of time depth: this is the case for the region in which the clade first arose. In this case, the time to the most recent common ancestor also estimates the time in which it has been evolving within that region.
The Polynesian motif defines a recent, geographically restricted subclade, B4a1a1a, of haplogroup B4 (Figure 2; for more detail, see Figure S1). Haplogroup B4 itself arose ∼44 ka, most likely on the East Asian or Southeast Asian mainland, where it is dispersed especially around the coastal regions from Vietnam to Japan. It subdivided ∼35 ka into three main subclades: B4a, B4b'd, and B4c (with a subclade of B4b, B2, found uniquely in Native Americans and dating to ∼15 ka19). Subclades B4a and B4a1 are also likely to have arisen on the mainland, ∼24 ka and ∼20 ka, respectively, but B4a1a is restricted to offshore populations in Taiwan, ISEA, and the Pacific (Figure 3A).15,23 Its distribution and age of 8–12 ka (Figure 4; Table S3) suggest that people carrying B4a1a may have been separated from the Asian mainland by the sea-level rises that accompanied global warming at the end of the Pleistocene.39 The long stalk from B4a1a to its ancestral B4a1 node ∼20 ka suggests extensive genetic drift during this period; this pattern of long late-Pleistocene branches followed by Holocene starbursts is also seen in haplogroup E, which has a similar distribution.38 Although an early Holocene dispersal from Taiwan to ISEA is possible,23 diversity indices (Table S4) suggest that the presence of B4a1a in Taiwan more likely represents a dispersal event from ISEA, which a founder analysis would date to ∼6.3 ka (Table S5), again mirroring haplogroup E. Dispersal from ISEA to Taiwan has also recently been indicated by large-scale genome-wide SNP analysis.40
Figure 2.
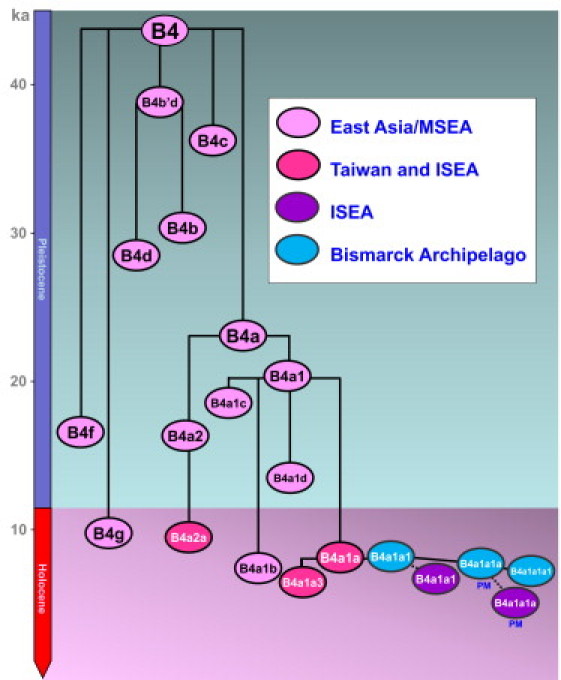
Chronology of Human mtDNA Haplogroup B4, with a Focus on the Austronesian-Specific B4a1a Clade
Branch lengths were estimated via maximum likelihood (ML) and a time-dependent molecular clock obtained from four ML trees, with data from different regions within B4a1a (overall data, Taiwan, ISEA, and Bismarck Archipelago only). ISEA denotes Island Southeast Asia; PM denotes Polynesian motif.
Figure 3.
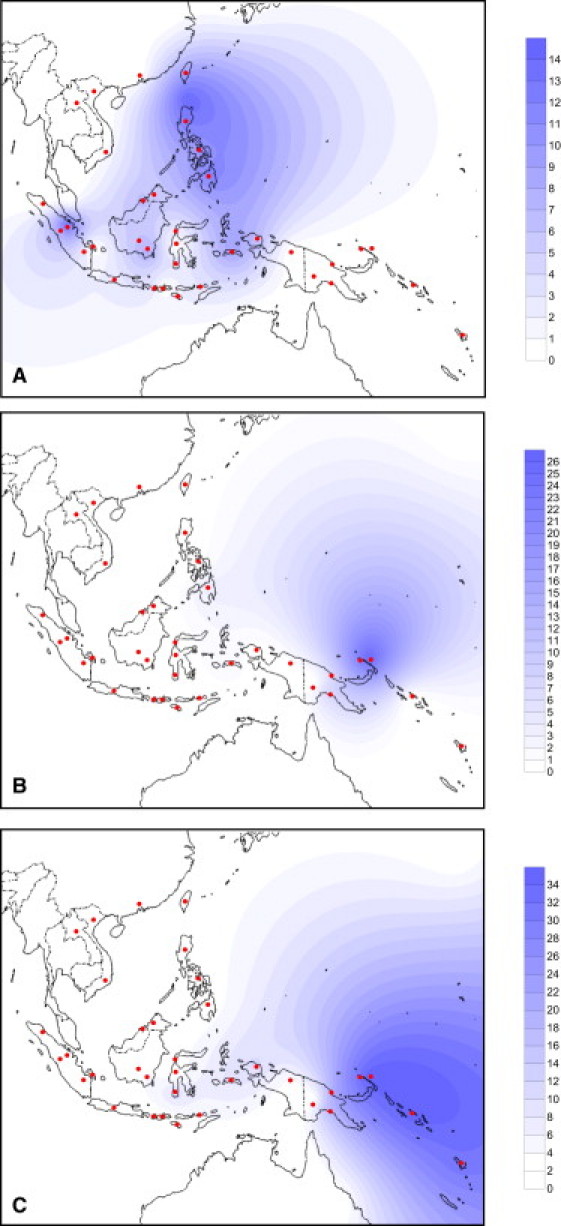
Spatial Frequency Distributions of HVS-1 Variation Created by using the Kriging Algorithm of the Surfer Package
(A) Paragroup B4a1a∗ (excluding B4a1a1).
(B) Paragroup B4a1a1∗ (excluding B4a1a1a).
(C) Haplogroup B4a1a1a (defined by the Polynesian motif).
Figure 4.
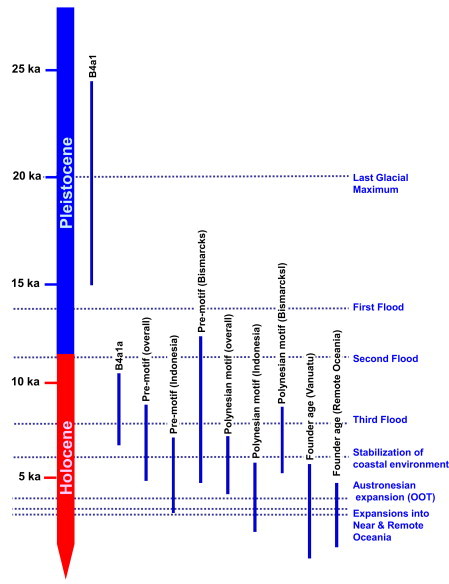
B4a1a Age Estimates and Putative Prehistoric Processes
Overlapping ranges of the 95% confidence intervals of the different age estimates within B4a1a and estimated times of several hypothetical events in archaeology and paleoclimatology are indicated. Details of age estimates within the B4a1a clade are presented in Table 1 and Tables S3 and S8.
B4a1a1, the clade defined by the “pre-motif” transition at position 14022,23 is the immediate ancestor of the subclade carrying the Polynesian motif. It is absent from Taiwan and found primarily in Near Oceania, with a strong geographical focus on the Bismarck Archipelago (Figure 3B). It is also most diverse in the Bismarcks (Table 1 and Table S6), and although the overall age is estimated at ∼6.8 (95% confidence interval [CI]: 4.9, 8.7) ka, this rises to ∼8.4 (95% CI: 4.9, 12.1) ka with data only from the Bismarcks region, whereas the age estimates for Indonesia are consistently lower than those for the Bismarcks. Thus, B4a1a1 most likely either arose from a B4a1a ancestor within the Bismarcks or arrived there from further west in the early Holocene, much earlier than the appearance of Lapita and the putative arrival of Austronesian languages (3.5 ka at most).
This interpretation differs from that of Tabbada et al.,25 but their analysis relies upon only two B4a1a1∗ paragroup sequences (i.e., B4a1a1 lineages excluding B4a1a1a) identified in the Philippines (one of which is from an unprovenanced sample), which our analysis suggests are most likely recent migrants from farther south. B4a1a1 occurs at <0.5% in the existing Philippine data.
B4a1a1a, the clade defined by the Polynesian motif, arose because of a transition at the control-region position 16247.11 It is the most frequent subclade within B4a1a and approaches fixation in Remote Oceania. Its distribution (Figure 3C) radiates dramatically eastward from the Bismarcks, with subsequent minor reverse flow westward into Wallacea25 (and ultimately into Madagascar36). In contrast to its ancestral cluster (the premotif B4a1a1∗), B4a1a1a has been seen at moderate frequencies in Indonesia, to the east of Wallace's line. However the virtual absence of B4a1a1∗ in Indonesia makes the motif's origin in Wallacea very unlikely, contrary to our earlier suggestion that assumed a simple west-to-east progression.13
In fact, as for B4a1a1∗, the geographic region of highest control-region diversity is the Bismarck Archipelago, decreasing with distance both west and east (Table S7). The diversity in Indonesia is markedly lower than in the Bismarcks, and—except for the high variation in the nearby Bougainville Island—it is substantially lower everywhere else that the clade is found, whatever the diversity measure employed. Furthermore, the lower bound of the HVS-I age estimate with the Bismarck data alone is 5.4 ka, clearly excluding the ∼4 ka timing of the putative “out of Taiwan” dispersal through ISEA and the arrival in the Bismarck Archipelago at 3.5 ka. The lower bounds of the age estimates obtained from the overall data set (and overall Near Oceania) also exclude these ages (Table S7).
The overall age estimated for the motif from complete mtDNAs is 5.3 (95% CI: 4.1, 6.6) ka. However, taking the value for the Bismarck Archipelago alone as the best estimate for the age of the clade (because, if it represents its place of origin, it should be least susceptible to subsequent founder effects), the motif is most likely at least 6.5 ka old (Table 1). The lower bounds of the 95% confidence limits for both estimates clearly exclude the Lapita horizon of ∼3.5 ka. Considering the age estimates from HVS-I on the north coast of New Guinea (∼5.4 ka) and ISEA (∼3.5 ka) and the age estimates in Indonesia from complete mtDNA genomes (ranging from 3.9 to 4.8 ka; Table 1), it is possible that the clade dispersed west from the Bismarcks into ISEA as early as 4–5 ka.
A pre-Lapita origin in the Bismarcks is also supported by a further major subclade, B4a1a1a1, nested within the motif clade, defined by a transition at position 6905 (Figure S1), dating to 6.8 (95% CI: 3.7, 9.8) ka via complete mtDNAs. It was carried into Remote Oceania but has not been detected in Indonesian West Papua and has been observed in only one sample from the north coast of Papua New Guinea. Most likely, the clade arose after the main redispersal of the Polynesian motif to the west or, at least, was present at a lower frequency at that time and was therefore not carried by the dispersal into ISEA.
A complete mtDNA founder estimate for the dispersal into Remote Oceania, with the f1 criterion18 and based on 12 B4a1a1a lineages sampled from Vanuatu, is 3.5 (95% CI: 1.2, 5.8) ka (Table S8). Although imprecise, the point estimate is strikingly close to the likely Lapita founder age of 3.1–3.3 ka41 (based on radiocarbon, and uncontroversial for Remote Oceania because this was the first settlement), corroborating the mutation rate used here. For Polynesia, the only usable data sets for cross-checking are of HVS-I variation. There is reasonable agreement that Western Polynesia was colonized about 2.9 ka,42 and the HVS-I point estimate is 2.95 ka (Table S8). The founder age in Madagascar from ISEA is 1.9 (95% CI: 0, 4.2) ka via HVS-I data. Although the independent variation in Madagascar is small and the confidence interval wide, the point estimate correlates rather well with the earliest human presence in Madagascar, assumed to be due to the arrival of Austronesian-speaking people from ISEA, without discriminating alternative models that differ by about 1000 years or so.43
Given that the Polynesian motif and its predecessors evidently represent an earlier expansion, we then addressed the question of whether other mtDNAs from ISEA might track the presumed spread of Austronesian languages into Near Oceania at the time of Lapita. We checked for the presence of other lineages within the hypothetical sphere of interaction5 in which B4a1a1∗ and B4a1a1a are found by dividing our overall HVS-I data sets into geographic classes: Wallacea, the north coast of New Guinea, the Bismarck Sea, the south coast of New Guinea, the Solomon Islands, and Remote Oceania (Table S9). We then assumed that a lineage was potentially part of the voyaging corridor gene pool if it was found in at least three of these regions. We also included the Philippines and Taiwan in the analysis to check whether any of the lineages could have entered this region from the north.
The results indicate that a number of other mtDNAs may indeed track movements between ISEA and Near Oceania, in both directions, during the Holocene (Table S9). Low levels of haplogroup E1b38 are distributed from ISEA to Near Oceania but no further, with a founder age of ∼3.4 (95% CI: 0.5, 6.5) ka. Several other lineages from ISEA (within B5b and M7b1) are also found at low frequencies in coastal New Guinea and Vanuatu. The M7b1 lineage distributed between ISEA and the Bismarcks likely originated in Taiwan, although it makes up <0.1% of mtDNAs sampled in the Bismarcks to date.
Conversely, there are a number of haplogroup Q1 and Q2 subclusters, probably all originating in the New Guinea region and with Pleistocene or early-Holocene time depths in the Bismarcks, which extend westward as far as Mainland Southeast Asia, and two of these have also spread east into Remote Oceania, thus matching closely the pattern for B4a1a1a. Several others extend eastward at least as far as the Bismarcks and/or Solomon Islands, and haplogroup P1 may also have spread from New Guinea to Vanuatu via the Bismarcks (Table S9). However, the indigenous lineages of the Bismarck Archipelago, M27, M28, and M29, are rarely found beyond their place of origin.
A deep ancestry for the Polynesian motif in the Bismarcks was proposed several years ago on the basis of HVS-I evidence (albeit without error estimates) but was subsequently rejected because of concerns, which have now been addressed, about the mtDNA clock.19,44,45 Our results show that the maternal ancestors of most Remote Pacific islanders split from Asian mainland lineages ∼10–20 ka, rather than ∼5.5 ka, as would be the case if they were to be explained by the “out of Taiwan” model. They had established themselves in the Bismarck Archipelago by at least ∼6 ka, rather than arriving there ∼3.5 ka with the advent of Lapita pottery, as the model predicts.46 Haplogroup B4a1a, although almost exclusively associated with speakers of Austronesian languages, cannot have dispersed from Taiwan into ISEA and the Pacific 3–4 ka. The 95% confidence limits on the ages of B4a1a1 and B4a1a1a from complete mtDNAs explicitly reject this explanation for their distribution (Table 1). Because B4a1a, along with some haplogroup Q lineages—of likely New Guinean origin, which occur in Polynesia at a rate of <5%10,12—make up almost all of the mtDNAs found in Polynesia, these results exclude any significant direct Taiwanese contribution from ∼4 ka to the maternal ancestry of Polynesians. (We cannot entirely rule out an early Holocene dispersal from Taiwan >8 ka,23 but such a dispersal would not match the archaeologically dated “out of Taiwan” model.)
In ruling out both a simple Taiwanese and a Wallacean origin, these results also contradict an influential “slow boat” model for Polynesian origins that suggests an ancestry in Taiwan at ∼4 ka for the maternal line of descent while positing a large Near Oceanic origin for the male side, based on Y chromosome evidence.10,47–49 Our results suggest instead that the mtDNA subclade B4a1a and the major Pacific Y chromosome haplogroup C2 might be distributed in a rather similar way, with a proximally Near Oceanic, but ultimately Southeast Asian, ancestry. Several widely distributed paternal subclades may have a Taiwanese ancestry, but they only occur in Oceania at low frequencies.49,50 Available autosomal microsatellite diversity, furthermore, suggests that Polynesian patterns show a partly East Asian and partly Near Oceanic ancestry at low resolution but are distinct from both at higher resolution.51,52 This is also compatible with our model of a largely ancient Asian ancestry for Polynesian origins, with an early Holocene incubation period in ISEA and then in Near Oceania. The male and female lines of descent may therefore not have such radically contrasting histories as some have proposed.10,53
The spread of B4a1a1a back through New Guinea into ISEA, which most likely took place ∼4–5 ka, suggests instead that models based on the idea of a “voyaging corridor,”5,7 facilitating exchange between ISEA and Near Oceania, may provide a more plausible backdrop to the settlement of the Remote Pacific. The HVS-I database provides further indications of small-scale bidirectional movements across this region. E1b, in particular, might plausibly have been carried by small numbers of Austronesian-speaking voyagers who integrated with coastal-dwelling B4a1a1 groups in the Bismarcks (where it is present at ∼5%), perhaps stimulating the rise and spread of the Lapita culture and the dispersal of the Oceanic languages.38 Other lineages from Southeast Asia are also found at low frequencies in Near Oceania, and still others are candidates for dispersal from Taiwan into eastern Indonesia via the Philippines, but they did not reach Oceania.25 Some of these may have also been involved in the transmission of Austronesian culture and languages, although they evidently had no demic role in the founding of Polynesia.
Thus, although our results rule out any substantial maternal ancestry in Taiwan for Polynesians, they do not preclude an Austronesian linguistic dispersal from Taiwan to Oceania 3–4 ka,54 mediated by social networks rather than directly by people of Taiwanese ancestry but perhaps involving small numbers of migrants at various times.9 The mtDNA patterns point to the possibility of a staged series of dispersals of small numbers of Austronesian speakers, each followed by a period of extensive acculturation and language shift.55
Overall, though, the mtDNA evidence highlights a deeper and more complex history of two-way maritime interaction between ISEA and Near Oceania than is evident from most previous accounts.54 Archaeological and linguistic evidence for maritime interaction between ISEA and Near Oceania during the early and mid-Holocene is strengthening, however,9,56 and it has been suggested that contacts might have been facilitated by sea-level rises and improvements in conditions on the north coast of New Guinea.4 Early to mid-Holocene social networks between New Guinea and the Bismarck Archipelago are marked by the spread of stone mortars and pestles, obsidian, and stemmed obsidian tools from ∼8 ka57 until before or alongside the advent of Lapita pottery in the Bismarcks at ∼3.5 ka.6 The absence of early Lapita pottery on New Guinea suggests major disruptions to preexisting exchange networks within Near Oceania before or at ∼3.5 ka, with increasing social isolation of some areas and increasing interaction between others.
There is also emerging evidence from both archaeology and archaeobotany for the spread of domesticates during the mid-Holocene, before the presumed advent of Austronesian dominance from ∼4 ka. Molecular analyses suggest that bananas,58 sago,59 greater yam,60 and sugarcane61 all underwent early domestication in the New Guinea region. These cultivars, and associated cultivation practices, diffused westward into ISEA, where the plants and linguistic terms for them were adopted by Proto-Malayo-Polynesian speakers upon their arrival ∼4 ka9,54,62. The vegetative cultivation of these plants evidently occurred within ISEA before any Taiwanese influences became significant.
This work suggests, therefore, a convergence of archaeological and genetic evidence, as well as concordance between different lines of genetic evidence. Our results imply an early to mid-Holocene Near Oceanic ancestry for the Polynesian peoples, likely fertilized by small numbers of socially dominant Austronesian-speaking voyagers from ISEA in the Lapita formative period, ∼3.5 ka. Our work can therefore also pave the way for new accounts of the spread of Austronesian languages.
Acknowledgments
We thank John Clegg and Salam Sofro for DNA samples, Matthew Spriggs for advice on settlement chronology, Jonathan and Francoise Friedlaender for providing HVS-I data, and Robert Simpson for laboratory assistance. P.S. was supported by a Marie Curie Early Stage Training Grant and by a Portuguese Foundation for Science and Technology (FCT) grant (SFRH/BPD/64233/2009), and we thank the European Union, the British Academy, the Bradshaw Foundation, the de Laszlo Foundation, the National Science Council of Taiwan (grant NSC96-2627-H-195-001), and the National Health Research Institute of Taiwan (grant NHRI-EX94-9218BI) for financial support. IPATIMUP is an Associate Laboratory of the Portuguese Ministry of Science, Technology and Higher Education and is partially supported by FCT.
Supplemental Data
Web Resources
The URLs for data presented herein are as follows:
Calculator for converting ρ values and ML estimates to age estimates, http://www.fbs.leeds.ac.uk/staff/Richards/Soares_mtDNA_rate_calculator.xls
Accession Numbers
The GenBank accession numbers for the sequences reported in this paper are HQ873489–HQ873569.
References
- 1.Bellwood P. Blackwell Publishing; Oxford: 2005. First Farmers: The Origins of Agricultural Societies. [Google Scholar]
- 2.Spriggs M. The Neolithic and Austronesian expansion within Island Southeast Asia and into the Pacific. In: Chiu S., Sand C., editors. From Southeast Asia to the Pacific: Archaeological Perspectives on the Austronesian Expansion and the Lapita Cultural Complex. Academia Sinica; Taipei, Taiwan: 2007. pp. 104–140. [Google Scholar]
- 3.Solheim W.G. University of Philippines Press; Quezon City, The Philippines: 2006. Archaeology and Culture in Southeast Asia: Unraveling the Nusantao. [Google Scholar]
- 4.Terrell J.E. The ‘sleeping giant’ hypothesis and New Guinea's place in the prehistory of Greater Near Oceania. World Archaeol. 2004;36:601–609. [Google Scholar]
- 5.Terrell J.E., Welsch R.L. Lapita and the temporal geography of prehistory. Antiquity. 1997;71:548–572. [Google Scholar]
- 6.Torrence R., Swadling P. Social networks and the spread of Lapita. Antiquity. 2008;82:600–616. [Google Scholar]
- 7.Irwin G. Cambridge University Press; Cambridge: 1992. The Prehistoric Exploration and Colonisation of the Pacific. [Google Scholar]
- 8.Green R.C. The Lapita horizon and traditions: Signature for one set of oceanic migrations. In: Sand C., editor. Pacific Archaeology: Assessments and Prospects. Service des Musées et du Patrimoine; Nouméa, New Caledonia: 2003. [Google Scholar]
- 9.Donohue M., Denham T. Island Southeast Asia during the mid-Holocene: Reframing Austronesian history. Curr. Anthropol. 2010;51:223–256. [Google Scholar]
- 10.Kayser M., Brauer S., Cordaux R., Casto A., Lao O., Zhivotovsky L.A., Moyse-Faurie C., Rutledge R.B., Schiefenhoevel W., Gil D. Melanesian and Asian origins of Polynesians: mtDNA and Y chromosome gradients across the Pacific. Mol. Biol. Evol. 2006;23:2234–2244. doi: 10.1093/molbev/msl093. [DOI] [PubMed] [Google Scholar]
- 11.Redd A.J., Takezaki N., Sherry S.T., McGarvey S.T., Sofro A.S.M., Stoneking M. Evolutionary history of the COII/tRNALys intergenic 9 base pair deletion in human mitochondrial DNAs from the Pacific. Mol. Biol. Evol. 1995;12:604–615. doi: 10.1093/oxfordjournals.molbev.a040240. [DOI] [PubMed] [Google Scholar]
- 12.Sykes B., Leiboff A., Low-Beer J., Tetzner S., Richards M. The origins of the Polynesians: An interpretation from mitochondrial lineage analysis. Am. J. Hum. Genet. 1995;57:1463–1475. [PMC free article] [PubMed] [Google Scholar]
- 13.Richards M., Oppenheimer S., Sykes B. mtDNA suggests Polynesian origins in Eastern Indonesia. Am. J. Hum. Genet. 1998;63:1234–1236. doi: 10.1086/302043. [DOI] [PMC free article] [PubMed] [Google Scholar]
- 14.Oppenheimer S.J., Richards M. Polynesian origins. Slow boat to Melanesia? Nature. 2001;410:166–167. doi: 10.1038/35065520. [DOI] [PubMed] [Google Scholar]
- 15.Pierson M.J., Martinez-Arias R., Holland B.R., Gemmell N.J., Hurles M.E., Penny D. Deciphering past human population movements in Oceania: Provably optimal trees of 127 mtDNA genomes. Mol. Biol. Evol. 2006;23:1966–1975. doi: 10.1093/molbev/msl063. [DOI] [PMC free article] [PubMed] [Google Scholar]
- 16.Melton T., Clifford S., Martinson J., Batzer M., Stoneking M. Genetic evidence for the proto-Austronesian homeland in Asia: mtDNA and nuclear DNA variation in Taiwanese aboriginal tribes. Am. J. Hum. Genet. 1998;63:1807–1823. doi: 10.1086/302131. [DOI] [PMC free article] [PubMed] [Google Scholar]
- 17.Hill C., Soares P., Mormina M., Macaulay V., Clarke D., Blumbach P.B., Vizuete-Forster M., Forster P., Bulbeck D., Oppenheimer S., Richards M. A mitochondrial stratigraphy for Island Southeast Asia. Am. J. Hum. Genet. 2007;80:29–43. doi: 10.1086/510412. [DOI] [PMC free article] [PubMed] [Google Scholar]
- 18.Richards M., Macaulay V., Hickey E., Vega E., Sykes B., Guida V., Rengo C., Sellitto D., Cruciani F., Kivisild T. Tracing European founder lineages in the Near Eastern mtDNA pool. Am. J. Hum. Genet. 2000;67:1251–1276. [PMC free article] [PubMed] [Google Scholar]
- 19.Soares P., Ermini L., Thomson N., Mormina M., Rito T., Röhl A., Salas A., Oppenheimer S., Macaulay V., Richards M.B. Correcting for purifying selection: An improved human mitochondrial molecular clock. Am. J. Hum. Genet. 2009;84:740–759. doi: 10.1016/j.ajhg.2009.05.001. [DOI] [PMC free article] [PubMed] [Google Scholar]
- 20.Torroni A., Rengo C., Guida V., Cruciani F., Sellitto D., Coppa A., Calderon F.L., Simionati B., Valle G., Richards M. Do the four clades of the mtDNA haplogroup L2 evolve at different rates? Am. J. Hum. Genet. 2001;69:1348–1356. doi: 10.1086/324511. [DOI] [PMC free article] [PubMed] [Google Scholar]
- 21.Meierhofer D., Mayr J.A., Ebner S., Sperl W., Kofler B. Rapid screening of the entire mitochondrial DNA for low-level heteroplasmic mutations. Mitochondrion. 2005;5:282–296. doi: 10.1016/j.mito.2005.06.001. [DOI] [PubMed] [Google Scholar]
- 22.Bandelt H.-J., Forster P., Sykes B.C., Richards M.B. Mitochondrial portraits of human populations using median networks. Genetics. 1995;141:743–753. doi: 10.1093/genetics/141.2.743. [DOI] [PMC free article] [PubMed] [Google Scholar]
- 23.Trejaut J.A., Kivisild T., Loo J.H., Lee C.L., He C.L., Hsu C.J., Lee Z.Y., Lin M. Traces of archaic mitochondrial lineages persist in Austronesian-speaking Formosan populations. PLoS Biol. 2005;3:e247. doi: 10.1371/journal.pbio.0030247. [DOI] [PMC free article] [PubMed] [Google Scholar]
- 24.Tajima A., Sun C.S., Pan I.-H., Ishida T., Saitou N., Horai S. Mitochondrial DNA polymorphisms in nine aboriginal groups of Taiwan: Implications for the population history of aboriginal Taiwanese. Hum. Genet. 2003;113:24–33. doi: 10.1007/s00439-003-0945-1. [DOI] [PubMed] [Google Scholar]
- 25.Tabbada K.A., Trejaut J., Loo J.H., Chen Y.M., Lin M., Mirazón-Lahr M., Kivisild T., De Ungria M.C. Philippine mitochondrial DNA diversity: A populated viaduct between Taiwan and Indonesia? Mol. Biol. Evol. 2010;27:21–31. doi: 10.1093/molbev/msp215. [DOI] [PubMed] [Google Scholar]
- 26.Tajima A., Hayami M., Tokunaga K., Juji T., Matsuo M., Marzuki S., Omoto K., Horai S. Genetic origins of the Ainu inferred from combined DNA analyses of maternal and paternal lineages. J. Hum. Genet. 2004;49:187–193. doi: 10.1007/s10038-004-0131-x. [DOI] [PubMed] [Google Scholar]
- 27.Macaulay V., Hill C., Achilli A., Rengo C., Clarke D., Meehan W., Blackburn J., Semino O., Scozzari R., Cruciani F. Single, rapid coastal settlement of Asia revealed by analysis of complete mitochondrial genomes. Science. 2005;308:1034–1036. doi: 10.1126/science.1109792. [DOI] [PubMed] [Google Scholar]
- 28.Hill C., Soares P., Mormina M., Macaulay V., Meehan W., Blackburn J., Clarke D., Raja J.M., Ismail P., Bulbeck D. Phylogeography and ethnogenesis of aboriginal Southeast Asians. Mol. Biol. Evol. 2006;23:2480–2491. doi: 10.1093/molbev/msl124. [DOI] [PubMed] [Google Scholar]
- 29.Vilar M.G., Kaneko A., Hombhanje F.W., Tsukahara T., Hwaihwanje I., Lum J.K. Reconstructing the origin of the Lapita cultural complex: mtDNA analyses of East Sepik Province, PNG. J. Hum. Genet. 2008;53:698–708. doi: 10.1007/s10038-008-0301-3. [DOI] [PubMed] [Google Scholar]
- 30.Ricaut F.X., Thomas T., Arganini C., Staughton J., Leavesley M., Bellatti M., Foley R., Mirazon Lahr M. Mitochondrial DNA variation in Karkar islanders. Ann. Hum. Genet. 2008;72:349–367. doi: 10.1111/j.1469-1809.2008.00430.x. [DOI] [PubMed] [Google Scholar]
- 31.Hudjashov G., Kivisild T., Underhill P.A., Endicott P., Sanchez J.J., Lin A.A., Shen P., Oefner P., Renfrew C., Villems R., Forster P. Revealing the prehistoric settlement of Australia by Y chromosome and mtDNA analysis. Proc. Natl. Acad. Sci. USA. 2007;104:8726–8730. doi: 10.1073/pnas.0702928104. [DOI] [PMC free article] [PubMed] [Google Scholar]
- 32.Ohashi J., Naka I., Tokunaga K., Inaoka T., Ataka Y., Nakazawa M., Matsumura Y., Ohtsuka R. Brief communication: Mitochondrial DNA variation suggests extensive gene flow from Polynesian ancestors to indigenous Melanesians in the northwestern Bismarck Archipelago. Am. J. Phys. Anthropol. 2006;130:551–556. doi: 10.1002/ajpa.20383. [DOI] [PubMed] [Google Scholar]
- 33.Friedlaender J.S., Friedlaender F.R., Hodgson J.A., Stoltz M., Koki G., Horvat G., Zhadanov S., Schurr T.G., Merriwether D.A. Melanesian mtDNA complexity. PLoS ONE. 2007;2:e248. doi: 10.1371/journal.pone.0000248. [DOI] [PMC free article] [PubMed] [Google Scholar]
- 34.Hagelberg E., Goldman N., Lió P., Whelan S., Schiefenhövel W., Clegg J.B., Bowden D.K. Evidence for mitochondrial DNA recombination in a human population of island Melanesia. Proc. Biol. Sci. 2000;267:1595–1596. doi: 10.1098/rspb.1999.0663. [DOI] [PMC free article] [PubMed] [Google Scholar]
- 35.Redd A.J., Stoneking M. Peopling of Sahul: mtDNA variation in aboriginal Australian and Papua New Guinean populations. Am. J. Hum. Genet. 1999;65:808–828. doi: 10.1086/302533. [DOI] [PMC free article] [PubMed] [Google Scholar]
- 36.Tofanelli S., Bertoncini S., Castrì L., Luiselli D., Calafell F., Donati G., Paoli G. On the origins and admixture of Malagasy: New evidence from high-resolution analyses of paternal and maternal lineages. Mol. Biol. Evol. 2009;26:2109–2124. doi: 10.1093/molbev/msp120. [DOI] [PubMed] [Google Scholar]
- 37.Forster P., Harding R., Torroni A., Bandelt H.-J. Origin and evolution of Native American mtDNA variation: A reappraisal. Am. J. Hum. Genet. 1996;59:935–945. [PMC free article] [PubMed] [Google Scholar]
- 38.Soares P., Trejaut J.A., Loo J.-H., Hill C., Mormina M., Lee C.-L., Chen Y.-M., Hudjashov G., Forster P., Macaulay V. Climate change and postglacial human dispersals in southeast Asia. Mol. Biol. Evol. 2008;25:1209–1218. doi: 10.1093/molbev/msn068. [DOI] [PubMed] [Google Scholar]
- 39.Blanchon P., Shaw J. Reef drowning during the last glaciation: Evidence for catastrophic sea-level rise and ice-sheet collapse. Geology. 1995;23:4–8. [Google Scholar]
- 40.Abdulla M.A., Ahmed I., Assawamakin A., Bhak J., Brahmachari S.K., Calacal G.C., Chaurasia A., Chen C.H., Chen J., Chen Y.T., HUGO Pan-Asian SNP Consortium. Indian Genome Variation Consortium Mapping human genetic diversity in Asia. Science. 2009;326:1541–1545. doi: 10.1126/science.1177074. [DOI] [PubMed] [Google Scholar]
- 41.Bedford S., Spriggs M., Regenvanu R. The Teouma Lapita site and the early human settlement of the Pacific Islands. Antiquity. 2006;80:812–828. [Google Scholar]
- 42.Rieth T.M., Hunt T.L. A radiocarbon chronology for Samoan prehistory. J. Archaeol. Sci. 2008;35:1901–1927. [Google Scholar]
- 43.Adelaar K.A. The Indonesian migrations to Madagascar: Making sense of the multindisciplinary evidence. In: Simanjuntak T., Pojoh I.H.E., Hisyam M., editors. Austronesian Diaspora and the Ethnogenesis of People in Indonesian Archipelago. LIPI Press; Jakarta, Indonesia: 2006. pp. 205–232. [Google Scholar]
- 44.Friedlaender J., Gentz F., Friedlaender F., Kaestle F., Schurr T., Koki G., Schanfield M., McDonough J., Smith L., Cerchio S. Mitochondrial genetic diversity and its determinants in Island Melanesia. In: Pawley A., Attenborough R., Golson J., Hide R., editors. Papuan Pasts: Cultural, Linguistic and Biological Histories of Papuan-Speaking Peoples. Pacific Linguistics; Canberra, Australia: 2006. pp. 693–716. [Google Scholar]
- 45.Friedlaender J.S. Conclusion. In: Friedlaender J.S., editor. Genes, Language and Culture in the Southwest Pacific. Oxford University Press; Oxford: 2007. pp. 231–237. [Google Scholar]
- 46.Specht J. Small islands in the big picture: The formative period of Lapita in the Bismarck Archipelago. In: Bedford S., Sand C., Connaughton S.P., editors. Oceanic Explorations: Lapita and Western Pacific Settlement. ANU E Press; Canberra, Australia: 2007. pp. 51–70. [Google Scholar]
- 47.Kayser M., Brauer S., Weiss G., Underhill P.A., Roewer L., Schiefenhövel W., Stoneking M. Melanesian origin of Polynesian Y chromosomes. Curr. Biol. 2000;10:1237–1246. doi: 10.1016/s0960-9822(00)00734-x. [DOI] [PubMed] [Google Scholar]
- 48.Capelli C., Wilson J.F., Richards M., Stumpf M.P.H., Gratrix F., Oppenheimer S., Underhill P., Pascali V.L., Ko T.-M., Goldstein D.B. A predominantly indigenous paternal heritage for the Austronesian-speaking peoples of insular Southeast Asia and Oceania. Am. J. Hum. Genet. 2001;68:432–443. doi: 10.1086/318205. [DOI] [PMC free article] [PubMed] [Google Scholar]
- 49.Kayser M., Choi Y., van Oven M., Mona S., Brauer S., Trent R.J., Suarkia D., Schiefenhövel W., Stoneking M. The impact of the Austronesian expansion: Evidence from mtDNA and Y chromosome diversity in the Admiralty Islands of Melanesia. Mol. Biol. Evol. 2008;25:1362–1374. doi: 10.1093/molbev/msn078. [DOI] [PubMed] [Google Scholar]
- 50.Karafet T.M., Hallmark B., Cox M.P., Sudoyo H., Downey S., Lansing J.S., Hammer M.F. Major east-west division underlies Y chromosome stratification across Indonesia. Mol. Biol. Evol. 2010;27:1833–1844. doi: 10.1093/molbev/msq063. [DOI] [PubMed] [Google Scholar]
- 51.Friedlaender J.S., Friedlaender F.R., Reed F.A., Kidd K.K., Kidd J.R., Chambers G.K., Lea R.A., Loo J.-H., Koki G., Hodgson J.A. The genetic structure of Pacific Islanders. PLoS Genet. 2008;4:e19. doi: 10.1371/journal.pgen.0040019. [DOI] [PMC free article] [PubMed] [Google Scholar]
- 52.Wollstein A., Lao O., Becker C., Brauer S., Trent R.J., Nürnberg P., Stoneking M., Kayser M. Demographic history of Oceania inferred from genome-wide data. Curr. Biol. 2010;20:1983–1992. doi: 10.1016/j.cub.2010.10.040. [DOI] [PubMed] [Google Scholar]
- 53.Hage P., Marck J. Matrilineality and the Melanesian origin of Polynesian Y chromosomes. Curr. Anthropol. 2003;44:121–127. [Google Scholar]
- 54.Blust R. Pacific Linguistics; Canberra, Australia: 2009. The Austronesian Languages. [Google Scholar]
- 55.Thomason S., Kaufman T. University of California Press; Los Angeles, CA: 1988. Language Contact, Creolization, and Genetic Linguistics. [Google Scholar]
- 56.Bulbeck D. An integrated perspective on the Austronesian diaspora: The switch from cereal agriculture to maritime foraging in the colonisation of Island Southeast Asia. Australian Archaeology. 2008;67:31–51. [Google Scholar]
- 57.Swadling P., Hide R. Changing landscape and social interaction: Looking at agricultural history from a Sepik-Ramu perspective. In: Pawley A., Attenborough R., Golson J., Hide R., editors. Papuan Pasts: Cultural, Linguistic and Biological Histories of Papuan-Speaking Peoples. Research School of Pacific and Asian Studies, Australian National University; Canberra, Australia: 2005. pp. 289–328. [Google Scholar]
- 58.Perrier X., Bakry F., Carreel F., Jenny C., Horry J.-P., Lebot V., Hippolyte I. Combining biological approaches to shed light on the evolution of edible bananas. Ethnobotany Research and Applications. 2009;7:199–216. [Google Scholar]
- 59.Kjaer A., Barfod A.S., Asmussen C.B., Seberg O. Investigation of genetic and morphological variation in the sago palm (Metroxylon sagu; Arecaceae) in Papua New Guinea. Ann. Bot. (Lond.) 2004;94:109–117. doi: 10.1093/aob/mch112. [DOI] [PMC free article] [PubMed] [Google Scholar]
- 60.Malapa R., Arnau G., Noyer J.L., Lebot V. Genetic diversity of the greater yam (Dioscorea alata L.) and relatedness to D. nummularia Lam. and D. transversa Br. as revealed with AFLP markers. Genet. Resour. Crop Evol. 2005;52:919–929. [Google Scholar]
- 61.Grivet L., Daniels C., Glaszman J.C., D'Hont A. A review of recent molecular genetics evidence for sugarcane evolution and domestication. Ethnobot. Res. Applic. 2004;2:9–17. [Google Scholar]
- 62.Pawley A. The origins of early Lapita culture: The testimony of historical linguistics. In: Bedford S., Sand C., Connaughton S.P., editors. Oceanic Explorations: Lapita and Western Pacific Settlement. ANU E Press; Canberra, Australia: 2007. pp. 17–49. [Google Scholar]
Associated Data
This section collects any data citations, data availability statements, or supplementary materials included in this article.