

Abstract
The corpus callosum is the largest white matter tract, important for interhemispheric communication. The aim of this study was to investigate and compare corpus callosum size, shape and diffusion characteristics in 106 very preterm infants and 22 full-term infants. Structural and diffusion magnetic resonance images were obtained at term equivalent. The corpus callosum was segmented, cross-sectional areas were calculated, and shape was analyzed. Fractional anisotropy, mean, axial and radial diffusivity measures were obtained from within the corpus callosum, with additional probabilistic tractography analysis. Very preterm infants had significantly reduced callosal cross sectional area compared with term infants (p=0.004), particularly for the mid-body and posterior sub-regions. Very preterm callosi were more circular (p=0.01). Fractional anisotropy was lower (p=0.007) and mean (p=0.006) and radial (p=0.001) diffusivity values were higher in very preterm infants’ callosi, particularly at the anterior and posterior ends. The volume of tracts originating from the corpus callosum was reduced in very preterm infants (p=0.001), particularly for anterior mid-body (p=0.01) and isthmus tracts (p=0.04). This study characterizes callosal size, shape and diffusion in typically developing infants at term equivalent age, and reports macro- and micro-structural abnormalities as a result of prematurity.
Keywords: Brain, Corpus callosum, Prematurity, Neonate, Infant, Magnetic resonance imaging, Diffusion tensor imaging
1. Introduction
The corpus callosum (CC) is the largest white matter (WM) fibre bundle in the human brain. It is the major interhemispheric commissure that connects the majority of the neocortical areas (Schmahmann and Pandya, 2006), important for interhemispheric communication of sensory, motor and higher-order information. The basic structure of the CC is completed by 18–20 weeks’ gestation, but continues to increase in size over the third trimester (Malinger and Zakut, 1993), and grows dramatically over the first two postnatal years (Keshavan et al., 2002). The CC grows from anterior to posterior (Richards et al., 2004). However, myelination of the CC progresses from posterior to anterior (van der Knaap and Valk, 1995), while pre-oligodendrocytes are thought to appear first in the ‘ends’ of the CC: the genu and splenium (Huppi et al., 1998). Thus, very preterm (VPT) birth at <30 weeks’ gestational age (GA) occurs during a sensitive period of CC development.
Structural MRI can be used to determine size and shape of the CC, while diffusion tensor imaging (DTI) provides insight into the micro-structure and connectivity of the CC. The mean diffusivity (MD) is a measure of overall diffusion; a larger MD is associated with reduced integrity of the WM. The movement of water in a preferred direction can be measured by fractional anisotropy (FA). Lower FA is associated with loss or disorganization of axons or myelin. The principal direction of diffusion, assumed to be oriented parallel to the fibre direction, is known as axial diffusivity (λ||), and can be used to estimate WM tracts by tractography (Melhem et al., 2002). Larger λ|| in the context of infants corresponds to immaturity (Partridge et al., 2004). The average of the medium and minor diffusion directions, known as radial diffusivity (λ⊥), is assumed to be oriented perpendicular to the fibre direction. Larger λ⊥ values are thought to correspond to reduced myelin integrity (Beaulieu, 2002). Higher WM anisotropy, and lower overall diffusion is associated with increasing age and maturation (Huppi et al., 1998; Schneider et al., 2004) as water content decreases and myelination increases (Partridge et al., 2004).
There is little published on the characterization of the CC around the time of birth, either for healthy full-term (FT), or VPT infants using MRI. MRI at term equivalent age has been previously used to show that premature birth disrupts brain structure (Inder et al., 2005; Peterson et al., 2000) and microstructural characteristics (Counsell et al., 2006; Huppi et al., 1998). However the effect of prematurity on the infant corpus callosum has not been extensively described. In contrast, the effects of prematurity on CC size (Caldu et al., 2006; Lawrence et al., 2010; Narberhaus et al., 2007; Nosarti et al., 2004; Peterson et al., 2000), and diffusion (Andrews et al., 2009; Constable et al., 2008; Kontis et al., 2009; Nagy et al., 2009; Nagy et al., 2003) have been previously examined in children, adolescents and adults. While a few studies have reported altered CC diffusion in VPT infants (Anjari et al., 2007; Rose et al., 2008; Skiold et al., 2010), no studies have examined the size and shape of the CC in VPT infants using MRI, or characterized the microstructural integrity and connectivity of the neonatal VPT CC using tractography. Thus, the overall aims of this study were to investigate and compare CC development in FT and VPT infants at term with cross-sectional area, global and local shape analyses on MRI, as well as diffusivity measures and tractography within the CC and its sub-regions using DTI.
2. Methods
2.1. Subjects and scanning
Between the period of July 2001 and December 2003, a prospective observational cohort study was conducted at the Royal Women’s Hospital in Melbourne, Australia. Three-hundred and forty-eight eligible VPT infants (<30 weeks’ GA and/or <1250 g at birth) were admitted into the neonatal nursery over the study period. Two hundred and twenty-seven VPT infants (65% of those eligible) were recruited as described previously (Thompson et al., 2007). Infants with congenital anomalies were excluded (3%). Inability to obtain parental consent was the most common reason for failure to recruit (22%). There were no significant differences between participating and non-participating infants for gender, GA at birth, bronchopulmonary dysplasia (BPD: oxygen requirement at 36 weeks’ corrected GA), grade 3 or 4 intraventricular hemorrhage (IVH), or cystic periventricular leukomalacia (PVL). Forty seven clinically healthy FT infants (≥37 weeks’ GA) whose parents agreed to participate in the study were also recruited from the Royal Women’s Hospital postnatal wards or via response to advertising in recruiting hospitals. All FT infants had an unremarkable antenatal course and labor, and were free of neonatal complications, and congenital or chromosomal abnormalities. Informed parental consent was obtained for all subjects and the study was approved by the Research and Ethics Committees at the Royal Women’s Hospital. A total of 106 stable VPT infants and 22 healthy FT infants were able to be analyzed for the current study (47% of those recruited). The major reasons that infants recruited were not included in this study were that DTI was not attempted (34%), or DTI was unsuccessful or of insufficient quality for further analysis (17%), largely due to movement or imaging artifact. The reason for excluding the remaining infants recruited who were recruited was that structural MRI was unsuccessful or of insufficient quality to analyze (2%).
2.2. MRI acquisition
All infants were scanned at term equivalent (median 40, range 38–42 weeks’ GA) in a 1.5 T General Electric MRI scanner. Infants were fed and tightly swaddled, immobilized in a vacuum fixation bean-bag and scanned while sleeping, without sedation. Each infant underwent whole brain structural 3D T1 spoiled gradient recalled imaging with 0.8–1.6 mm coronal slices; flip angle 45°; repetition time (TR) 35ms; echo time (TE) 9ms; field of view (FOV) 21 × 15cm2; matrix 256 × 192, as well as T2 dual echo fast spin echo sequences with interleaved acquisition (1.7 – 3mm coronal slices; TR 4000msec; TE 60 / 160 msec; FOV 22 × 16cm2; matrix 256 × 192, interpolated 512 × 512). Linescan diffusion imaging sequences (4 – 6 mm axial slices; 2 baselines, b = 5; six non-collinear gradient directions, b = 700 s/mm2,) were acquired within the same session. Post-acquisition MRI analyses were undertaken on sun Microsystems workstations (Palo Alto, CA).
2.3. MR image preprocessing
T1-weighted images were individually aligned along the anterior commissure to posterior commissure line (AC-PC) by manual rotation and translation (Talairach and Tournoux, 1988) and were brain extracted by applying an intracranial cavity map file. The intracranial cavity (brain versus non-brain) mask was semi-automatically created based on the T1-weighted image, and then manually corrected (Kikinis et al., 1992).
Diffusion weighted images (DWI) were preprocessed using the Oxford centre for functional magnetic resonance imaging of the brain software library (FSL). Eddy current distortions and simple head motion were corrected (Jenkinson and Smith, 2001). A binary brain mask was created on the baseline image (Smith, 2002). Local fitting of the diffusion tensor model at each voxel of the diffusion image was achieved (Behrens et al., 2003), and probabilistic diffusion orientation and local diffusion parameters were characterized and estimated at each voxel with Markov Chain Monte Carlo sampling (Behrens et al., 2003). The averaged diffusion maps, obtained by averaging together the six diffusion gradient direction images, were co-registered with the AC-PC aligned T1 structural images. All registrations were performed using FSL’s linear registration tool (Jenkinson and Smith, 2001) using optimized parameters including mutual information, 12 degrees of freedom, and sinc interpolation.
2.4. Corpus callosum segmentation
Corpus callosi were manually delineated on the mid-sagittal slice of the AC-PC aligned T1-weighted image using 3D slicer software (www.slicer.org). The operator (D.K.T) was blind to all perinatal data. Reference was made to anatomical atlases (Bayer and Altman, 2004; Mai et al., 1997). Tracing was performed conservatively, and to further avoid partial volume effects each CC was delineated twice, and the overlap of the two delineations was obtained and used as the final mask.
Reliability analyses were performed using twelve randomly chosen subjects, including 2 FT and 10 VPT infants. The CC was re-traced twice, at least 3 months after the initial CC mask was generated, and the overlap obtained. The Dice overlap score (Pfefferbaum et al., 2006) was 0.89 (range 0.82 to 0.96, SD 0.04). The intraclass correlation coefficient using a two-way mixed effects model with absolute agreement on average measures was 0.84 (95% CI 0.45, 0.95; p=0.003).
The CC mask was divided into six regions based on a hybrid scheme, which generally incorporated the divisions proposed by Witelson’s post-mortem morphological analysis of the CC (Witelson, 1989), with slight modifications based on Hofer and Hrahm’s tractography-based CC parcellation scheme (Hofer and Frahm, 2006), as described below. The modification from Witelson’s scheme was required since the rostrum was very small, highly variable, and unable to be consistently identified in the infants. The most anterior and most posterior points of the CC were determined, then cut-off points were made at intervals of one sixth, one third, one half, two thirds, and four fifths the distance from the most anterior to most posterior points. The sub-divisions from anterior to posterior were named: genu, rostral body (RB), anterior mid-body (AMB), posterior mid-body (PMB), isthmus and splenium (Fig. 1). The cross-sectional area of the whole CC and all sub-regions were calculated.
Fig. 1.

Sub-regions of the corpus callosum used in the current study, based on both Witelson’s and Hofer and Frahm’s divisions. RB: rostral body, AMB: anterior mid-body, PMB: posterior mid-body.
2.5. Corpus callosum shape analysis
For global shape analyses, measures of CC length, eccentricity, and skew were made. The length of the CC in the anterior to posterior direction was obtained by determining the distance between the most anterior and most posterior points of the CC mask (aligned to the AC-PC line). An ellipse was fitted to each CC mask using direct least squares (Fig. 2A,B,C) (Fitzgibbon et al., 1999). The eccentricity (ε) of the CC was calculated as the ratio between the semi (α) and major (β) axis of the estimated ellipse, according to equation 1:
| [1] |
Fig. 2.

(A) Robust ellipse fitted to the corpus callosum mask, showing semi (α) and major (β) ellipse axes and estimated end points. Pa: anterior endpoint, Pp: posterior endpoint. (B) When the major axis (β) is larger than the semi-major axis (α), eccentricity is high. (C) When the major axis (β) approximates the semi-major axis (α), the eccentricity is low. (D) The corpus callosum mask transformed to the x axis using the estimated anterior and posterior end points (Pa, Pp), showing the three area computations required for anterior and posterior skew. Increased area implies increased skew. Pm: mid-point between Pa and Pp.
The skew of the CC was calculated by determining the area under the curve of the anterior-most, and posterior-most sections of the CC, separated mid-way between two end points. End points were defined as the most anterior (Pa) and posterior (Pp) voxels of the CC mask with the minimum Euclidean distance from the estimated ellipse fit to the CC (Fig. 2D). The end points of the CC mask were rigidly aligned to the x-axis and a mid-point, Pm, was defined, according to equation 2 (Fig. 2D):
| [2] |
To compute area, a numerical integral was computed, as the sum of the transformed y coordinates. For all voxels in the transformed mask the anterior, aa, posterior, ap, and total area, at, are computed, where yi is the y-component of the ith transformed voxel in each CC mask, according to equation 3:
| [3] |
The anterior, sa, and posterior, sp, areas were normalized as the percentage of the total area, according to equation 4:
| [4] |
In order to observe local CC differences between FT and VPT groups, firstly corresponding points along each infant’s CC mask were calculated using Fourier descriptors (Berg et al., 2004). This involved sampling the first-order Fourier approximation of the CC mask of each subject with 100 evenly spaced points. The sample points were then computed to a higher-order, using all Fourier coefficients, to provide a sampling of the CC mask in its original space.
Secondly, the CC masks of the FT infants were registered together by Generalized Procrustes alignment, and all individual CC masks were aligned to this mean template (Bookstein, 1997; Dryden and Walker, 1999). Thirdly, the Euclidean distance of each sampled point from the corresponding point on the template was computed to form a distance matrix for the FT and VPT infants.
2.6. Corpus callosum line profile
To test if there were regional differences in diffusivity of the CC, diffusivity measures were obtained at regular points along the CC. In order to sample at equivalent points in all subjects, a skeleton was made by thinning the CC mask to one voxel thick using Matlab Release 2008b (http://www.mathworks.com) (Fig. 3A,B), and skeletons were interpolated to the same size. 60 points with a radius of 5 voxels (excluding those outside the CC) were sampled along the normalized CC skeleton (Fig. 3C). Diffusion characteristics (including FA, MD, λ||, and λ⊥) were measured within each sample point along the mask, from the anterior genu to the splenium of the CC.
Fig. 3.

(A) Corpus callosum mask, (B) skeletonized corpus callosum mask, (C) Example of method for sampling diffusivity measures within the corpus callosum along the skeleton.
2.7. Diffusion measures within the corpus callosum
The CC mask was overlaid onto the diffusivity map that had been registered to the AC-PC aligned T1 image (Fig. 4A,B). MD, FA, λ||, and λ⊥ [calculated as the average of λ2 and λ3 ((λ2+λ3)/2)] were quantified within the CC region of interest (ROI) (Fig. 4C), genu, RB, AMB, PMB, isthmus and splenium (Fig. 4D).
Fig. 4.
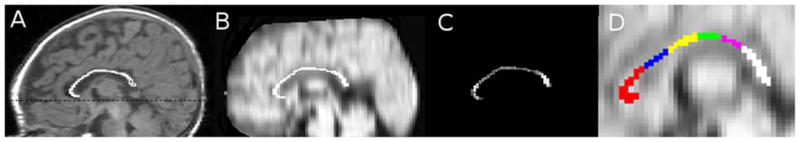
(A) The corpus callosum traced on mid-sagittal slice of the T1 structural image. The dotted line corresponds to the anterior-to-posterior commissure line. (B) The corpus callosum overlaid on mean diffusivity image registered to T1, (C) Fractional anisotropy within the corpus callosum region of interest, (D) The sub-regions of the corpus callosum overlaid on the average diffusion map. genu = red; rostral body = blue; anterior mid-body = yellow; posterior mid-body = green; isthmus = pink; splenium = white.
2.8. Corpus callosum tractography
Probabilistic tractography was carried out using FSL’s Diffusion Toolbox (Behrens et al., 2003), with a curvature threshold of 0.2 and 5000 samples. Considering the small size of infant brains 1800 was chosen as the number of steps with 0.4 mm step length. The CC masks were used as seed ROIs. Normalization was achieved by dividing the tract probability values within each voxel by the number of voxels in the ROI and multiplying by the number of samples (5000). The normalized tracts were thresholded at 0.001%. Measures of connectivity were made by inference, by taking the volume of normalized and thresholded tracts, i.e. a count of all normalized voxels with a probability greater than 0.001 in 100 of lying within the tract of interest, multiplied by the voxel size. Diffusivity measures (FA, MD, λ⊥, and λ||) within the tracts were obtained.
2.9. Statistical analyses
Data were analyzed using SPSS version 15.0 (SPSS, Chicago, IL), and Matlab. Exploratory analyses were performed on all data to assess normality, homogeneity of variance, linearity, and multicollinearity as appropriate. Parametric tests were employed where the relevant assumptions were met, otherwise non-parametric analyses were undertaken. Adjustment was made for multiple comparisons.
The cross-sectional area of the whole CC and all sub-regions were corrected for the cross-sectional area of the intracranial cavity measured on the mid-sagittal slice from which the CC was delineated according to equation 5, as previously described (Free et al., 1995; Thompson et al., 2008):
| [5] |
Where cCC = corrected corpus callosum cross-sectional area, mCC = measured corpus callosum cross-sectional area, g = gradient of regression line between FT CC area and FT mid-sagittal brain area, mMSA = measured mid-sagittal brain area, aveMSA = average mid-sagittal brain area of FT infants.
An independent samples t-test was used to determine the difference between FT and VPT infants for the mid-sagittal area of the whole CC, both corrected and un-corrected for mid-sagittal brain area. Corrected whole and sub-regional CC areas were used for all subsequent analyses. A further test was carried out to determine whether the difference between VPT and FT infants’ CC areas remained significant after GA at MRI was included in the model. This was achieved using linear regression. To test which regions of the CC differed between FT and VPT infants, the corrected cross-sectional areas of each sub-region were tested using multivariate analysis of variance. The dependent variables were the 6 sub-region area measures, and group (FT or VPT) was the fixed factor. Post-hoc tests were performed using independent samples t-tests to ascertain which sub-regions were significantly different between groups. Linear regression was also carried out to ensure the difference between VPT and FT infants’ CC sub-regions remained significant after GA at MRI was adjusted for in the model.
The difference between FT and VPT callosal length was assessed with an independent samples t-test. The eccentricity measure violated the assumption of normality, with the distribution being skewed toward the higher range of values. Therefore, the non-parametric Mann-Whitney U test was employed to compare groups. Differences between anterior and posterior skew for both FT and VPT infants were tested with paired samples t-tests. The difference in skew between groups was analyzed by comparing FT and VPT infants’ posterior skew with an independent samples t-test. Significant variability in local shape measures between FT and VPT infants was explored using Matlab software’s statistics module. The multivariate T2-hotelling test was applied. P-values were corrected using false discovery rate correction to control for false positives from multiple comparisons.
Within the whole CC, independent samples t-tests were used to examine differences between FT and VPT infants’ diffusion values. Adjustment for GA at MRI was included as a covariate in the model using linear regression.
The diffusion measures along the skeleton points were not independent of one another. There was also skewing in the data and some evidence of inequality of variance. Analysis with and without natural log transforms were undertaken with similar results. A repeated measures analysis of variance was used to determine the difference in the distribution of diffusion values between FT and VPT infants. Repeated measures analysis of covariance was performed, adjusting for GA at MRI.
Diffusion values within the sub-regions of the CC were compared between FT and VPT groups using independent samples t-tests. In order to adjust for GA at MRI, linear regression was used.
Independent samples t-tests were carried out to compare FT and VPT infant tract volumes and diffusivity values for the whole CC and CC sub-regions. The analysis was repeated adjusting for GA at MRI or for intracranial cavity volume linear regression. CC tract volume was related to CC cross-sectional area by Pearson’s correlation analysis.
3. Results
3.1. Subjects (Table 1)
Table 1.
Perinatal and demographic characteristics for the corpus callosum cohorts of very preterm (VPT) and full-term (FT) infants.
| Characteristic | VPT | FT |
|---|---|---|
| n=106 | n=22 | |
| Antenatal corticosteroid administration, n (%) | 94 (89) | 0 (0) |
| Gestational age at birth (wk), mean (SD) | 27.6 (1.7) | 38.8 (1.1) |
| Male gender, n (%) | 55 (52) | 14 (64) |
| Multiple births, n (%) | 43 (41) | 0 (0) |
| Birth weight (g), mean (SD) | 996 (216) | 3318 (504) |
| Birth weight SD score, mean (SD) | −0.5 (0.9) | 0.1 (1.0) |
| Intrauterine growth restrictiona, n (%) | 8 (7) | 1 (5) |
| Positive pressure ventilation (hr), median (IQR) | 56 (2.3,255) | 0 (0) |
| Inotropic Support, n (%) | 46 (43) | 0 (0) |
| Patent ductus arteriosus (indomethacin therapy), n (%) | 53 (50) | 0 (0) |
| Parenteral nutrition (days), median (IQR) | 11 (6.8,17) | 0 (0) |
| Bronchopulmonary dysplasiab, n (%) | 35 (33) | 0 (0) |
| Postnatal corticosteroid therapyc, n (%) | 9 (9) | 0 (0) |
| Proven necrotizing enterocolitis, n (%) | 3 (3) | 0 (0) |
| Proven sepsis, n (%) | 41 (39) | 0 (0) |
| Intraventricular hemorrhage (any grade), n (%) | 14 (13) | 0 (0) |
| Intraventricular hemorrhage (grade III/IV), n (%) | 5 (5) | 0 (0) |
| WM injury (any grade), n (%) | 72 (68) | 4 (18) |
| WM injury (grade III/IV), n (%) | 16 (15) | 0 (0) |
| Gestational age at MRI (wk), mean (SD) | 40.1 (1.1) | 40.6 (0.6) |
Birth weight SD score >2 SD below mean weight for gestational age, MRI = magnetic resonance imaging, SD = standard deviation, IQR = inter-quartile range,
Required oxygen at 36 weeks gestational age,
Postnatal dexamethasone, usual dose 0.15 mg/kg per day for 3 days, reducing over 10 days: total dose 0.89 mg/kg.
Data from 106 VPT and 22 FT infants were analyzed. Characteristics of the cohorts studied are reported in Table 1. There was no difference in gender [mean difference: −0.12 (12%); 95% CI −0.35, 0.11; p=0.3] between FT and VPT infants. There were a substantial number of multiple births within the VPT group (41%), but none within the FT group. FT infants had a slightly higher GA than VPT infants at the time of MRI scan (mean difference: −0.58 weeks; 95% CI −1.06, −0.09; p=0.02), consequently GA at MRI was adjusted for in all comparative analyses. The postnatal age of the FT infants at the time of MRI was 1.8 weeks of age (median 1.9, range 0.8 – 3.9 weeks). WM injury was qualitatively scored based on WM signal abnormality, reduction in WM volume, presence of cystic abnormality, lateral ventricular size, and CC/myelin maturation, as previously described (Inder et al., 2003). Of note, four FT infants were graded with mild WM abnormalities. Considering the nature of the grading system, it is not surprising that a few slight deviations from normal anatomy were noticed, which would not necessarily be considered pathology.
3.2. Cross-sectional area of the corpus callosum (Table 2)
Table 2.
Mid-sagittal area of the whole corpus callosum (CC) and its sub-divisions, both uncorrected and corrected for mid-sagittal brain area, for very preterm (VPT) and full-term (FT) infants, before and after adjusting for gestational age at magnetic resonance imaging.
| Uncorrected area, mean (SD), mm2 | Corrected area, mean (SD), mm2 | Unadjusted | Adjusted* | |||||
|---|---|---|---|---|---|---|---|---|
| VPT | FT | VPT | FT | Mean diff (95% CI), mm2 | p | Mean diff (95% CI), mm2 | p | |
| Whole CC | 80.0 (15.8) | 87.4 (12.3) | 77.9 (14.2) | 87.4 (11.8) | −9.5 (−15.9, − 3.1) | 0.004 | −7.7 (−14.1, − 1.3) | 0.02 |
| Genu | 24.7 (6.3) | 24.4 (4.0) | 23.97 (5.87) | 24.41 (3.81) | −0.44 (−3.03, 2.15) | 0.7 | NA | NA |
| RB | 10.3 (2.0) | 11.2 (2.0) | 10.19 (1.95) | 11.17 (2.03) | −0.98 (−1.89, − 0.07) | 0.04 | −0.71 (−1.61, 0.20) | 0.1 |
| AMB | 8.8 (2.9) | 10.7 (2.5) | 8.72 (2.85) | 10.72 (2.50) | −2.01 (−3.30, − 0.71) | 0.003 | −1.54 (−2.81, − 0.26) | 0. 02 |
| PMB | 7.3 (2.4) | 8.3 (2.4) | 6.65 (2.26) | 8.26 (2.18) | −1.60 (−2.65, − 0.56) | 0.003 | −1.53 (−2.60, − 0.46) | 0.005 |
| Isthmus | 6.6 (1.9) | 7.5 (1.3) | 6.45 (1.82) | 7.50 (1.25) | −1.06 −1.86, − 0.25) | 0.01 | −0.99 (−1.82, − 0.16) | 0.02 |
| Splenium | 22.2 (5.7) | 25.4 (6.0) | 21.86 (5.42) | 25.36 (6.00) | −3.50 (−6.06, − 0.95) | 0.008 | −2.71 (−5.26, − 0.16) | 0.04 |
RB = rostral body, AMB = anterior mid-body, PMB = posterior mid-body, SD = standard deviation, diff = difference, CI = confidence interval, NA = not applicable, as unadjusted mean difference was not significant.
Adjusted for gestational age at magnetic resonance imaging
The mean uncorrected cross-sectional areas of the CC and its sub-regions for FT and VPT infants are reported in Table 2. The uncorrected CC cross sectional area was reduced in VPT infants [mean difference: −7.44 mm2 (95% CI: −14.5, −0.36), p=0.04]. This equates to an absolute difference in CC size of 8.5% between FT and VPT infants. The difference between FT and VPT corpus callosal area after correcting for the cross-sectional area of the mid-sagittal slice of the brain from which the CC was measured, was −10.9% (Table 2). The VPT vs. FT difference in CC area remained significant after adjusting for GA at MRI (Table 2). When all corrected CC sub-regional areas were analyzed, there were reductions in the cross sectional area of the VPT infant RB, AMB, PMB, isthmus and splenium compared with FT controls (Table 2). There was no longer a significant difference between the FT and VPT RB after adjusting for GA at MRI (Table 2).
3.3. Global shape analysis of the corpus callosum
Mean length of the anterior-posterior aspect of the CC was 42.10 mm (SD 3.88) for FT infants, and 41.63 mm (SD 3.64) for VPT infants. CC length was not different between FT and VPT infants [mean difference (95% CI) (mm): −0.47 (−2.18, 1.24), p= 0.6].
VPT infants trended toward lower eccentricity ratios compared with FT infants, [median (25th, 75th centile): VPT 0.62 (0.54, 0.72), FT 0.68 (0.58, 0.82), Z = −1.66, p=0.1]. There was greater skew in the posterior direction (i.e. greater area under the CC curve for the posterior half) for both FT infants [mean (SD): Posterior 0.57 (0.08); Anterior 0.43 (0.08), p<0.0005], and VPT infants [mean (SD): Posterior 0.52 (0.07); Anterior 0.48 (0.07), p<0.005]. VPT infants had less posterior skew compared with FT infants [mean difference (95% CI): −0.04 (−0.08, −0.01), p=0.01], indicating a more circular CC shape relative to FT controls. The difference between VPT and FT skew remained after adjusting for GA at MRI [adjusted mean difference (95% CI): −0.04 (−0.08, −0.008), p=0.02].
3.4. Local shape analysis of the corpus callosum (Fig. 5)
Fig. 5.

Local shape analysis of very preterm and full-term corpus callosi. (A) Ellipse fits of variability for full-term and very preterm point distributions. (B) Significant differences in shape indicated as arrows, demonstrating the direction of the change.
Fig. 5a demonstrates the variability of the corresponding points for each aligned CC (every second point is shown). The distribution was similar between groups. The shape of the genu, PMB and splenium of the CC were highly variable in both FT and VPT infants. Comparing the variability of corresponding point distributions between FT and VPT groups revealed two localized regions of significant difference (Fig. 5b). The genu of VPT infants was more posteriorly bent, and the AMB was more superiorly bent.
3.5. Diffusivity within the corpus callosum (Table 3)
Table 3.
Diffusivity values within the corpus callosum (CC), including sub-regions, for very preterm (VPT) and full-term (FT) infants.
| Unadjusted | Adjusted* | ||||||
|---|---|---|---|---|---|---|---|
| VPT, mean (SD) | FT, mean (SD) | Mean diff (95% CI) | p | Mean diff (95% CI) | p | ||
| Whole CC | FA | 0.29 (0.06) | 0.33 (0.05) | −0.04 (−0.06, −0.01) | 0.007 | −0.03 (−0.06, − 0.005) | 0.02 |
| MD (×10−3 mm2/s) | 1.61 (0.13) | 1.53 (0.08) | 0.08 (0.02, 0.14) | 0.006 | 0.07 (0.007, 0.12) | 0.03 | |
| λ|| (×10−3 mm2/s) | 2.13 (0.16) | 2.10 (0.14) | 0.03 (−0.05, 0.10) | 0.5 | 0.01 (−0.06, 0.09) | 0.8 | |
| λ⊥ (×10−3 mm2/s) | 1.35 (0.15) | 1.24 (0.09) | 0.11 (0.05, 0.18) | 0.001 | 0.09 (0.03, 0.16) | 0.005 | |
| Genu | FA | 0.32 (0.07) | 0.35 (0.08) | −0.04 (−0.07, −0.002) | 0.04 | −0.04 (−0.07, 0.0004) | 0.05 |
| MD (×10−3 mm2/s) | 1.63 (0.14) | 1.49 (0.12) | 0.14 (0.08, 0.21) | <0.0005 | 0.12 (0.06, 0.18) | <0.0005 | |
| λ|| (×10−3 mm2/s) | 2.20 (0.20) | 2.10 (0.20) | 0.10 (0.01, 0.20) | 0.03 | 0.08 (−0.01, 0.17) | 0.09 | |
| λ⊥ (×10−3 mm2/s) | 1.35 (0.17) | 1.19 (0.13) | 0.16 (0.09, 0.24) | <0.0005 | 0.14 (0.07, 0.22) | <0.0005 | |
| RB | FA | 0.20 (0.06) | 0.24 (0.08) | −0.04 (−0.07, −0.01) | 0.005 | −0.04 (−0.07, − 0.006) | 0.02 |
| MD (×10−3 mm2/s) | 1.72 (0.24) | 1.67 (0.18) | 0.05 (−0.06, 0.15) −0.03 (−0.16, 0.10) | 0.4 | 0.02 (−0.09, 0.12) | 0.8 | |
| λ|| (×10−3 mm2/s) | 2.06 (0.29) | 2.09 (0.24) | 0.7 | −0.05 (−0.19, 0.08) | 0.4 | ||
| λ⊥ (×10−3 mm2/s) | 1.55 (0.24) | 1.47 (0.19) | 0.08 (−0.02, 0.19) | 0.1 | 0.05 (−0.06, 0.15) | 0.4 | |
| AMB | FA | 0.23 (0.06) | 0.25 (0.05) | −0.02 (−0.04, 0.008) | 0.2 | −0.01 (−0.04, 0.01) | 0.4 |
| MD (×10−3 mm2/s) | 1.59 (0.18) | 1.56 (0.15) | 0.03 (−0.05, 0.11) | 0.4 | 0.02 (−0.06, 0.11) | 0.6 | |
| λ|| (×10−3 mm2/s) | 1.95 (0.24) | 1.95 (0.19) | 0.008 (−0.10, 0.12) | 0.9 | 0.002 (−0.11, 0.11) | 0.9 | |
| λ⊥ (×10−3 mm2/s) | 1.41 (0.17) | 1.36 (0.15) | 0.05 (−0.03, 0.12) | 0.3 | 0.03 (−0.05, 0.11) | 0.4 | |
| PMB | FA | 0.21 (0.06) | 0.23 (0.04) | −0.01 (−0.04, 0.01) | 0.3 | −0.01 (−0.04, 0.02) | 0.5 |
| MD (×10−3 mm2/s) | 1.61 (0.17) | 1.51 (0.09) | 0.10 (0.02, 0.17) | 0.009 | 0.08 (0.009, 0.16) | 0.03 | |
| λ|| (×10−3 mm2/s) | 1.96 (0.24) | 1.87 (0.14) | 0.09 (−0.02, 0.19) | 0.1 | 0.08 (−0.03, 0.19) | 0.1 | |
| λ⊥ (×10−3 mm2/s) | 1.44 (0.16) | 1.34 (0.08) | 0.10 (0.03, 0.17) | 0.003 | 0.09 (0.02, 0.15) | 0.01 | |
| Isthmus | FA | 0.20 (0.06) | 0.24 (0.06) | −0.05 (−0.08, −0.02) | 0.001 | −0.05 (−0.08, − 0.02) | 0.002 |
| MD (×10−3 mm2/s) | 1.74 (0.18) | 1.58 (0.18) | 0.16 (0.08, 0.25) | <0.0005 | 0.15 (0.07, 0.24) | 0.001 | |
| λ|| (×10−3 mm2/s) | 2.08 (0.22) | 1.99 (0.19) | 0.10 (−0.006, 0.20) | 0.06 | 0.09 (−0.02, 0.19) | 0.1 | |
| λ⊥ (×10−3 mm2/s) | 1.57 (0.18) | 1.37 (0.19) | 0.20 (0.11, 0.28) | <0.0005 | 0.18 (0.10, 0.27) | <0.0005 | |
| Splenium | FA | 0.40 (0.10) | 0.45 (0.08) | −0.05 (−0.09, −0.003) | 0.04 | −0.04 (−0.09, 0.006) | 0.08 |
| MD (×10−3 mm2/s) | 1.53 (0.23) | 1.49 (0.12) | 0.04 (−0.06, 0.14) | 0.4 | 0.02 (−0.08, 0.12) | 0.6 | |
| λ|| (×10−3 mm2/s) | 2.24 (0.22) | 2.30 (0.20) | −0.06 (−0.16, 0.04) | 0.2 | −0.07 (−0.17, 0.04) | 0.2 | |
| λ⊥ (×10−3 mm2/s) | 1.17 (0.27) | 1.08 (0.14) | 0.09 (−0.03, 0.17) | 0.1 | 0.07 (−0.05, 0.19) | 0.3 | |
Adjusted for gestational age at magnetic resonance imaging
RB = rostral body, AMB = anterior mid-body, PMB = posterior mid-body, SD = standard deviation, diff = difference, CI = confidence interval
Table 3 reports mean FA, MD, λ|| and λ⊥ within the CC. The mean FA within the CC was lower in VPT infants, while the mean MD and λ⊥ were higher in VPT corpus callosi compared with FT (Table 3). The principal diffusion direction (λ||) was not different between FT and VPT infants (Table 3).
3.6. Diffusivity along the corpus callosum skeleton (Fig. 6)
Fig. 6.
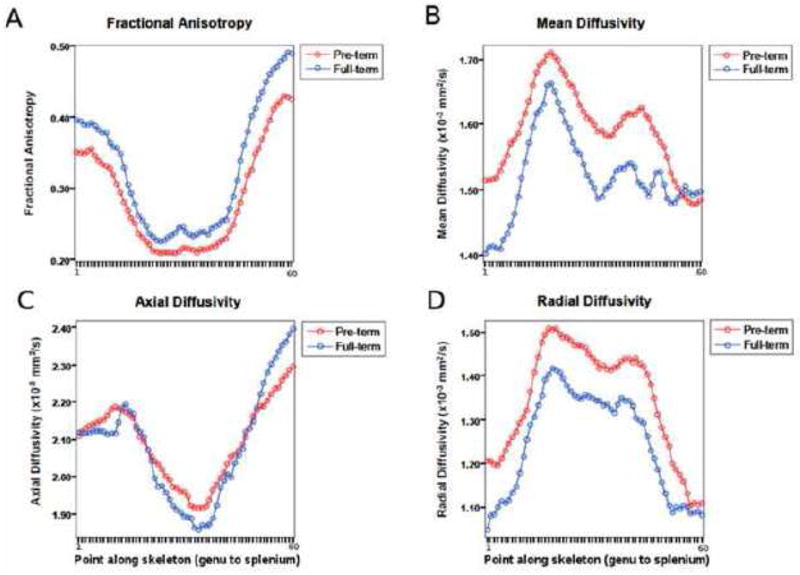
Median values for (A) fractional anisotropy, (B) mean diffusivity, (C) axial diffusivity, and (D) radial diffusivity obtained from 60 points along the corpus callosum skeleton for very preterm and full-term infants. * Significant at p<0.05 level
For both FT and VPT infants, the distribution of the diffusivity values differed significantly along the skeleton (FA: F59,7434 = 133.2, p<0.0005, MD: F59,7434 = 16.56, p<0.0005, λ||: F59,7434 = 28.91, p<0.0005, λ⊥: F59,7434= 53.03, p<0.0005). FA and λ|| were highest in the splenium, followed by the genu, and lowest in the mid-body, for both FT and VPT infants. Both MD and λ⊥ values were highest in the mid-body, and lowest in the genu and splenium of the CC (Fig. 6). The distribution of FA values along the skeleton was different between FT and VPT infants (F1,126 = 6.47, p=0.01), as was the distribution of MD values (F1,126 = 7.54, p=0.007) and λ⊥ values (F1,126 = 12.12, p=0.001). There was no difference between the distribution of the VPT vs. FT λ|| values along the skeleton (F1,126 = 0.32, p=0.6) (Fig. 6). Results were similar when covarying for GA at MRI in the VPT vs. FT comparison [FA: F1,124 = 4.74, p=0.03; MD: F1,124 = 5.53, p=0.02; λ⊥ : F1,124 = 9.07, p=0.003; λ||: F1,124 = 0.19, p=0.7].
3.7. Diffusivity within the corpus callosum sub-regions (Table 3)
Diffusivity values for the CC sub-regions of FT and VPT infants are reported in Table 3. FA was lower in VPT infants compared with FT infants within the genu, RB, isthmus and splenium of the CC. There was a significant increase in MD and λ⊥ values in the genu, PMB and isthmus of the VPT CC compared with FT infants, as well as significantly increased λ|| values in the genu (Table 3). After adjusting for GA at MRI, all significant differences for MD and λ⊥ remained, but there was no longer a significant difference in FA for the genu or splenium, nor λ|| for the genu of the CC (Table 3).
3.8. Inter-hemispheric connectivity (Table 4)
Table 4.
Tractography of the corpus callosum (CC), including sub-regions: Difference between very preterm (VPT) and full-term (FT) infant mean tract volume.
| Unadjusted | Adjusted* | |||||
|---|---|---|---|---|---|---|
| VPT, mean (SD), mm3 | FT, mean (SD), mm3 | Mean diff (95% CI), mm3 | p | Mean diff (95% CI), mm3 | p | |
| Whole CC | 19.16 (4.13) | 22.31 (4.08) | −3.15 (−5.07, − 1.24) | 0.001 | −2.79 (−4.74, − 0.85) | 0.005 |
| Genu | 10.08 (2.67) | 9.16 (2.83) | 0.92 (−0.3, 2.17) | 0.2 | 1.13 (−0.15, 2.41) | 0.8 |
| RB | 5.00 (1.96) | 5.46 (1.67) | −0.46 (−1.36, 0.44) | 0.3 | −0.36 (−1.28, 0.56) | 0.4 |
| AMB | 4.44 (1.60) | 5.47 (1.64) | −1.028 (−1.8, − 0.23) | 0.01 | −1.09 (−1.89, − 0.28) | 0.009 |
| PMB | 4.25 (1.73) | 4.58 (1.80) | −0.33 (−1.24, 0.59) | 0.5 | −0.28 (−1.09, 0.53) | 0.5 |
| Isthmus | 4.69 (2.11) | 5.80 (2.55) | −1.11 (−2.16, − 0.06) | 0.04 | −1.22 (−2.23, − 0.22) | 0.02 |
| Splenium | 12.55 (4.64) | 14.45 (4.78) | −1.90 (−4.07, 0.26) | 0.08 | −1.77 (−4.00, 0.45) | 0.1 |
Adjusted for gestational age at magnetic resonance imaging
RB = rostral body, AMB = anterior mid-body, PMB = posterior mid-body, SD = standard deviation, diff = difference, CI = confidence interval
The volumes of tracts originating from the CC are reported in Table 4. Compared with FT infants, reductions in VPT infant fibre volume were seen within the tracts passing through the whole CC (Fig. 7), AMB and isthmus of the CC even after correcting for GA at MRI (Table 4), and adjusting for the size of the brain (intracranial cavity volume) for the whole CC [β (95% CI): 2.69 (0.80, 4.6); p=0.006], AMB [β (95% CI): 1.10 (0.29, 1.9); p=0.009], and isthmus [β (95% CI): 1.20 (0.14, 2.3); p=0.03]. CC tract volume significantly correlated with CC cross-sectional area (r=0.39, p<0.0005).
Fig 7.
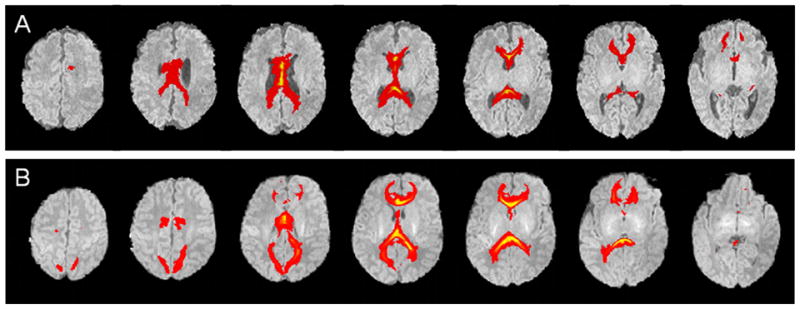
Probabilistic fibre tracts originating from the whole corpus callosum for (A) very preterm, and (B) full-term infants.
3.9. Diffusivity within the tracts (Table 5)
Table 5.
Tractography of the corpus callosum (CC), including sub-regions: Difference between very preterm (VPT) and full-term (FT) infant mean fractional anisotropy (FA), mean diffusivity (MD), axial diffusivity (λ||) and radial diffusivity (λ⊥) within the tracts.
| Unadjusted | Adjusted* | ||||||
|---|---|---|---|---|---|---|---|
| VPT, mean (SD) | FT, mean (SD) | Mean diff (95% CI) | p | Mean diff (95% CI) | p | ||
| Whole CC | FA | 0.20 (0.03) | 0.21 (0.02) | −0.01 (−0.02, 0.001) | 0.08 | −0.006 (− 0.12,0.005) | 0.3 |
| MD (×10−3 mm2/s) | 1.66 (0.10) | 1.53 (0.07) | 0.13 (0.09, 0.17) | <0.0001 | 0.12 (0.08, 0.17) | <0.0005 | |
| λ|| (×10−3 mm2/s) | 2.01 (0.11) | 1.87 (0.08) | 0.13 (0.09, 0.19) | <0.0001 | 0.14 (0.08, 0.19) | <0.0005 | |
| λ⊥ (×10−3 mm2/s) | 1.48 (0.09) | 1.36 (0.07) | 0.12 (0.082, 0.17) | <0.0001 | 0.12 (0.07, 0.16) | <0.0005 | |
| Genu | FA | 0.18 (0.03) | 0.18 (0.03) | −0.004 (− 0.02, 0.01) | 0.6 | −0.002 (−0.02, 0.01) | 0.8 |
| MD (×10−3 mm2/s) | 1.62 (0.12) | 1.52 (0.10) | 0.10 (0.05, 0.16) | 0.0003 | 0.09 (0.04, 0.14) | 0.001 | |
| λ|| (×10−3 mm2/s) | 1.93 (0.18) | 1.82 (0.13) | 0.12 (0.04, 0.20) | 0.005 | 0.10 (0.03, 0.18) | 0.009 | |
| λ⊥ (×10−3 mm2/s) | 1.47 (0.10) | 1.37 (0.09) | 0.10 (0.05, 0.14) | 0.0001 | 0.09 (0.04, 0.13) | <0.0005 | |
| RB | FA | 0.19 (0.03) | 0.19 (0.03) | −0.002 (− 0.02, 0.01) | 0.8 | 0.001 (−0.01, 0.02) | 0.9 |
| MD (×10−3 mm2/s) | 1.70 (0.16) | 1.57 (0.11) | 0.13 (0.06, 0.20) | 0.0005 | 0.12 (0.05, 0.19) | 0.001 | |
| λ|| (×10−3 mm2/s) | 2.04 (0.22) | 1.89 (0.16) | 0.15 (0.05, 0.25) | 0.003 | 0.15 (0.05, 0.25) | 0.004 | |
| λ⊥ (×10−3 mm2/s) | 1.53 (0.13) | 1.42 (0.10) | 0.12 (0.06, 0.18) | 0.0002 | 0.11 (0.05, 0.17) | <0.0005 | |
| AMB | FA | 0.20 (0.03) | 0.20 (0.02) | 0.0004 (− 0.01, 0.01) | 0.9 | 0.003 (−0.01, 0.02) | 0.7 |
| MD (×10−3 mm2/s) | 1.65 (0.13) | 1.52 (0.09) | 0.13 (0.07, 0.19) | 0.0001 | 0.13 (0.07, 0.19) | <0.0005 | |
| λ|| (×10−3 mm2/s) | 1.99 (0.18) | 1.83 (0.13) | 0.16 (0.07, 0.24) | 0.0003 | 0.16 (0.07, 0.24) | <0.0005 | |
| λ⊥ (×10−3 mm2/s) | 1.48 (0.11) | 1.37 (0.08) | 0.12 (0.06, 0.17) | <0.0001 | 0.11 (0.06, 0.17) | <0.0005 | |
| PMB | FA | 0.20 (0.03) | 0.21 (0.01) | −0.006 (− 0.02, 0.007) | 0.4 | −0.002 (−0.02, 0.01) | 0.8 |
| MD (×10−3 mm2/s) | 1.65 (0.12) | 1.49 (0.08) | 0.16 (0.10, 0.22) | <0.0001 | 0.16 (0.09, 0.22) | <0.0005 | |
| λ|| (×10−3 mm2/s) | 2.00 (0.16) | 1.81 (0.10) | 0.18 (0.10, 0.26) | <0.0001 | 0.19 (0.11, 0.27) | <0.0005 | |
| λ⊥ (×10−3 mm2/s) | 1.48 (0.11) | 1.33 (0.07) | 0.15 (0.09, 0.20) | <0.0001 | 0.14 (0.08, 0.20) | <0.0005 | |
| Isthmus | FA | 0.20 (0.03) | 0.21 (0.02) | −0.008 (− 0.02, 0.004) | 0.19 | −0.005 (−0.02, 0.007) | 0.42 |
| MD (×10−3 mm2/s) | 1.70 (0.13) | 1.52 (0.10) | 0.17 (0.11, 0.23) | <0.0001 | 0.17 (0.11, 0.23) | <0.0005 | |
| λ|| (×10−3 mm2/s) | 2.05 (0.16) | 1.85 (0.12) | 0.20 (0.12, 0.27) | <0.0001 | 0.20 (0.12, 0.27) | <0.0005 | |
| λ⊥ (×10−3 mm2/s) | 1.52 (0.12) | 1.36 (0.10) | 0.16 (0.11, 0.22) | <0.0001 | 0.16 (0.10, 0.21) | <0.0005 | |
| Splenium | FA | 0.20 (0.03) | 0.21 (0.02) | −0.01 (−0.02, 0.002) | 0.10 | −0.007 (−0.02, 0.005) | 0.27 |
| MD (×10−3 mm2/s) | 1.67 (0.12) | 1.51 (0.07) | 0.16 (0.10, 0.21) | <0.0001 | 0.15 (0.09, 0.20) | <0.0005 | |
| λ|| (×10−3 mm2/s) | 2.02 (0.14) | 1.85 (0.09) | 0.17 (0.11, 0.23) | <0.0001 | 0.17 (0.10, 0.23) | <0.0005 | |
| λ⊥ (×10−3 mm2/s) | 1.49 (0.12) | 1.34 (0.07) | 0.15 (0.10, 0.20) | <0.0001 | 0.14 (0.08, 0.19) | <0.0005 | |
Adjusted for gestational age at magnetic resonance imaging
RB = rostral body, AMB = anterior mid-body, PMB = posterior mid-body, SD = standard deviation, diff = difference, CI = confidence interval
Diffusivity values within the callosal tracts (whole and subregions) for both FT and VPT infants are reported in Table 5. FA within tracts was not significantly lower in VPT infants in the CC or any of its sub-regions. However, MD, λ|| and λ⊥ were significantly higher for VPT infants in the whole CC and all sub-regions, and the difference was most pronounced in the posterior sub-regions (Table 5). The differences between FT and VPT infant diffusivity measures within the CC fibre tracts remained after adjusting for GA at MRI (Table 5).
4. Discussion
4.1. Size of the corpus callosum
To our knowledge, this is the first study to assess neonatal callosal cross-sectional area, which suggests that healthy FT infants have an average midline callosal area of 87 mm2. This study is also first to report reductions in CC area in VPT infants at term. Others have reported smaller callosi in VPT children at age 8 years (Peterson et al., 2000) and adolescents ranging approximately 12–15 years of age (Caldu et al., 2006; Nosarti et al., 2004). The main regions affected by prematurity in infants were the posterior two-thirds of the CC, including the AMB, PMB, isthmus and splenium. Considering the CC grows from anterior to posterior, the later developing posterior regions may be more vulnerable to growth deficits during the period between VPT birth and term equivalent. Other groups have also reported that the posterior sub-regions of the CC are most affected by prematurity in adolescents (Nosarti et al., 2004; Stewart et al., 1999) and adults (Lawrence et al., 2010). The regions most affected were those that connect motor, somaesthetic, temporal, posterior parietal and occipital regions between the hemispheres, involved with motor coordination, sensory processing, hearing, language and vision.
4.2. Shape of the corpus callosum
The length of the CC reported in the midline in this study was 42 mm for healthy FT infants of average GA 38.8 weeks, which was consistent with the mean length of 43 mm reported for 38–39 week fetuses using transvaginal sonography (Malinger and Zakut, 1993). VPT infants had less posterior skew of the CC, which complements the finding of smaller posterior CC areas. The more ‘circular’ VPT CC shape appeared to be caused by a more inwardly (posteriorly) bent genu and more outwardly (superiorly) bent AMB region. Although there have been no studies reporting more circular callosi in prematurity, others have found the CC to be more circular in a range of diseases and conditions such as Alzheimer’s disease (Tomaiuolo et al., 2007), fetal alcohol syndrome (Bookstein et al., 2007), Williams syndrome (Tomaiuolo et al., 2002), schizophrenia (Downhill et al., 2000; Narr et al., 2000), and methamphetamine use (Oh et al., 2005). Therefore, it appears that a more circular CC is associated with pathology.
4.3. Corpus callosum diffusion
The average FA within the CC of healthy FT infants for the current study was 0.33 (0.36 for the genu and 0.46 for the splenium). The callosal diffusion values for the current study are similar to those previously reported, which range between 0.32 and 0.42 in the CC of (Bui et al., 2006; Kasprian et al., 2008) and infants at term (Dubois et al., 2006; Provenzale et al., 2007). Differences are most likely due to slightly different ages at scanning, different scanners used, differing field strengths and DTI sequences used (Provenzale et al., 2007).
Measures of diffusion values along the CC skeleton revealed that FA, MD, λ⊥ and λ|| varied regionally. Anisotropy was highest in the splenium, followed by the genu, and lowest in the callosal body, while the MD values showed the opposite pattern, being lowest in the genu, followed by the splenium, and highest in the CC body. This regional pattern of diffusivity within the CC was consistent with previous findings for 3 week old infants (Gao et al., 2009) and adults (Hofer and Frahm, 2006). The distribution of the diffusion measures matches fibre diameter and density characteristics, which is a likely reason for the observed diffusivity differences in the sub-regions of the CC. Absolute fibre density decreases from the genu to the PMB, increases toward the splenium, and is reduced again in the most posterior part of the splenium (Aboitiz et al., 1992).
Directional diffusion was reduced in VPT infants’ corpus callosi, as revealed by smaller FA measures than FT infants. Furthermore, MD and λ⊥ were increased in VPT infant callosi. We can conclude that VPT infants’ callosal WM is less mature than FT infants. The lack of a significant difference between FT and VPT infants’ λ|| in the presence of λ⊥ alterations would imply that the reduced microstructural integrity evident in VPT infants is most likely due to impaired or delayed myelination or pre-myelination.
Regionally, the clearest diffusion changes were seen for MD and λ⊥, which were increased in the VPT genu, PMB and isthmus, indicating less mature WM and possibly delayed or disrupted myelination of the WM connecting the hemispheres of the prefrontal, somaesthetic, parietal and superior temporal cortices involved in planning and cognition, sensory processing, hearing and language. FA was reduced mainly in the RB and isthmus of the VPT infant CC compared with FT infants, indicating altered microstructural integrity of interhemispheric white matter thought to be involved in motor planning and coordination (RB), as well as hearing, language and sensory processing (isthmus).
Consistent with the findings in this study, Skiold and colleagues found FA reductions and MD increases in VPT infant callosi (Skiold et al., 2010). Rose et al. found anisotropy reductions in the posterior part of VPT infants’ callosi, but not the genu (Rose et al., 2008). However, Anjari and colleagues reported that the FA was reduced in the genu of the VPT infants’ callosi (Anjari et al., 2007). In older cohorts, various research groups have reported reduced FA in the posterior of the CC for 11–12 year old children (Constable et al., 2008; Nagy et al., 2003) and 12–17 year old adolescents (Nagy et al., 2009) born preterm. Furthermore, Kontis et al. reported higher MD values within the genu of female young adults born VPT (Kontis et al., 2009). These findings suggest that the alterations seen at term equivalent may persist into childhood and adulthood.
4.4. Interhemispheric connectivity
Tractography has been attempted in a fetal imaging study (Kasprian et al., 2008), and several feasibility studies in infants (Dubois et al., 2006; van Pul et al., 2006; Yoo et al., 2005; Zhai et al., 2003). However, there have been no previous studies examining or comparing the volume of callosal tracts for FT and VPT infants. The current study showed for the first time that the volume of interhemispheric fibre tracts passing through the CC was significantly reduced in VPT infants, indicating that interhemispheric communication may be altered. The AMB and isthmus were particularly vulnerable, which may be explained by the relatively early development of the sensorimotor tracts, which form interhemispheric connections during the VPT period (Berman et al., 2005; Dubois et al., 2006).
Interhemispheric connectivity correlated with CC cross-sectional area. Although it has been suggested and assumed that CC area corresponds to the number or diameter of tracts passing through the CC (Aboitiz et al., 1992; Bloom and Hynd, 2005), this has not been proven until now.
There were no differences in FA within the tracts between FT and VPT infants. Anisotropy changes may, however, have been obscured by the global diffusivity increase, given that FA is calculated as a normalized quantity. Axial and radial diffusivity measures are perhaps a more meaningful way to assess white matter integrity within predefined tracts, and it has been previously suggested that FA alone cannot differentiate the components of WM maturation (Gao et al., 2009). Although no previous studies have compared FT and VPT diffusion measures within CC bundles obtained from tractography, tract-based studies have compared FA values between FT and VPT infants (Anjari et al., 2007; Counsell et al., 2006; Rose et al., 2008). Several of these studies found a particular reduction in anisotropy for the posterior of the CC, especially in VPT infants with WM signal abnormality (Counsell et al., 2006; Rose et al., 2008).
MD, λ|| and λ⊥ measures were increased in the tracts of the whole CC and all sub-regions, particularly posterior interhemispheric tracts in VPT infants. It is likely that there are fewer oligodendrocytes in VPT callosi, which would explain the increased λ⊥ (Provenzale et al., 2007). Increased λ|| in the absence of higher FA values in infants most likely reflects increased water content (Mukherjee et al., 2002). Together the increases in MD, λ|| and λ⊥ within the VPT callosal tracts indicate that WM microstructure is more immature than that of FT infants.
4.5. Implications
The findings of this study suggest that the posterior end of the CC is most vulnerable to insults following very preterm birth. The posterior region of the CC is the last to be formed, but one of the first to begin microstructural development, including myelination, close to term. This developmental sequence would explain the vulnerability of the posterior CC associated with preterm birth. There was also some evidence of changes to the anterior portions of the CC, albeit to a less extent than posterior callosal tracts.
Disrupted development of the CC may have implications for other midline structures that develop in association with the CC, such as the fornix, hippocampus, septum pellucidum and cingulate cortex (Swayze et al., 1990). The CC, as well as its developmentally associated structures, has been associated with attention deficits (Luders et al., 2009), autism (Egaas et al., 1995), bipolar disorder (Atmaca et al., 2007) and schizophrenia (Narr et al., 2002). Therefore, early changes to the CC may lead to higher rates of such disorders for VPT infants as they enter childhood, adolescence or adulthood.
Deficits in the CC have been previously implicated in delayed motor functioning (Rademaker et al., 2004), and reduced intelligence quotient (Caldu et al., 2006). VPT infants are often diagnosed with impaired motor functioning, attention difficulties, impaired memory, delayed language skills and executive dysfunction (Holsti et al., 2002). Therefore alterations to the CC in VPT infants may partially explain adverse neurodevelopmental outcomes.
There may be further implications to having altered CC integrity as VPT infants age. The same cohort has been neurobehaviorally assessed at 2 and 5 years, and is currently being followed up at 7 years of age with MRI, DTI and a comprehensive neuropsychological evaluation; results of associations between CC measurements at term and longer-term neurodevelopmental outcomes will be evaluated for this cohort.
4.6. Limitations
Although reliability scores for manual CC delineations were well above an acceptable level for this study, an automated method of segmenting and sub-dividing the CC would reduce operator bias and random error. Automatic CC delineation methods have been developed (Brejl and Sonka, 2000; Davatzikos et al., 2003b; McInerney et al., 2002; Perez de Alejo et al., 2003; Pitiot et al., 2004), but these methods are difficult to apply to neonatal images as the brain tissue contrast is poor. Many groups are now using WM fibre tractography techniques to sub-divide the CC (Hasan et al., 2009; Huang et al., 2005), which are perhaps the most accurate way to isolate the CC sub-regions.
Quantitative CC width measures were not carried out for this study as the infants’ callosi were often only one, or a few voxels thick. Due to changing voxel sizes throughout this study, thickness measures would not be accurately represented. Some groups have assessed callosal morphological differences using voxel or deformation-based mophometry (Davatzikos et al., 2003a; Spencer et al., 2008), however spatial normalization is difficult in preterm infants due to large variation in brain structure and high incidence of brain abnormalities. In such cases, it has been advised to avoid normalization, considering brain structures can be misrepresented (Wallis et al., 2006). There were a number of assumptions made when assessing CC shape. Skew is not measured directly from the CC, rather the area under the rotated curve of the ellipse fitted to the CC was assumed to correspond to the skew of the CC. For local shape analyses, the correspondence step assumes perfect registration for each point on the CC of one subject to the exact point on all other subjects. In reality this is not possible. However, imperfect registrations would only reduce the sensitivity to find differences between groups.
VPT infants were scanned at a GA that was on average a few days earlier than FT infants for this study. This is a possible confounder, especially for diffusivity measures, considering the dramatic decrease of brain water content with increasing GA (Huppi and Dubois, 2006; Mukherjee et al., 2002; Neil et al., 1998; Partridge et al., 2004). However, correction for GA at MRI was performed for each group comparison, to adjust for this potential confounder. Furthermore, it is known that the water content of the brain, changes dramatically and suddenly from a few days up to a week after birth (Huppi and Dubois, 2006; Neil et al., 1998), possibly affecting diffusion measures of FT infants. However, the postnatal age of the FT infants at the time of MRI was on average 1.8 weeks, by which time brain water content would have equalized. Diffusivity measures can also be affected by partial volume error, particularly in a small ROI such as the CC. However, care was taken to reduce partial volume artifact by tracing the callosi conservatively, and using the overlap of two independent CC tracings.
Slice thicknesses used in diffusion scans for this cohort were large, and varied from 4 to 6 mm. This was a possible confounder, which was tested for by adjusting for voxel size in diffusion analyses, however results did not significantly differ (data not shown). The limited number of diffusion directions obtained was also a limitation of this study. Thus, the DTI derived results presented in this study require confirmation by other studies using advanced DTI acquisition protocols, higher field strength, increased image resolution, and more gradient directions to improve the signal to noise ratio, as well as improved analysis algorithms and techniques.
Future directions for research into WM development of VPT infants could include serial imaging of VPT infants between birth and term equivalent age, in order to follow the progression and causes of WM damage. This study focused on the CC as a particularly vulnerable fibre tract in VPT infants. Other WM tracts relevant to prematurity include visual, sensorimotor, language and attention pathways. Connectivity and microstructural integrity of these tracts should be investigated in VPT infants and related to perinatal factors and neurodevelopmental outcomes in childhood.
5. Conclusions
This study characterizes the size, shape and diffusion characteristics of the CC in FT and VPT infants. The neonatal CC is affected by prematurity. The global and regional structure of the CC differed between FT and VPT infants at term equivalent age. The CC was smaller and more circular in VPT infants. Furthermore, development of CC microstructure and interhemispheric connectivity were disrupted. Insights gained into the alterations of the CC in VPT infants from this study may contribute to the development of tailored clinical interventions to strengthen interhemispheric connectivity and improve long-term functional outcomes.
Acknowledgments
We gratefully thank Merilyn Bear for recruitment, Hong X Wang for image processing, Katherine J Lee for statistical help, the entire VIBeS team for their ideas and support, as well as the families and children who participated in this study.
Funding
This study was supported by the National Health and medical Research council of Australia (237117, L.W.D.; 400317, G.F.E.), the NIH (R01 RR021885, R01 GM074068, R01 EB008015, P30 HD018655, S.K.W.), the United Cerebral Palsy Foundation (USA, T.E.I.), the LeilaY. Mathers Charitable Foundation (USA, G.F.E.), the Brown Foundation (USA, G.F.E.), and the Australian Postgraduate Award (D.K.T.).
Abbreviations
- AC-PC
anterior commissure to posterior commissure line
- AMB
anterior mid-body
- BPD
bronchopulmonary dysplasia
- CC
corpus callosum
- DWI
diffusion weighted image
- DTI
diffusion tensor imaging
- FA
fractional anisotropy
- FOV
field of view
- FSL
Oxford centre for functional magnetic resonance imaging of the brain software library
- FT
full-term
- GA
gestational age
- IUGR
intrauterine growth restriction
- IVH
intraventricular hemorrhage
- MD
mean diffusivity
- MDI
mental developmental index
- PCS
postnatal corticosteroids
- PDI
psychomotor developmental index
- PMB
posterior mid-body
- VPT
very preterm
- PVL
periventricular hemorrhage
- RB
rostral body
- ROI
region of interest
- TE
echo time
- TR
repetition time
- WM
white matter
- λ||
axial diffusivity
- λ⊥
radial diffusivity
Footnotes
Publisher's Disclaimer: This is a PDF file of an unedited manuscript that has been accepted for publication. As a service to our customers we are providing this early version of the manuscript. The manuscript will undergo copyediting, typesetting, and review of the resulting proof before it is published in its final citable form. Please note that during the production process errors may be discovered which could affect the content, and all legal disclaimers that apply to the journal pertain.
Contributor Information
Terrie E. Inder, Email: inder_t@kids.wustl.edu.
Nathan Faggian, Email: nfaggian@bom.gov.au.
Leigh Johnston, Email: leighj@florey.edu.au.
Simon K. Warfield, Email: simon.warfield@childrens.harvard.edu.
Peter J. Anderson, Email: peter.anderson@mcri.edu.au.
Lex W. Doyle, Email: lwd@unimelb.edu.au.
Gary F. Egan, Email: gfegan@unimelb.edu.au.
References
- Aboitiz F, Scheibel AB, Fisher RS, Zaidel E. Fiber composition of the human corpus callosum. Brain Res. 1992;598:143–153. doi: 10.1016/0006-8993(92)90178-c. [DOI] [PubMed] [Google Scholar]
- Andrews JS, Ben-Shachar M, Yeatman JD, Flom LL, Luna B, Feldman HM. Reading performance correlates with white-matter properties in preterm and term children. Dev Med Child Neurol. 2009 doi: 10.1111/j.1469-8749.2009.03456.x. [DOI] [PMC free article] [PubMed] [Google Scholar]
- Anjari M, Srinivasan L, Allsop JM, Hajnal JV, Rutherford MA, Edwards AD, Counsell SJ. Diffusion tensor imaging with tract-based spatial statistics reveals local white matter abnormalities in preterm infants. NeuroImage. 2007;35:1021–1027. doi: 10.1016/j.neuroimage.2007.01.035. [DOI] [PubMed] [Google Scholar]
- Atmaca M, Ozdemir H, Yildirim H. Corpus callosum areas in first-episode patients with bipolar disorder. Psychol Med. 2007;37:699–704. doi: 10.1017/S0033291706009743. [DOI] [PubMed] [Google Scholar]
- Bayer SA, Altman J. The human brain during the third trimester. CRC Press LLC; Boca Raton, Florida: 2004. [Google Scholar]
- Beaulieu C. The basis of anisotropic water diffusion in the nervous system - a technical review. NMR Biomed. 2002;15:435–455. doi: 10.1002/nbm.782. [DOI] [PubMed] [Google Scholar]
- Behrens TE, Woolrich MW, Jenkinson M, Johansen-Berg H, Nunes RG, Clare S, Matthews PM, Brady JM, Smith SM. Characterization and propagation of uncertainty in diffusion-weighted MR imaging. Magn Reson Med. 2003;50:1077–1088. doi: 10.1002/mrm.10609. [DOI] [PubMed] [Google Scholar]
- Berg E, Mahfouz M, Debrunner C, Hoff W. A 2D Fourier approach to deformable model segmentation of 3D medical images. In: Sonka M, Kakadiaris IA, Kybic J, editors. Computer vision and mathematical methods in medical and biomedical image analysis. Springer; Prague: 2004. [Google Scholar]
- Berman JI, Mukherjee P, Partridge SC, Miller SP, Ferriero DM, Barkovich AJ, Vigneron DB, Henry RG. Quantitative diffusion tensor MRI fiber tractography of sensorimotor white matter development in premature infants. NeuroImage. 2005;27:862–871. doi: 10.1016/j.neuroimage.2005.05.018. [DOI] [PubMed] [Google Scholar]
- Bloom JS, Hynd GW. The role of the corpus callosum in interhemispheric transfer of information: excitation or inhibition? Neuropsychol Rev. 2005;15:59–71. doi: 10.1007/s11065-005-6252-y. [DOI] [PubMed] [Google Scholar]
- Bookstein FL. Landmark methods for forms without landmarks: morphometrics of group differences in outline shape. Med Image Anal. 1997;1:225–243. doi: 10.1016/s1361-8415(97)85012-8. [DOI] [PubMed] [Google Scholar]
- Bookstein FL, Connor PD, Huggins JE, Barr HM, Pimentel KD, Streissguth AP. Many infants prenatally exposed to high levels of alcohol show one particular anomaly of the corpus callosum. Alcohol Clin Exp Res. 2007;31:868–879. doi: 10.1111/j.1530-0277.2007.00367.x. [DOI] [PubMed] [Google Scholar]
- Brejl M, Sonka M. Object localization and border detection criteria design in edge-based image segmentation: automated learning from examples. IEEE Trans Med Imaging. 2000;19:973–985. doi: 10.1109/42.887613. [DOI] [PubMed] [Google Scholar]
- Bui T, Daire JL, Chalard F, Zaccaria I, Alberti C, Elmaleh M, Garel C, Luton D, Blanc N, Sebag G. Microstructural development of human brain assessed in utero by diffusion tensor imaging. Pediatr Radiol. 2006;36:1133–1140. doi: 10.1007/s00247-006-0266-3. [DOI] [PubMed] [Google Scholar]
- Caldu X, Narberhaus A, Junque C, Gimenez M, Vendrell P, Bargallo N, Segarra D, Botet F. Corpus callosum size and neuropsychologic impairment in adolescents who were born preterm. J Child Neurol. 2006;21:406–410. doi: 10.1177/08830738060210050801. [DOI] [PubMed] [Google Scholar]
- Constable RT, Ment LR, Vohr BR, Kesler SR, Fulbright RK, Lacadie C, Delancy S, Katz KH, Schneider KC, Schafer RJ, Makuch RW, Reiss AR. Prematurely born children demonstrate white matter microstructural differences at 12 years of age, relative to term control subjects: an investigation of group and gender effects. Pediatrics. 2008;121:306–316. doi: 10.1542/peds.2007-0414. [DOI] [PubMed] [Google Scholar]
- Counsell SJ, Shen Y, Boardman JP, Larkman DJ, Kapellou O, Ward P, Allsop JM, Cowan FM, Hajnal JV, Edwards AD, Rutherford MA. Axial and radial diffusivity in preterm infants who have diffuse white matter changes on magnetic resonance imaging at term-equivalent age. Pediatrics. 2006;117:376–386. doi: 10.1542/peds.2005-0820. [DOI] [PubMed] [Google Scholar]
- Davatzikos C, Barzi A, Lawrie T, Hoon AH, Jr, Melhem ER. Correlation of corpus callosal morphometry with cognitive and motor function in periventricular leukomalacia. Neuropediatrics. 2003a;34:247–252. doi: 10.1055/s-2003-43259. [DOI] [PubMed] [Google Scholar]
- Davatzikos C, Tao X, Shen D. Hierarchical active shape models, using the wavelet transform. IEEE Trans Med Imaging. 2003b;22:414–423. doi: 10.1109/TMI.2003.809688. [DOI] [PubMed] [Google Scholar]
- Downhill JE, Jr, Buchsbaum MS, Wei T, Spiegel-Cohen J, Hazlett EA, Haznedar MM, Silverman J, Siever LJ. Shape and size of the corpus callosum in schizophrenia and schizotypal personality disorder. Schizophr Res. 2000;42:193–208. doi: 10.1016/s0920-9964(99)00123-1. [DOI] [PubMed] [Google Scholar]
- Dryden IL, Walker G. Highly resistant regression and object matching. Biometrics. 1999;55:820–825. doi: 10.1111/j.0006-341x.1999.00820.x. [DOI] [PubMed] [Google Scholar]
- Dubois J, Hertz-Pannier L, Dehaene-Lambertz G, Cointepas Y, Le Bihan D. Assessment of the early organization and maturation of infants’ cerebral white matter fiber bundles: a feasibility study using quantitative diffusion tensor imaging and tractography. NeuroImage. 2006;30:1121–1132. doi: 10.1016/j.neuroimage.2005.11.022. [DOI] [PubMed] [Google Scholar]
- Egaas B, Courchesne E, Saitoh O. Reduced size of corpus callosum in autism. Arch Neurol. 1995;52:794–801. doi: 10.1001/archneur.1995.00540320070014. [DOI] [PubMed] [Google Scholar]
- Fitzgibbon A, Pilu M, Fisher RB. Direct least square fitting of ellipses. IEEE Transactions on Pattern Analysis and Machine Intelligence. 1999;21:476–480. [Google Scholar]
- Free SL, Bergin PS, Fish DR, Cook MJ, Shorvon SD, Stevens JM. Methods for normalization of hippocampal volumes measured with MR. AJNR Am J Neuroradiol. 1995;16:637–643. [PMC free article] [PubMed] [Google Scholar]
- Gao W, Lin W, Chen Y, Gerig G, Smith JK, Jewells V, Gilmore JH. Temporal and spatial development of axonal maturation and myelination of white matter in the developing brain. AJNR Am J Neuroradiol. 2009;30:290–296. doi: 10.3174/ajnr.A1363. [DOI] [PMC free article] [PubMed] [Google Scholar]
- Hasan KM, Kamali A, Iftikhar A, Kramer LA, Papanicolaou AC, Fletcher JM, Ewing-Cobbs L. Diffusion tensor tractography quantification of the human corpus callosum fiber pathways across the lifespan. Brain Res. 2009;1249:91–100. doi: 10.1016/j.brainres.2008.10.026. [DOI] [PMC free article] [PubMed] [Google Scholar]
- Hofer S, Frahm J. Topography of the human corpus callosum revisited--Comprehensive fiber tractography using diffusion tensor magnetic resonance imaging. NeuroImage. 2006;32:989–994. doi: 10.1016/j.neuroimage.2006.05.044. [DOI] [PubMed] [Google Scholar]
- Holsti L, Grunau RV, Whitfield MF. Developmental coordination disorder in extremely low birth weight children at nine years. J Dev Behav Pediatr. 2002;23:9–15. doi: 10.1097/00004703-200202000-00002. [DOI] [PubMed] [Google Scholar]
- Huang H, Zhang J, Jiang H, Wakana S, Poetscher L, Miller MI, van Zijl PCM, Hillis AE, Wytik R, Mori S. DTI tractography based parcellation of white matter: application to the mid-sagittal morphology of corpus callosum. NeuroImage. 2005;26:195–205. doi: 10.1016/j.neuroimage.2005.01.019. [DOI] [PubMed] [Google Scholar]
- Huppi PS, Dubois J. Diffusion tensor imaging of brain development. Semin Fetal Neonatal Med. 2006;11:489–497. doi: 10.1016/j.siny.2006.07.006. [DOI] [PubMed] [Google Scholar]
- Huppi PS, Maier SE, Peled S, Zientara GP, Barnes PD, Jolesz FA, Volpe JJ. Microstructural development of human newborn cerebral white matter assessed in vivo by diffusion tensor magnetic resonance imaging. Pediatr Res. 1998;44:584–590. doi: 10.1203/00006450-199810000-00019. [DOI] [PubMed] [Google Scholar]
- Inder TE, Warfield SK, Wang H, Huppi PS, Volpe JJ. Abnormal cerebral structure is present at term in premature infants. Pediatrics. 2005;115:286–294. doi: 10.1542/peds.2004-0326. [DOI] [PubMed] [Google Scholar]
- Inder TE, Wells SJ, Mogridge NB, Spencer C, Volpe JJ. Defining the nature of the cerebral abnormalities in the premature infant: a qualitative magnetic resonance imaging study. J Pediatr. 2003;143:171–179. doi: 10.1067/S0022-3476(03)00357-3. [DOI] [PubMed] [Google Scholar]
- Jenkinson M, Smith S. A global optimisation method for robust affine registration of brain images. Med Image Anal. 2001;5:143–156. doi: 10.1016/s1361-8415(01)00036-6. [DOI] [PubMed] [Google Scholar]
- Kasprian G, Brugger PC, Weber M, Krssak M, Krampl E, Herold C, Prayer D. In utero tractography of fetal white matter development. NeuroImage. 2008;43:213–224. doi: 10.1016/j.neuroimage.2008.07.026. [DOI] [PubMed] [Google Scholar]
- Keshavan MS, Diwadkar VA, DeBellis M, Dick E, Kotwal R, Rosenberg DR, Sweeney JA, Minshew N, Pettegrew JW. Development of the corpus callosum in childhood, adolescence and early adulthood. Life Sci. 2002;70:1909–1922. doi: 10.1016/s0024-3205(02)01492-3. [DOI] [PubMed] [Google Scholar]
- Kikinis R, Shenton ME, Gerig G, Martin J, Anderson M, Metcalf D, Guttmann CR, McCarley RW, Lorensen W, Cline H, et al. Routine quantitative analysis of brain and cerebrospinal fluid spaces with MR imaging. J Magn Reson Imaging. 1992;2:619–629. doi: 10.1002/jmri.1880020603. [DOI] [PubMed] [Google Scholar]
- Kontis D, Catani M, Cuddy M, Walshe M, Nosarti C, Jones D, Wyatt J, Rifkin L, Murray R, Allin M. Diffusion tensor MRI of the corpus callosum and cognitive function in adults born preterm. Neuroreport. 2009;20:424–428. doi: 10.1097/WNR.0b013e328325a8f9. [DOI] [PubMed] [Google Scholar]
- Lawrence EJ, Allen GM, Walshe M, Allin M, Murray R, Rifkin L, McGuire PK, Nosarti C. The corpus callosum and empathy in adults with a history of preterm birth. J Int Neuropsychol Soc. 2010;16:716–720. doi: 10.1017/S1355617710000500. [DOI] [PubMed] [Google Scholar]
- Luders E, Narr KL, Hamilton LS, Phillips OR, Thompson PM, Valle JS, Del’Homme M, Strickland T, McCracken JT, Toga AW, Levitt JG. Decreased callosal thickness in attention-deficit/hyperactivity disorder. Biol Psychiatry. 2009;65:84–88. doi: 10.1016/j.biopsych.2008.08.027. [DOI] [PMC free article] [PubMed] [Google Scholar]
- Mai JK, Assheuer J, Paxinos G. Atlas of the human brain. Academic Press; San Diego: 1997. [Google Scholar]
- Malinger G, Zakut H. The corpus callosum: normal fetal development as shown by transvaginal sonography. AJR Am J Roentgenol. 1993;161:1041–1043. doi: 10.2214/ajr.161.5.8273605. [DOI] [PubMed] [Google Scholar]
- McInerney T, Hamarneh G, Shenton M, Terzopoulos D. Deformable organisms for automatic medical image analysis. Med Image Anal. 2002;6:251–266. doi: 10.1016/s1361-8415(02)00083-x. [DOI] [PMC free article] [PubMed] [Google Scholar]
- Melhem ER, Mori S, Mukundan G, Kraut MA, Pomper MG, van Zijl PC. Diffusion tensor MR imaging of the brain and white matter tractography. AJR Am J Roentgenol. 2002;178:3–16. doi: 10.2214/ajr.178.1.1780003. [DOI] [PubMed] [Google Scholar]
- Mukherjee P, Miller JH, Shimony JS, Philip JV, Nehra D, Snyder AZ, Conturo TE, Neil JJ, McKinstry RC. Diffusion-tensor MR imaging of gray and white matter development during normal human brain maturation. AJNR Am J Neuroradiol. 2002;23:1445–1456. [PMC free article] [PubMed] [Google Scholar]
- Nagy Z, Ashburner J, Andersson J, Jbabdi S, Draganski B, Skare S, Bohm B, Smedler AC, Forssberg H, Lagercrantz H. Structural correlates of preterm birth in the adolescent brain. Pediatrics. 2009;124:e964–972. doi: 10.1542/peds.2008-3801. [DOI] [PubMed] [Google Scholar]
- Nagy Z, Westerberg H, Skare S, Andersson JL, Lilja A, Flodmark O, Fernell E, Holmberg K, Bohm B, Forssberg H, Lagercrantz H, Klingberg T. Preterm children have disturbances of white matter at 11 years of age as shown by diffusion tensor imaging. Pediatric Research. 2003;54:672–679. doi: 10.1203/01.PDR.0000084083.71422.16. [DOI] [PubMed] [Google Scholar]
- Narberhaus A, Segarra D, Caldu X, Gimenez M, Junque C, Pueyo R, Botet F. Gestational age at preterm birth in relation to corpus callosum and general cognitive outcome in adolescents. J Child Neurol. 2007;22:761–765. doi: 10.1177/0883073807304006. [DOI] [PubMed] [Google Scholar]
- Narr KL, Cannon TD, Woods RP, Thompson PM, Kim S, Asunction D, van Erp TGM, Poutanen VP, Huttunen M, Lonnqvist J, Standerksjold-Nordenstam CG, Kaprio J, Mazziotta JC, Toga AW. Genetic contributions to altered callosal morphology in schizophrenia. J Neurosci. 2002;22:3720–3729. doi: 10.1523/JNEUROSCI.22-09-03720.2002. [DOI] [PMC free article] [PubMed] [Google Scholar]
- Narr KL, Thompson PM, Sharma T, Moussai J, Cannestra AF, Toga AW. Mapping morphology of the corpus callosum in schizophrenia. Cereb Cortex. 2000;10:40–49. doi: 10.1093/cercor/10.1.40. [DOI] [PubMed] [Google Scholar]
- Neil JJ, Shiran SI, McKinstry RC, Schefft GL, Snyder AZ, Almli CR, Akbudak E, Aronovitz JA, Miller JP, Lee BC, Conturo TE. Normal brain in human newborns: apparent diffusion coefficient and diffusion anisotropy measured by using diffusion tensor MR imaging. Radiology. 1998;209:57–66. doi: 10.1148/radiology.209.1.9769812. [DOI] [PubMed] [Google Scholar]
- Nosarti C, Rushe TM, Woodruff PW, Stewart AL, Rifkin L, Murray RM. Corpus callosum size and very preterm birth: relationship to neuropsychological outcome. Brain. 2004;127:2080–2089. doi: 10.1093/brain/awh230. [DOI] [PubMed] [Google Scholar]
- Oh JS, Lyoo IK, Sung YH, Hwang J, Kim J, Chung A, Park KS, Kim SJ, Renshaw PF, Song IC. Shape changes of the corpus callosum in abstinent methamphetamine users. Neurosci Lett. 2005;384:76–81. doi: 10.1016/j.neulet.2005.04.082. [DOI] [PubMed] [Google Scholar]
- Partridge SC, Mukherjee P, Henry RG, Miller SP, Berman JI, Jin H, Lu Y, Glenn OA, Ferriero DM, Barkovich AJ, Vigneron DB. Diffusion tensor imaging: serial quantitation of white matter tract maturity in premature newborns. NeuroImage. 2004;22:1302–1314. doi: 10.1016/j.neuroimage.2004.02.038. [DOI] [PubMed] [Google Scholar]
- Perez de Alejo R, Ruiz-Cabello J, Cortijo M, Rodriguez I, Echave I, Regadera J, Arrazola J, Aviles P, Barreiro P, Gargallo D, Grana M. Computer-assisted enhanced volumetric segmentation magnetic resonance imaging data using a mixture of artificial neural networks. Magn Reson Imaging. 2003;21:901–912. doi: 10.1016/s0730-725x(03)00193-0. [DOI] [PubMed] [Google Scholar]
- Peterson BS, Vohr B, Staib LH, Cannistraci CJ, Dolberg A, Schneider KC, Katz KH, Westerveld M, Sparrow S, Anderson AW, Duncan CC, Makuch RW, Gore JC, Ment LR. Regional brain volume abnormalities and long-term cognitive outcome in preterm infants. JAMA. 2000;284:1939–1947. doi: 10.1001/jama.284.15.1939. [DOI] [PubMed] [Google Scholar]
- Pfefferbaum A, Rosenbloom MJ, Rohlfing T, Adalsteinsson E, Kemper CA, Deresinski S, Sullivan EV. Contribution of alcoholism to brain dysmorphology in HIV infection: effects on the ventricles and corpus callosum. NeuroImage. 2006;33:239–251. doi: 10.1016/j.neuroimage.2006.05.052. [DOI] [PubMed] [Google Scholar]
- Pitiot A, Delingette H, Thompson PM, Ayache N. Expert knowledge-guided segmentation system for brain MRI. NeuroImage. 2004;23:S85–S96. doi: 10.1016/j.neuroimage.2004.07.040. [DOI] [PubMed] [Google Scholar]
- Provenzale JM, Liang L, DeLong D, White LE. Diffusion tensor imaging assessment of brain white matter maturation during the first postnatal year. AJR Am J Roentgenol. 2007;189:476–486. doi: 10.2214/AJR.07.2132. [DOI] [PubMed] [Google Scholar]
- Rademaker KJ, Lam JN, Van Haastert IC, Uiterwaal CS, Lieftink AF, Groenendaal F, Grobbee DE, de Vries LS. Larger corpus callosum size with better motor performance in prematurely born children. Semin Perinatol. 2004;28:279–287. doi: 10.1053/j.semperi.2004.08.005. [DOI] [PubMed] [Google Scholar]
- Richards LJ, Plachez C, Ren T. Mechanisms regulating the development of the corpus callosum and its agenesis in mouse and human. Clin Genet. 2004;66:276–289. doi: 10.1111/j.1399-0004.2004.00354.x. [DOI] [PubMed] [Google Scholar]
- Rose SE, Hatzigeorgiou X, Strudwick MW, Durbridge G, Davies PS, Colditz PB. Altered white matter diffusion anisotropy in normal and preterm infants at term-equivalent age. Magn Reson Med. 2008;60:761–767. doi: 10.1002/mrm.21689. [DOI] [PubMed] [Google Scholar]
- Schmahmann J, Pandya D. Fiber pathways of the brain. Oxford University Press; New York: 2006. [Google Scholar]
- Schneider JF, Il’yasov KA, Hennig J, Martin E. Fast quantitative diffusion-tensor imaging of cerebral white matter from the neonatal period to adolescence. Neuroradiology. 2004;46:258–266. doi: 10.1007/s00234-003-1154-2. [DOI] [PubMed] [Google Scholar]
- Skiold B, Horsch S, Hallberg B, Engstrom M, Nagy Z, Mosskin M, Blennow M, Aden U. White matter changes in extremely preterm infants, a population-based diffusion tensor imaging study. Acta Paediatr. 2010;99:842–849. doi: 10.1111/j.1651-2227.2009.01634.x. [DOI] [PubMed] [Google Scholar]
- Smith SM. Fast robust automated brain extraction. Hum Brain Mapp. 2002;17:143–155. doi: 10.1002/hbm.10062. [DOI] [PMC free article] [PubMed] [Google Scholar]
- Spencer MD, Moorhead TWJ, Gibson RJ, McIntosh AM, Sussmann JED, Owens DGC, Lawrie SM, Johnstone EC. Low birthweight and preterm birth in young people with special educational needs: a magnetic resonance imaging analysis. BMC Med. 2008;6:1. doi: 10.1186/1741-7015-6-1. [DOI] [PMC free article] [PubMed] [Google Scholar]
- Stewart AL, Rifkin L, Amess PN, Kirkbride V, Townsend JP, Miller DH, Lewis SW, Kingsley DP, Moseley IF, Foster O, Murray RM. Brain structure and neurocognitive and behavioural function in adolescents who were born very preterm. Lancet. 1999;353:1653–1657. doi: 10.1016/s0140-6736(98)07130-x. [DOI] [PubMed] [Google Scholar]
- Swayze VW, 2nd, Andreasen NC, Ehrhardt JC, Yuh WT, Alliger RJ, Cohen GA. Developmental abnormalities of the corpus callosum in schizophrenia. Arch Neurol. 1990;47:805–808. doi: 10.1001/archneur.1990.00530070103018. [DOI] [PubMed] [Google Scholar]
- Talairach J, Tournoux P. Co-Planar Stereotaxic Atlas of the Human Brain. Thieme Medical Publishers; New York: 1988. [Google Scholar]
- Thompson DK, Warfield SK, Carlin JB, Pavlovic M, Wang HX, Bear M, Kean MJ, Doyle LW, Egan GF, Inder TE. Perinatal risk factors altering regional brain structure in the preterm infant. Brain. 2007;130:667–677. doi: 10.1093/brain/awl277. [DOI] [PubMed] [Google Scholar]
- Thompson DK, Wood SJ, Doyle LW, Warfield SK, Lodygensky GA, Anderson PJ, Egan GF, Inder TE. Neonate hippocampal volumes: Prematurity, perinatal predictors, and 2-year outcome. Ann Neurol. 2008;63:642–651. doi: 10.1002/ana.21367. [DOI] [PubMed] [Google Scholar]
- Tomaiuolo F, Di Paola M, Caravale B, Vicari S, Petrides M, Caltagirone C. Morphology and morphometry of the corpus callosum in Williams syndrome: a T1-weighted MRI study. Neuroreport. 2002;13:2281–2284. doi: 10.1097/00001756-200212030-00022. [DOI] [PubMed] [Google Scholar]
- Tomaiuolo F, Scapin M, Di Paola M, Le Nezet P, Fadda L, Musicco M, Caltagirone C, Collins DL. Gross anatomy of the corpus callosum in Alzheimer’s disease: regions of degeneration and their neuropsychological correlates. Dement Geriatr Cogn Disord. 2007;23:96–103. doi: 10.1159/000097371. [DOI] [PubMed] [Google Scholar]
- van der Knaap MS, Valk J. Magnetic resonance of myelination and myelin disorders. 3. Springer-Verlag; Berlin: 1995. [Google Scholar]
- van Pul C, Buijs J, Vilanova A, Roos FG, Wijn PF. Infants with perinatal hypoxic ischemia: feasibility of fiber tracking at birth and 3 months. Radiology. 2006;240:203–214. doi: 10.1148/radiol.2393041523. [DOI] [PubMed] [Google Scholar]
- Wallis LI, Widjaja E, Wignall EL, Wilkinson ID, Griffiths PD. Misrepresentation of surface rendering of pediatric brain malformations performed following spatial normalization. Acta Radiol. 2006;47:1094–1099. doi: 10.1080/02841850600979048. [DOI] [PubMed] [Google Scholar]
- Witelson SF. Hand and sex differences in the isthmus and genu of the human corpus callosum. A postmortem morphological study. Brain. 1989;112:799–835. doi: 10.1093/brain/112.3.799. [DOI] [PubMed] [Google Scholar]
- Yoo SS, Park HJ, Soul JS, Mamata H, Park H, Westin CF, Bassan H, Du Plessis AJ, Robertson RL, Jr, Maier SE, Ringer SA, Volpe JJ, Zientara GP. In vivo visualization of white matter fiber tracts of preterm- and term-infant brains with diffusion tensor magnetic resonance imaging. Invest Radiol. 2005;40:110–115. doi: 10.1097/01.rli.0000149491.69201.cb. [DOI] [PubMed] [Google Scholar]
- Zhai G, Lin W, Wilber KP, Gerig G, Gilmore JH. Comparisons of regional white matter diffusion in healthy neonates and adults performed with a 3.0-T head-only MR imaging unit. Radiology. 2003;229:673–681. doi: 10.1148/radiol.2293021462. [DOI] [PubMed] [Google Scholar]