Abstract
In contrast to the more common Diffusion Tensor Imaging (DTI), High Angular Resolution Diffusion Imaging (HARDI) allows superior delineation of angular microstructures of brain white matter, and makes possible multiple-fiber modeling of each voxel for better characterization of brain connectivity. However, the complex orientation information afforded by HARDI makes registration of HARDI images more complicated than scalar images. In particular, the question of how much orientation information is needed for satisfactory alignment has not been sufficiently addressed. Low order orientation representation is generally more robust than high order representation, although the latter provides more information for correct alignment of fiber pathways. However, high order representation, when naïvely utilized, might not necessarily be conducive to improving registration accuracy since similar structures with significant orientation differences prior to proper alignment might be mistakenly taken as non-matching structures. We present in this paper a HARDI registration algorithm, called SPherical Harmonic Elastic REgistration (SPHERE), which in a principled means hierarchically extracts orientation information from HARDI data for structural alignment. The image volumes are first registered using robust, relatively direction invariant features derived from the Orientation Distribution Function (ODF), and the alignment is then further refined using spherical harmonic (SH) representation with gradually increasing orders. This progression from non-directional, single-directional to multi-directional representation provides a systematic means of extracting directional information given by diffusion-weighted imaging. Coupled with a template-subject-consistent soft-correspondence-matching scheme, this approach allows robust and accurate alignment of HARDI data. Experimental results show marked increase in accuracy over a state-of-the-art DTI registration algorithm.
Keywords: High Angular Resolution Diffusion Imaging (HARDI), Diffusion-Weighted Imaging (DWI), Deformable Registration, Spherical Harmonics, Brain White Matter, Brain Circuitry
1. Introduction
Diffusion Tensor Imaging (DTI) (Alexander, 2006) is well-established for characterizing neural pathways in the brain by means of fiber tractography. However, its inherent Gaussian assumption of water diffusion does not always hold true, and it has in fact been shown that a significant fraction of the white matter (WM) voxels contain fiber bundle crossings (Behrens et al., 2007), in which case the simplistic model of DTI breaks down. One of the methods proposed to remedy this is via High Angular Resolution Diffusion Imaging (HARDI) (Tuch et al., 1999), suggesting that the apparent diffusion coefficients could be evaluated along many different directions without fitting a global function to the data. The outcome is an angular distribution of the diffusion-weighted signal attenuation.
Precise voxel-level comparison of HARDI datasets cannot yet be performed across subjects without removing confounding structural variability. Better structural alignment generally allows increased specificity in delineating changes related to growth, diseases, and aging. For this reason, there has been a recent flourish of HARDI registration algorithms. Fourth order tensors (Barmpoutis et al., 2009), along with a distance called the Hellinger distance, were employed by Barmpoutis et al. (Barmpoutis et al., 2007) for registration of human hippocampi. Geng et al. (Geng et al., 2009) proposed a method which utilized a spherical harmonic (SH) representation of the orientation distribution function (ODFs). Reorientation was performed directly on the SH coefficients in a manner similar to the Finite Strain (FS) method (Alexander et al., 2001b) by extracting rotation matrices from local Jacobians. Cheng et al. (Cheng et al., 2009) took a multi-compartmental approach which was based on Gaussian mixtures. Reorientation was performed on the individual Gaussian components, each representing a major fiber direction, using an extension of the Preservation of Principal Directions (PPD) method (Alexander et al., 2001b). Hong et al. (Hong et al., 2009) performed registration with the help of T2-weighted images and applied the estimated deformation fields to the diffusion-weighted images with retransformation — taking into account rotation, scaling, and shearing effects of the spatial transformation — of the fiber orientation distribution. Bloy and Verma (Bloy and Verma, 2010) computed the SH band energies as features for use with a Demons-based multi-channel registration algorithm for alignment of HARDI data.
For effective utilization of the wealth of information afforded by HARDI, we propose in this paper a hierarchical spherical harmonics (SHs) based HARDI registration algorithm. SHs (Alexander et al., 2002; Frank, 2002) of different orders have been shown to be capable of representing different diffusivity patterns (Frank, 2002). Specifically, zeroth, second and fourth order SHs (see Fig. 1) have basis functions with shapes which are sphere-like, cigar-like and cross-like — ideal for representing voxels with isotropic, single-fiber, and dual-fiber diffusivity profiles, respectively. This property presents a natural way of hierarchically extracting orientation information afforded by diffusion-weighted imaging (DWI). The key of our approach involves representing the Orientation Distribution Profile (ODF) with increasing complexity to help progressively refine the registration. This effectively allows lower order, relatively orientation invariant, but more robust representations to guide the initial registration and higher order, directional, more precise representations to refine the alignment. This approach puts high and low order information in their proper contexts and helps avoid the mismatching arising from large structural orientation differences.
Figure 1.
(a) Zeroth order, (b) second order, and (c) fourth order SHs for representing isotropic, single-fiber and dual-fiber diffusivity profiles.
Registration is achieved by employing a forward-backward-consistent soft-correspondence-matching scheme. In formulating the cost function for registration, we take into account simultaneously correspondence matching as seen from the points of view of both the template image and the subject image to ensure that the registration is guided by consistent information given by both images (Christensen, 1999). We also employ a soft-correspondence scheme where multiple matching candidates are allowed to guide the deformation of each voxel to ensure robustness to outliers (Chui and Rangarajan, 2003). The complexity of the brain anatomical structure makes matching rather ambiguous, and incorrect deformation caused by misguidance due to outliers, especially in the early stages, would be disastrous for later stages of the registration. For this reason, we allow multiple candidate points to play a concerted role in guiding the deformation of a particular voxel in the early registration phase and enforce a more one-to-one matching in the later phase. Comprehensive evaluation with a series of experiments demonstrates that SPHERE yields improved performance, compared with a state-of-the-art DTI-based registration (Yap et al., 2010).
The rest of the paper is organized as follows. We describe in Section 2 the forms of ODF representation used in SPHERE. We further show how these representations can be used in a forward-backward-consistent soft-correspondence matching scheme for achieving HARDI registration. Section 3 demonstrates the effectiveness of SPHERE via a number of experiments. Section 4 provides some further discussion on the current work. Section 5 concludes this paper.
2. Methods
We introduce in this section the key working mechanisms of SPHERE. We discuss the forms of representation used for characterizing the ODF, the retransformation mechanism needed for orientation correction related to spatial warping, the measure involved in gauging the similarity of the feature vector computed for each voxel, and the registration framework involved in the alignment of HARDI data.
2.1. Representation of the ODF
From the diffusion-attenuation signal acquired with DWI, an ODF characterizing fiber pathway orientation information can be computed for each image voxel. In what follows, we describe the ODF representations used in SPHERE: 1) SH based representation, and 2) Statistical descriptors.
2.1.1. Spherical Harmonic Representation
SHs, denoted as , with l denoting the order and m the phase factor, are a basis for complex functions on the unit sphere. Explicitly, they are given as:
| (1) |
where (θ, ϕ) obeys the physics convention (θ ∈ [0, π], ϕ ∈ [0, 2π]) and is an associated Legendre polynomial. Since diffusion signals are real and antipodal symmetric, it is sufficient to utilize a real basis function set of even orders, i.e., for l = 0, 2, 4, …, L and m = −L, …, 0, …, L:
| (2) |
where represent the real and imaginary parts of , respectively.
We denote S(g) as the diffusion-attenuated signals at a finite set of points on a sphere, where g is the diffusion encoding direction in a pulsed-gradient spin-echo experiment. As a spherical function, it can be approximated as a linear combination of a set of SH basis functions:
| (3) |
Order L determines the complexity of the representation. A higher value for L will bring the representation closer to the original signal and will hence extract more directional information (Frank, 2002). The SH coefficients are determined using a Laplace-Beltrami regularized least-squares estimator, as described in (Descoteaux et al., 2007).
To compute the ODF, we employ the strategy proposed by Descoteaux et al. (Descoteaux et al., 2007) where the Funk-Radon transform, working together with the Funk-Hecke theorem (Descoteaux et al., 2007), is used to obtain the ODF by scaling the SH coefficients in (3), i.e., , where Pl(x) is the Legendre polynomial of degree l. That is, the ODF, Φ(g), given by S(g) is:
| (4) |
2.1.2. Statistical Descriptors and Edge Maps
We incorporate in SPHERE, in addition to SHs, the following statistical descriptors of the ODF. The mean of the ODF is computed over the unit sphere Ω:
| (5) |
In practice, the above equation is implemented in its discrete form:
| (6) |
where 𝒢 is the direction set. From the above equation, it is clear that the mean is invariant to the transformation of gi caused by spatial warping. The ODF anisotropy, which measures the deviation of the ODF from its isotropic component, is defined as:
| (7) |
For better characterization of structural shapes, regional statistical descriptors consisting of regional mean:
| (8) |
and regional anisotropy:
| (9) |
are computed for the neighborhood 𝒩 of each voxel. In addition to these descriptors, we applied a Canny edge detector on the μ and ρ maps to obtain edge information (denoted as ℋμ, ℋρ) for guiding the alignment of tissue boundaries. Example statistical and edge maps are shown in Fig. 2.
Figure 2.
Statistical and edge maps: (a) Mean, μ, (b) Anisotropy, ρ, (c) Regional mean, μ𝒩, (d) Regional anisotropy, ρ𝒩, (e) μ edge map, ℋμ, and (f) ρ edge map, ℋρ.
2.2. Retransformation of the ODF
The alignment of HARDI data poses as a challenging problem since, on top of spatial registration, a retransformation of the ODF is needed to ensure proper alignment of the WM fascicle. To achieve this, we have implemented the method proposed by Rafflet et al. (Raffelt et al., 2009), where we approximate the ODF using a number of weighted Point Spread Functions (PSFs), reorient these PSFs individually, and then recompose the reoriented PSFs to obtain the transformed ODF. Specifically, from the transformation f estimated at each iteration of the registration, a local transformation matrix F is computed for each voxel, and the direction of each PSF, gi, is transformed by F and becomes (See Fig. 3).
Figure 3.
A 2D illustration of the retransformation mechanism used in SPHERE. Each PSF direction g (only two directions are shown) is transformed by the local transformation matrix F to become . Note that reorientation of the PSFs using the rotation component R extracted from F alone (far right) is not appropriate, since every PSF direction is equally rotated and hence does not reflect the true effect of the local deformation on the ODF.
2.3. Feature Vector and Similarity Measure
For each voxel at location x, the SH coefficients and statistical descriptors are grouped into a vector a(x) = [a1(x), a2(x)], with:
| (10) |
where is the set of weighted SH coefficients computed up to order L. The weight of each order-band l is denoted by wl ∈ [0, 1]. In our implementation, the weights are dependent on the iteration t ≤ τ, where τ is the total number of iterations used in correspondence matching. Denoting the maximally allowed order of SHs at a particular iteration t as L(t) = sup {l|t ≥ ζlτ, l ≤ L}, where 0 ≤ ζ0 < ζ2 < … < ζl < … < ζL ≤ 1 are constants determining the point of time at which L(t) is increased to l, we define the weights as:
| (11) |
Note that the lower order SH coefficients can be progressively suppressed by letting 0 ≤ κL/2 < … < κ1 < κ0 = 1, so that emphasis can be placed on the higher order SH coefficients. SPHERE by default uses L = 4 with κ1 = 0.40 and κ2 = 0.20.
Normalizing the elements of a1(x) to have a range of [0, 1], the similarity measure can be defined as:
| (12) |
where Θ[a] = ∏k(1 − |ak|), and xT and xS are specific voxel locations in the template image and the subject image, respectively. In the first term of the similarity measure, we are interested in gauging the intensity similarity of the statistical features. This is helpful to ensure that different types of tissues (e.g., as indicated by the mean and anisotropy maps) will not be matched. This is modulated by the second part of the similarity measure, where by using the normalized scalar product, we are more interested in measuring via the SH coefficients the shape, instead of intensity similarity, between ODFs. For robustness, we employ instead regional similarity measures:
| (13) |
which compare the similarity of the feature vectors in the neighborhood ℳ surrounding xT in the template image with that of xS in the subject image with consideration of the transformation f. Note that similarity measures in both directions are defined so that they can be employed for forward-backward consistent matching. The SH coefficients are re-estimated in each iteration of the registration to take into account the effect the spatial transformation has on the ODF. Compared with voxel-wise measures, regional similarity measures that take into account voxel neighborhood information are generally more robust to noise.
2.4. Landmark Selection
The sheer number of voxels in an image volume can make the computation involved in registration prohibitive. This is aggravated for the case of HARDI where information is increased by a few folds due to acquisition in a significant number of non-collinear directions. To overcome this, out of all possible voxels of a template image and a subject image, we select as landmarks a subset of voxels with highly distinctive feature vectors for correspondence matching. As the registration progresses, an increasing number of landmarks are used to refine the registration. Besides the obvious benefit of making the correspondence matching problem more feasible, this approach also helps mitigate the problem of local minima. Selecting an initial smaller number of landmarks essentially means that we are now solving a lower-degrees-of-freedom approximation of the transformation, and is hence less prone to be trapped by local minima. As more landmarks start to participate, transformation of increasing complexity can be estimated. SPHERE selects as landmarks a combination of voxels with the highest edge magnitudes (ℋμ > α(ℋμ), ℋρ > α(ℋρ)) and anisotropy magnitudes (ρ > α(ρ)), since these voxels represent important anatomical structures, and can be located reliably in images with sufficient contrast. Selecting voxels with high anisotropy values (refer Fig. 2(b)) as landmarks facilitates the registration of the WM skeleton, and selecting voxels with high edge values (refer Fig. 2(e) & (f)) aids the refinement of boundaries between white matter, grey matter and cerebrospinal fluid. The values of α(ℋμ), α(ℋρ) and α(ρ) are initially high, but are progressively lowered to allow more voxels to participate in correspondence matching as registration progresses.
2.5. Registration Framework
For registration, the cost function employed in SPHERE is:
| (14) |
Matching
Voxel at xT and voxel at xS are deemed as a matching pair if they are close spatially and if their feature vectors show high similarity. Naturally, a voxel pair xT and xS satisfying these conditions will be given a higher probability value p(xT, xS) in the cost function. We also enforce a symmetric matching mechanism (Christensen, 1999) which avoids bias toward the template or the subject image. The component cost functions are thus:
| (15) |
where PT = {pT(xT, xS)} and PS = {pS(xT, xS)}. 𝒱T and 𝒱S represent the template and subject brain domains, respectively.
Soft Correspondence
Soft correspondence are permitted in the initial stages of the registration so that the cost function is smooth and better behaved. Toward the end of the registration, more exact one-to-one correspondence is enforced. This is realized by component cost functions:
| (16) |
Parameter γ controls the degree of fuzziness of matching. It has initially high values, encouraging fuzzy matching, and later progressively lower values, which enforce exact matching.
Transformation Regularization
Mapping f is required to be smooth for preserving a biological sensible topology. This is enforced by the component cost function: E(f) = β‖ℒf‖2. ℒ is an operator which aids in measuring the bending energy. β is a weighting factor which is decreased throughout the registration to allow f to model deformation of increasing complexity.
Optimization
The (14) can be minimized by alternating between correspondence matching and dense transformation estimation (Yap et al., 2009, 2010). We first fix f and solve for PT and PS by letting ∂C(PT, PS, f)/∂pT(xT, xS) = 0 and ∂C(PT, PS, f)/∂pS(xT, xS) = 0. We then fix PT and PS, and solve for f using Thin-Plate Splines (TPS) (Bookstein, 1989; Chui and Rangarajan, 2003).
Retransformation
We approximate the ODF with a set of weighted PSFs and for a local transform F, we tilt the PSF directions individually by g′ = Fg/‖Fg‖ (see Fig. 3), and compute a new set of SH coefficients . Refer to (Raffelt et al., 2009) for more details.
2.6. Implementation Issues
2.6.1. Simplification of the Optimization Problem
Early and principled rejection of overly weak matches, i.e., outliers, can help reduce the computation time by passing over points that could not possibly match. This is realized by setting (prior to normalization) pT(xT, xS) or pS(xT, xS) values which fall below a predefined threshold to zero. A small value for pT(xT, xS) or pS(xT, xS) implies two things: 1) The points in consideration are too far apart, and 2) There is a structural mismatch between them. The above observations allow us to reduce the computation cost significantly. Firstly, for each voxel, similarity comparison can be limited to a small local region since the influence of candidate voxels is decaying exponentially with distance, and overly far voxels can be excluded from consideration. Secondly, voxels with similarity below a certain threshold can also be left out. This implies less voxels need to be considered when estimating the transformation, which is crucial to keep the matrix inversion and distance computation steps involved in estimating the TPS parameters computationally tractable.
2.6.2. Multiscale Implementation
We also note here that the registration is performed in a multiscale fashion, where the image is first downsampled to lower dimensions to estimate a coarse transformation for use in higher dimensions. This ensures that the transformation is robust to image noise and at the same time helps reduce the computation cost. Progressively building up the transformation from a coarser level avoids having to compute everything in the finest level. In our implementation we use three different levels of granularity: quarter and half dimensions, and also the original dimensions.
2.6.3. Maximum Order for Spherical Harmonics
Unless otherwise mentioned, SPHERE by default utilizes SHs up to the fourth order. This is a good compromise between registration accuracy and computation time. We show in Section 3.4.7 that by increasing the maximum order to 6, improved performance can be obtained. However, beyond this point, we observe degradation in performance.
2.7. Summary: SPHERE
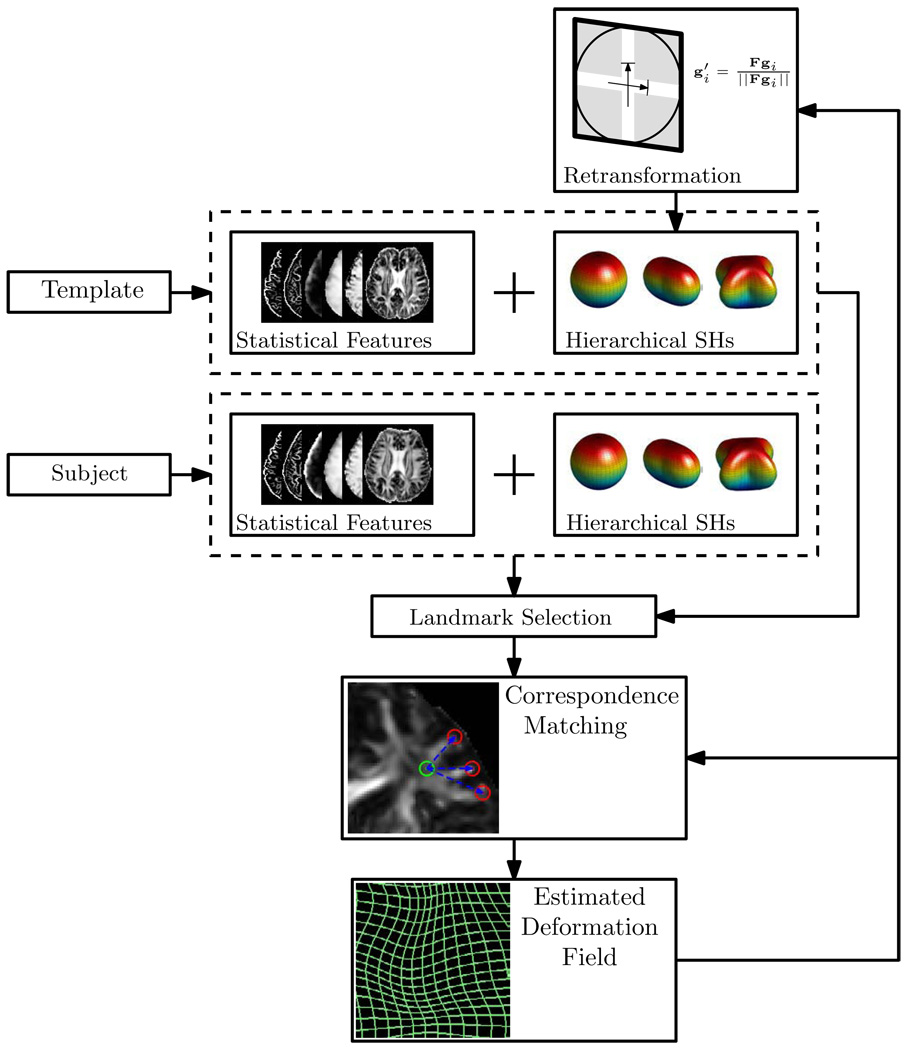
A schematic summary of SPHERE is given in Fig. 4, with details summarized below:
Affine Registration: Linearly register the subject volume to the template via FLIRT (Jenkinson and Smith, 2001) with the help of the anisotropy maps (see Fig. 2(b)). Retransform the ODFs.
Computation of Statistical Features: Compute the statistical maps (see Fig. 2).
Computation of Spherical Harmonic Coefficients: Compute the SH coefficients hierarchically according to the stage the registration is in. In earlier stages, use lower order SHs. In later stages, use higher order SHs to refine orientation alignment.
Landmark Selection: Select voxels at boundaries or with high anisotropy values as landmarks for registration guidance.
Correspondence Matching: Carry out template-subject-consistent soft-correspondence matching.
Retransformation and Re-Estimation of Spherical Harmonic Coefficients: Based on the estimated deformation field, retransform the ODF and re-estimate the SH coefficients.
Figure 4.
Schematic summary of SPHERE. The main components involve feature extraction (statistical and SH based features), landmark selection, forward-backward-consistent soft-correspondence matching and retransformation.
3. Experimental Results
We evaluated the performance of SPHERE using a number of experiments. We first present qualitative results by giving visual evidence of the effectiveness of SPHERE. We then move on to quantitative analysis by providing statistics relevant to the evaluation of registration accuracy.
3.1. Materials
Diffusion-weighted images were acquired for 14 adult subjects using a Siemens 3T TIM Trio MR Scanner with an EPI sequence. Diffusion gradients were applied in 120 non-collinear directions with diffusion weighting b = 2000s/mm2, flip angle = 90°, repetition time (TR) = 12,400ms and echo time (TE) = 116ms. The imaging matrix was 128 × 128 with a rectangular FOV of 256 × 256mm2. 80 contiguous slices with a slice thickness of 2mm covered the whole brain. Data post-processing includes brain skull removal, motion correction and eddy current correction using algorithms developed and distributed as part of the FMRIB Software Library (FSL) package (Smith et al., 2004). T1-weighted structural images were also collected for ROI propagation in the fiber tracking experiment.
3.2. Affine Registration as Initialization
FLIRT (Jenkinson and Smith, 2001), available as part of the FSL package (Smith et al., 2004), is a robust and accurate automated linear registration tool based on a multi-start, multi-resolution global optimization method. It can be run with a number of different transformation models (degrees of freedom) and with a number of different cost functions. In our experiments, we used a least-squares cost function and computed a 12 parameter affine transformation matrix. We ran this algorithm on the histogram-matched anisotropy maps (see Fig. 2(b)) computed from the diffusion-weighted images. Limiting the search angles in the xy, xz and yz planes to [−10°, 10°], we found that satisfactory initial linear registration could be achieved.
3.3. Deformable DTI Registration
F-TIMER (Yap et al., 2009, 2010) is a deformation DTI registration algorithm which leverages tensor regional and edge information as anatomical signatures for guidance of registration. It has been shown that F-TIMER (Yap et al., 2009) gives better registration accuracy than DTI-TK (Zhang et al., 2006) and DTI-DROID (Yang et al., 2008; Ingalhalikar et al., 2010). The fact that F-TIMER shares a similar deformation mechanism with SPHERE makes it an ideal comparison baseline to gauge whether the hierarchical SH based representation scheme used in SPHERE is effective for HARDI registration. We reconstructed from the diffusion-weighted images in the dataset the tensor fields, which we then utilized to estimate the deformation fields using F-TIMER. We note that, to date, most comparison of HARDI registration algorithms were performed with respect to some forms of affine registration (Geng et al., 2009; Bloy and Verma, 2010; Barmpoutis et al., 2007). We performed in our experiment a more stringent evaluation by making comparison with DTI-based deformable registration.
3.4. Evaluation
In what follows, we present results from a number of experiments designed to validate the performance of SPHERE in different settings.
3.4.1. Average Images
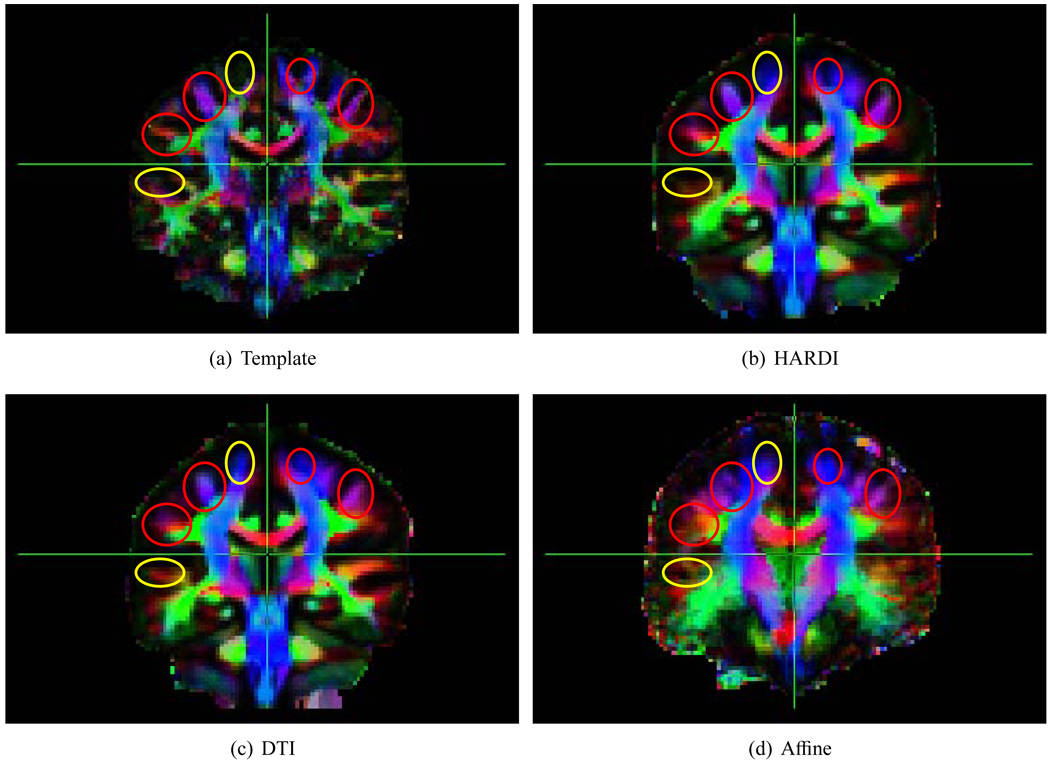
Averaging the images aligned by the different algorithms give us a direct and intuitive means of inspecting registration accuracy. A sharper image indicates better registration accuracy, while a fuzzy image indicates structural misalignment. Fig. 5 shows the average images produced by SPHERE, F-TIMER and FLIRT by registering the images onto a randomly selected template. Overall, SPHERE gives a sharper average image. The regions circled in red show visible improvement given by SPHERE. The regions circled in yellow are the ‘false positive’ regions in which the average image generated by F-TIMER shows structures where the template does not. Notice that the improvement is most prominent in the cortical regions, which is the Achilles’ heel of most registration algorithms.
Figure 5.
Average images for visual inspection of registration accuracy. HARDI registration using SPHERE generally shows greater sharpness. Regions circled in red show visible improvement given by SPHERE. Regions circled in yellow show the areas where the template does not show structures in contrast to DTI-based registration. To obtain these images, the tensor fields constructed from the diffusion weighted images were warped (Xu et al., 2003) using the estimated deformation fields to the common space, where they were then averaged. The colored Fractional Anisotropy (FA) maps were generated using the averaged tensor fields.
3.4.2. Orientational Discrepancy
The local maxima of an ODF reflect local fiber directions. In our case, the directions were computed with Camino (Cook et al., 2006) by locating the peaks of the ODFs using Powell’s algorithm on a set of sample points generated by randomly rotating a unit icosahedron 1000 times. Assuming that GT(x) is the set of directions given by the ODF local maxima of a template voxel at location x and GS(x) is the set of directions of a corresponding voxel in an aligned subject, Orientational Discrepancy (OD) is defined as:
| (17) |
where gives the angle difference between , i.e.:
| (18) |
The absolute value is taken since diffusion is assumed to be antipodal symmetric. In cases of multiple local maxima, the term
returns the angle difference between with a direction in GS that is most closely aligned with itself. The term
measures the maximum angle discrepancy between a pair of ODFs as seen from the point of view of the template voxel. To ensure consistency, equation (17) measures the angle discrepancy symmetrically by taking into account measurements from both the points of view of the template and the subject voxels.
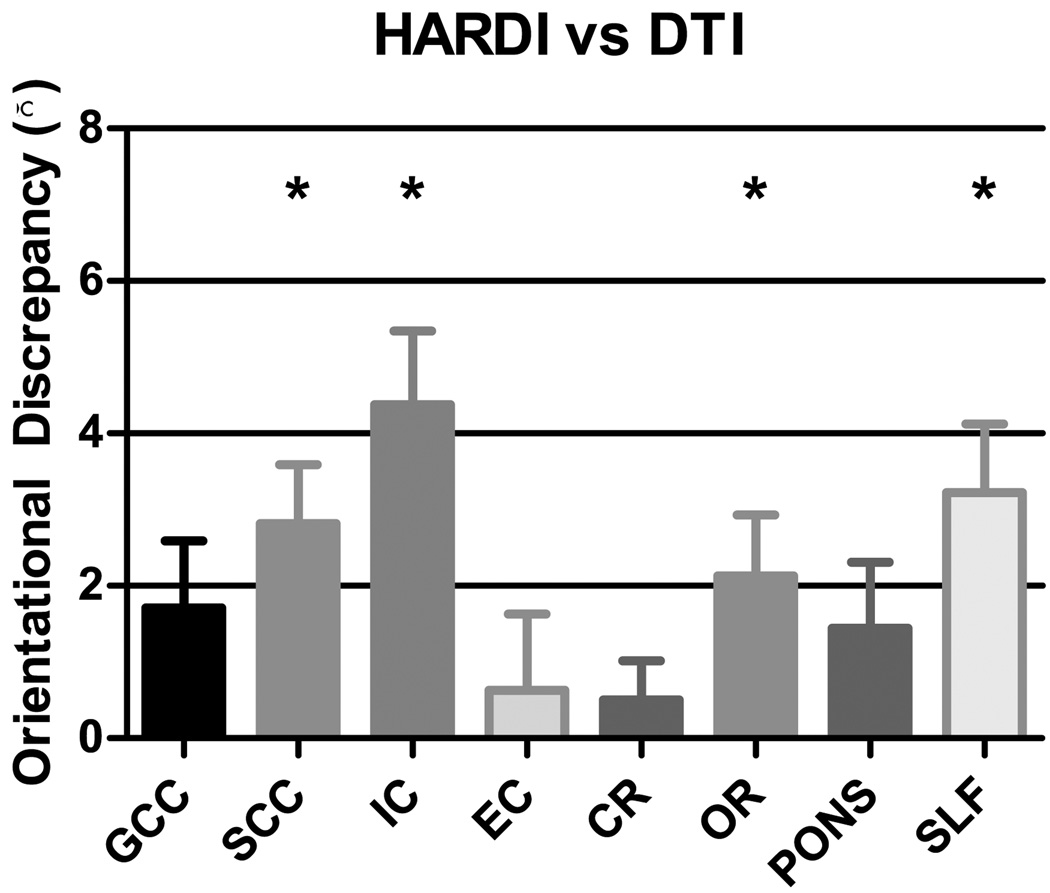
OD values were computed only for voxels requiring second or fourth order representation, since voxels requiring only zeroth representation are essentially non-directional. We locate these voxels by employing the method described in (Alexander et al., 2002), where ANOVA was used to determine whether truncating the SH series at a higher order as opposed to a lower order significantly changes the fit to the data. In Fig. 6, we show the average improvement in terms of OD reduction yielded by SPHERE for the regions (see Table 1) that have been shown in (Alexander et al., 2001a, 2002) (except the genu and splenium of corpus callosum and the external capsule) to be traversed by crossing fibers. Compared with DTI-based registration (Fig. 6), SPHERE yields improvement of fiber pathway alignment in all regions. Note that, the cumulative effect of a fraction of degree of error is detrimental for tractography algorithms which are greedy in nature, and can result in incorrect fiber trajectories (Zalesky, 2008).
Figure 6.
Orientational discrepancy reduction for the individual regions (see Table 1) gained by SPHERE over DTI-based registration. Each bar indicates the mean OD reduction (ODDTI − ODHARDI) for each region, and the error bar indicates the corresponding standard error. The asterisks indicate statistically significant differences, determined using paired t-tests with p = 0.05. All regions, except GCC, SCC and EC, were found in previous studies (Alexander et al., 2001a, 2002) to be traversed by crossing fibers.
Table 1.
ROIs for Evaluating Orientational Discrepancy
| Abbreviation | Description |
|---|---|
| GCC | Genu of Corpus Callosum |
| SCC | Splenium of Corpus Callosum |
| IC | Internal Capsule |
| EC | External Capsule |
| CR | Corona Radiata |
| OR | Optic Radiation |
| PONS | Pons |
| SLF | Superior Longitudinal Fasciculus |
3.4.3. Fiber Alignment
For evaluation of fiber alignment accuracy, we performed tractography on the images with the help of Camino (Cook et al., 2006). The ODF of each voxel was computed using the method described in (Hess et al., 2006), and possible fiber directions given by each voxel was determined by using Powell’s algorithm to locate the ODF local maxima. A whole brain streamline tractography was then performed for each image using voxels with FA ≥ 0.25 as seeding points. The stopping FA value was set at 0.1. The maximum allowed turning angle was 70°, and the number of directions for each ODF was limited to two. Fibers shorter than 20mm or longer than 200mm were discarded.
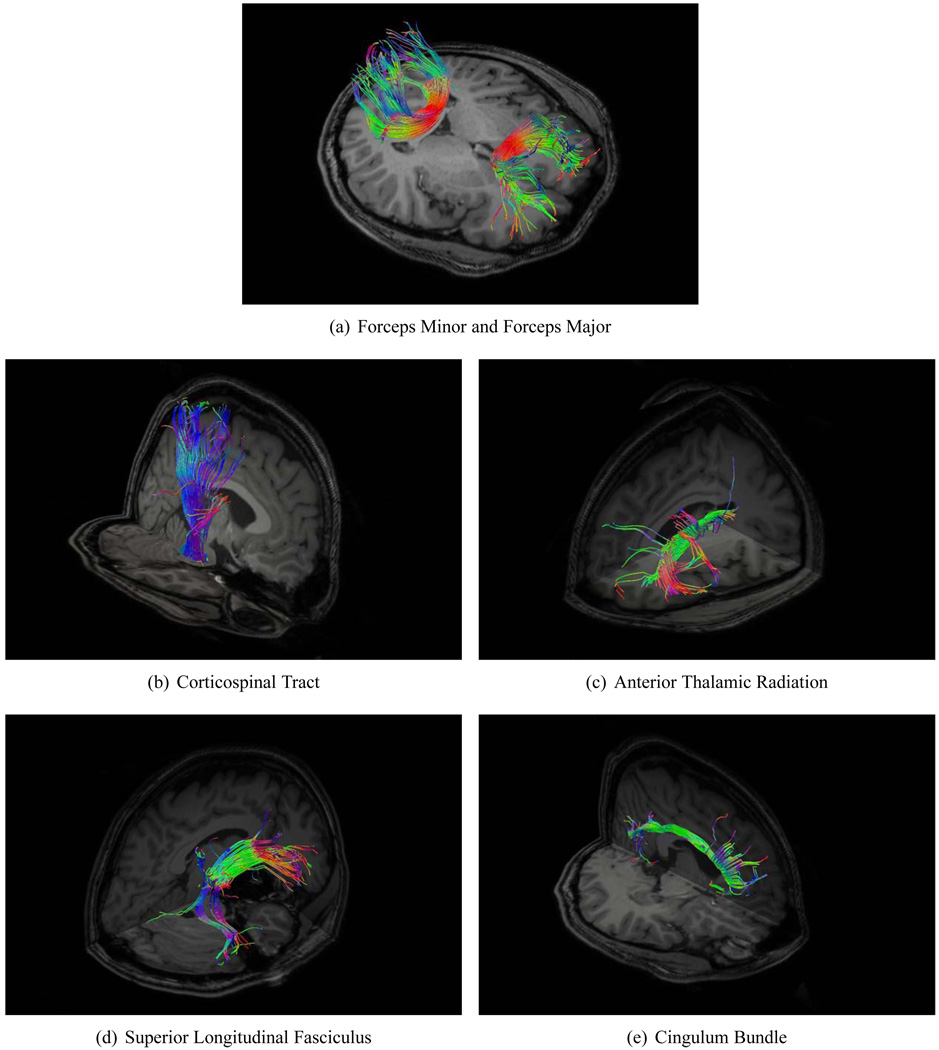
We carefully selected a set of WM tracts that were readily identifiable and highly reproducible (Wakana et al., 2007). Two ROIs (Mori et al., 2002; Wakana et al., 2007) were placed with the help of ITK-SNAP (Yushkevich et al., 2006) in different regions of the template brain image for extraction of each fiber bundle. These ROIs were then propagated to the other images with the help of deformation fields estimated using HAMMER (Shen and Davatzikos, 2002), which was applied on the coregistered T1-weighted image of each subject. For comparison of alignment accuracy, corresponding fiber bundles extracted in the subject space were spatially warped to the template space by deformation fields estimated using the diffusion-weighted images. For a comprehensive evaluation, we extracted a wide variety of fiber bundles which belong to different categories (Wakana et al., 2004): 1) Callosal fibers, 2) Projection fibers, 3) Association fibers, and 4) Limbic system fibers. The specific fiber bundles are listed in Table 2. Visual illustration of some of the extracted fiber bundles is given in Fig. 7.
Table 2.
Fiber Bundles Employed for Evaluation of Registration Accuracy
| Category | Abbreviation | Description |
|---|---|---|
| Callosal | Fminor | Forceps Minor |
| Fmajor | Forceps Major | |
| Projection | CST-R | Corticospinal Tract (Right) |
| CST-L | Corticospinal Tract (Left) | |
| ATR-R | Anterior Thalamic Radiation (Right) | |
| ATR-L | Anterior Thalamic Radiation (Left) | |
| PTR-R | Posterior Thalamic Radiation (Right) | |
| PTR-L | Posterior Thalamic Radiation (Left) | |
| Association | IFO-R | Inferior Fronto-Occipital Fasciculus (Right) |
| IFO-L | Inferior Fronto-Occipital Fasciculus (Left) | |
| SLF-R | Superior Longitudinal Fasciculus (Right) | |
| SLF-L | Superior Longitudinal Fasciculus (Left) | |
| ILF-R | Inferior Longitudinal Fasciculus (Right) | |
| ILF-L | Inferior Longitudinal Fasciculus (Left) | |
| UNC-R | Uncinate Fasciculus (Right) | |
| UNC-L | Uncinate Fasciculus (Left) | |
| Limbic System | CB-R | Cingulum Bundle (Right) |
| CB-L | Cingulum Bundle (Left) |
Figure 7.
Fiber bundles employed for evaluation of registration accuracy. The fibers bundles were extracted using a multi ROI approach described in (Mori et al., 2002; Wakana et al., 2007). The fibers are color coded with red representing the left-right direction, green representing the anterior-posterior direction, and blue representing the superior-inferior direction. Table 2 shows the full list of fiber bundles.
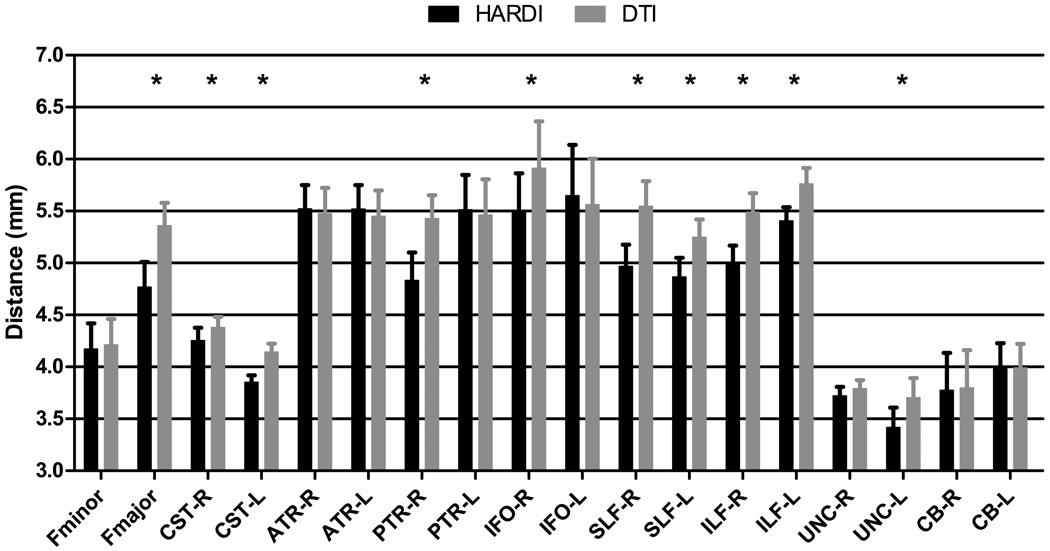
We gauged the effectiveness of the registration algorithms by comparing the adjacency of the aligned fiber bundles. The distance between two fiber bundles ℱ and 𝒢 was measured in a way similar to that used in (Zhang et al., 2006). The distance measure is defined as:
| (19) |
where d(Fi, Gj) is a pairwise distance between fibers Fi ∈ ℱ and Gi ∈ 𝒢, which in our case, is defined as the mean of the closest distances calculated for all points on fiber Fi to fiber Gi (Gerig et al., 2004). This measure approximately establishes anatomic correspondences between points along fibers of different subjects. When two fiber bundles are perfectly aligned, the value returned is zero. The results, shown in Fig 8, indicate that SPHERE generally yields lower fiber distances, implying more accurate alignment of the fascicles.
Figure 8.
Fiber alignment comparison. Each bar indicates the mean fiber bundle distance, and the error bar indicates the corresponding standard error. The asterisks indicate statistically significant differences, determined using paired t-tests with p = 0.05.
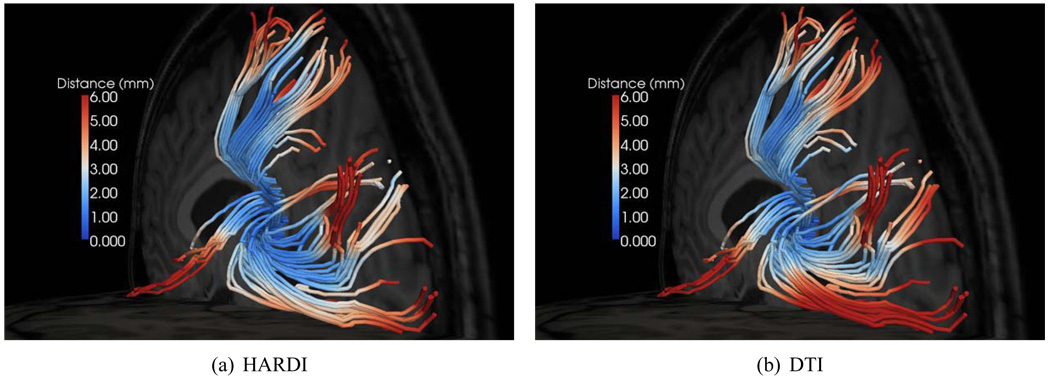
For better visualization of the variation of fiber distances, we computed, for each point on a fiber bundle extracted in the template, the average of the shortest distances to the fiber bundles tracked in the individual subjects. Specifically, for each point on a template fiber, we located a corresponding closest point (based on Euclidean distance) on a subject fiber among the bundle, and noted the respective distance. The average distance values, computed across subjects, were finally reported. The results, shown in Fig. 9, indicates that larger misalignment generally occurs for points nearer to the cortical region, which is not surprising since cortical structures generally exhibit larger variability.
Figure 9.
Spatial distribution of fiber alignment errors. Anything above 6mm is represented by dark red. A greater fraction of dark-blue points and a smaller fraction of dark-red points are indicative of better fiber alignment.
3.4.4. Label Transfer
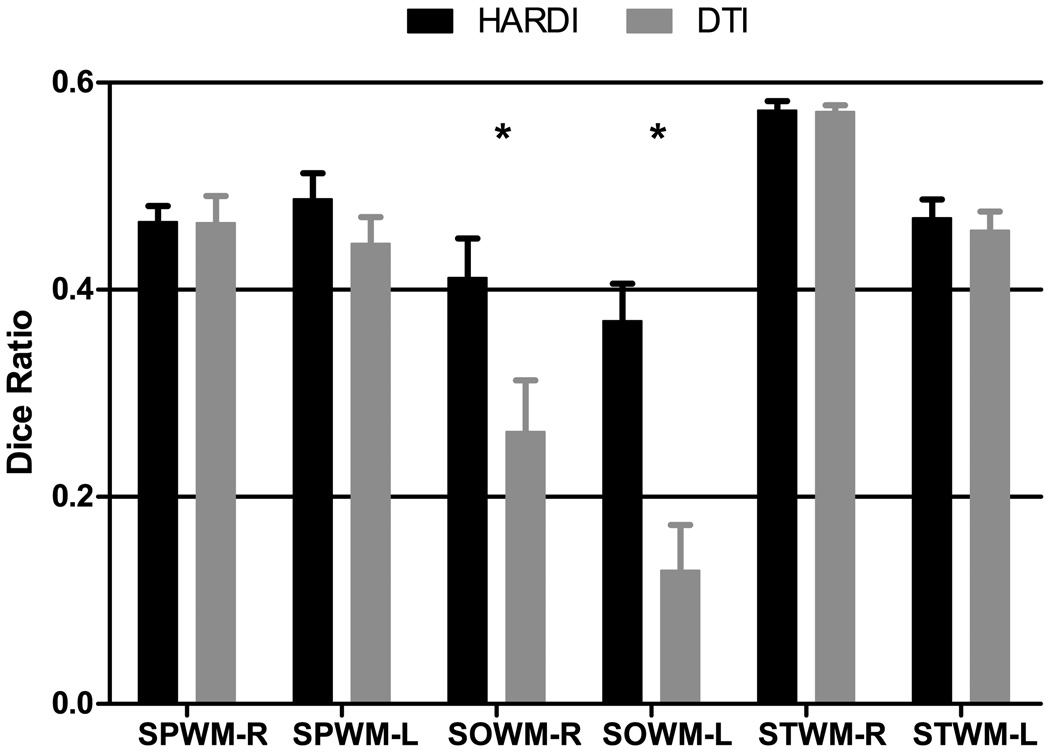
By labeling common brain structures in individual images and then warping the labels to the template space, we can compare the effectiveness of various algorithms in aligning brain structures (Klein et al., 2009). We labeled several WM cortical structures by following closely the atlas generated in (Oishi et al., 2009). The WM structures were selected from the cortical regions where registration algorithms are often known to have problem aligning: the right and left superior parietal WM (SPWM-R and SPWM-L) and, superior occipital WM (SOWM-R and SOWM-L) and superior temporal WM (STWM-R and STWM-L). Warping the labels to the template space and computing the degree of overlap of the warped labels with the template labels using the Dice ratio (Dice, 1945), we observe (Fig. 10) that bigger WM structures such as the SPWM and STWM can be aligned comparably well with both SPHERE and F-TIMER. But for smaller WM structures such as the SOWM, SPHERE clearly shows superior performance.
Figure 10.
Evaluation via label transfer. Each bar indicates the mean DICE ratio for each label, and the error bar indicates the corresponding standard error. The asterisks indicate statistically significant differences, determined using paired t-tests with p = 0.05. (SPWM: Superior Parietal WM, SOWM: Superior Occipital WM, STWM: Superior Temporal WM)
3.4.5. Synthetic Data
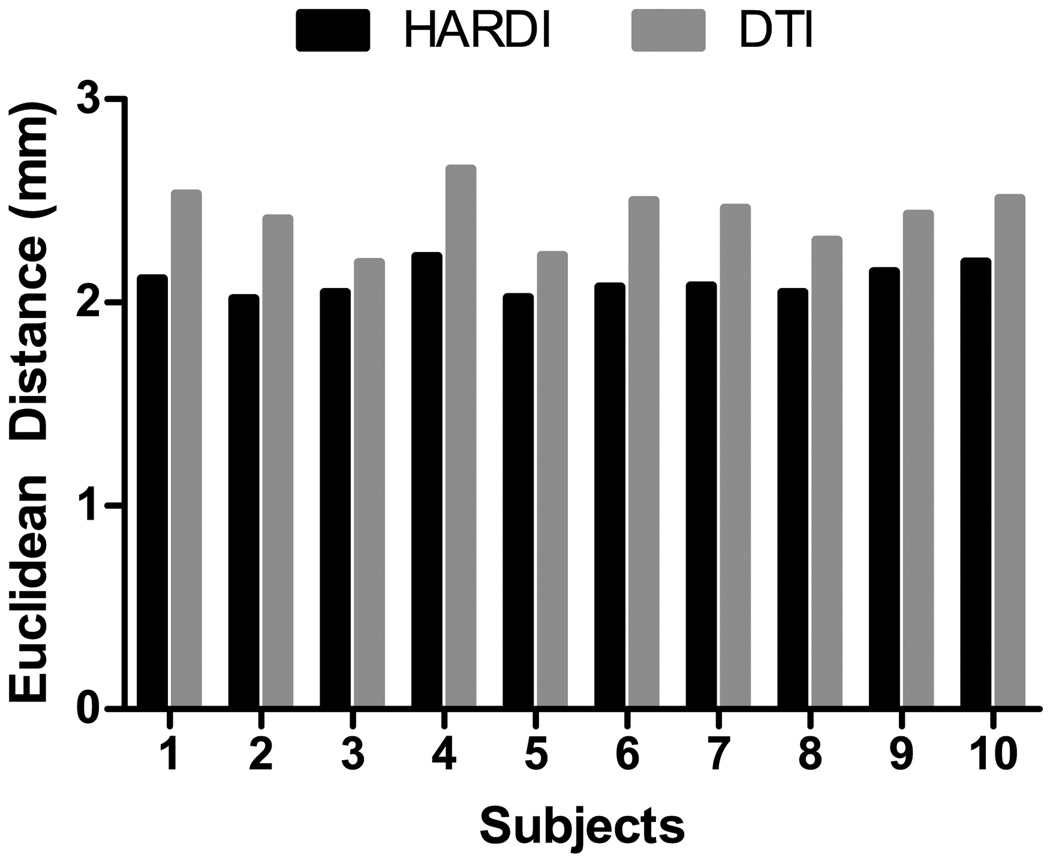
Evaluation up to this point has been based on real image data. We complement this with a set of synthetic HARDI images with known ground truth. To ensure that the generated images are realistic, we registered, using HAMMER (Shen and Davatzikos, 2002), 10 T1-weighted images to the template T1-weighted images. A set of HARDI images were then generated by warping the template HARDI image using the deformation fields estimated by HAMMER. Taking these deformation fields as the ground truth, we evaluated the registration accuracy of SPHERE by comparing its estimated deformation fields with the former. The voxel-average Euclidean distance between a pair of deformation fields was computed as a measure of how closely the deformation fields estimated by SPHERE resemble the ground truth. The results, shown in Fig. 11, indicate that the deformation fields estimated by SPHERE are closer to the ground truth when compared with DTI-based registration. Performing a paired t-test, we found that the difference is statistically significant at p = 2.76 × 10⁻⁶.
Figure 11.
Evaluation based on synthetic data. The estimated deformation fields were compared with the ground truth via computing the Euclidean distance.
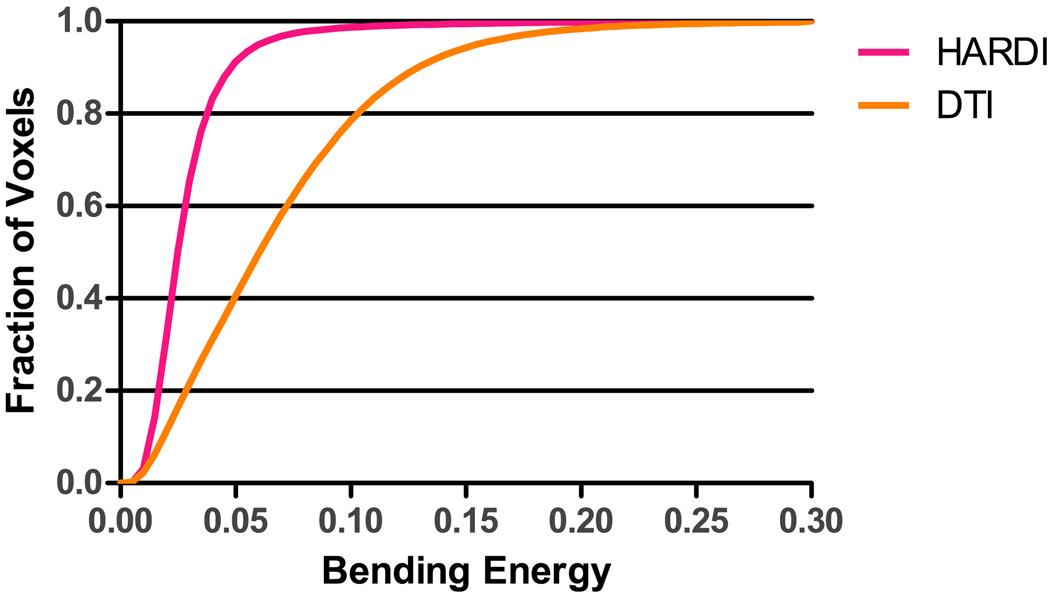
3.4.6. Bending Energy
A registration algorithm might lead to very good voxel-wise similarity by compromising deformation smoothness. A more relaxed regularization of the estimated deformation field implies a higher probability of breaking the topology. To ensure that this is not the case with SPHERE, we measured the bending energy, defined as:
| (20) |
of the deformation fields estimated by SPHERE and F-TIMER. We observe that SPHERE gives a lower (paired t-test, p = 1.17 × 10⁻¹⁴) average bending energy of 0.0344 compared to 0.0772 given by DTI-based registration. It can also be observed from the bending energy distribution, shown in Fig. 12, that SPHERE gives a distribution with a higher fraction of low bending energy values. This indicates that, for achieving better registration results, we have not sacrificed the smoothness of the estimated deformation field.
Figure 12.
Bending energy cumulative distribution. SPHERE gives a larger fraction of voxels with smaller bending energy values.
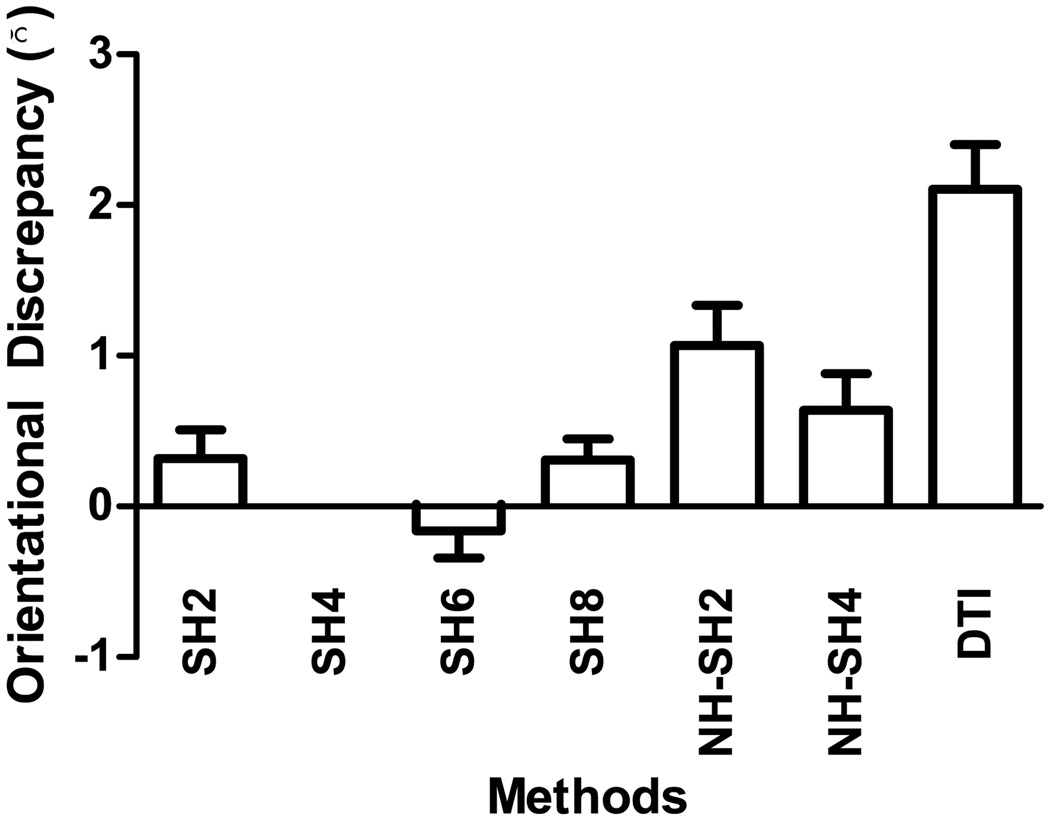
3.4.7. Comparison with Various Configurations
To study the effect of different parameters, we tested various configurations of SPHERE to see how the registration accuracy is affected. SPHERE was tested for SHs up to the second, sixth and eighth orders (SH2, SH6 and SH8). Also tested was the non-hierarchical utilization of SHs up to the second and fourth order (NH-SH2 and NH-SH4). For accuracy evaluation, we employed the OD measure used in Section 3.4.2. For each subject, the OD values were averaged across all regions listed in Table 1. The OD values given by each method was measured relative to SPHERE utilizing the default parameters (i.e., SH4). A positive bar in Fig. 13 indicates that SH4 gives better registration accuracy, whereas a negative bar indicates otherwise. It can be observed that registration accuracy continues to increase when SHs up to the sixth order are used, but starts to decrease beyond this point. It is also clear that the hierarchical scheme helps improve registration accuracy.
Figure 13.
Registration accuracy for different configurations. Each bar indicates the mean OD reduction given by SPHERE with respect to each of the method considered (ODMethod − ODSH4), and the error bar indicates the corresponding standard error. A positive value indicates that SPHERE (using SHs up to the fourth order) gives better registration accuracy with respect to the method in consideration; a negative value indicates otherwise.
4. Discussion
The key idea of SPHERE involves using lower order SHs to extract coarse, relatively orientation invariant information, for obtaining a robust estimate of the global deformation and progressively turn to higher order representation for more localized refinement of fiber pathway orientations. We note that SPHERE also incorporates additional features such as regional distribution information for more robust matching and edge information for better alignment of tissue boundaries. This allows SPHERE to perform matching based on contextual information which better represents structures in contrast to voxel-wise intensity matching.
We compared SPHERE with DTI registration using F-TIMER (Yap et al., 2010, 2009). Visual inspection, voxel-based WM orientational discrepancy measurement, fiber tractography based evaluation, label transfer based evaluation, synthetic data based evaluation and bending energy based evaluation led us to conclude that SPHERE is capable of registering HARDI data with higher accuracy.
The hierarchical strategy employed by SPHERE helps reduce computation time while at the same time maintain high registration accuracy. When compared with non-hierarchical SH based registration (discussed in Section 3.4.7), SPHERE affords a few-fold speed up in computation time. Specifically, the current implementation of SPHERE requires approximately 1 hour for completing the registration of a pair of images. This is a significant improvement compared with the non-hierarchical version (NH-SH4), which requires approximately 3 hours.
Future extension of the current work entails harnessing structural information obtained from T1-weighted image for more precise alignment. Recently, Zollëi et al. (Zöllei et al., 2010) has highlighted the importance of using anatomical information for initializing the registration of fiber tracts. In future, we intend to extend our algorithm to incorporate anatomical information from structural scans. This is motivated by the fact that the location of the tracts and the surrounding anatomy is consistent across subjects (Zöllei et al., 2010). Anatomical information can also help alleviate the image geometric distortion problem stemming from the intrinsic magnetic field inhomogeneities in B0 that are particularly large near air/tissue and bone/tissue boundaries (Jenkinson and Smith, 2001). Moreover, anatomical images are typically an order of magnitude finer than DWI in terms of voxel resolution, making precise registration easier to achieve.
5. Conclusion
We have presented a HARDI registration algorithm which is based on careful extraction of orientation information from diffusion-weighted images. Using spherical harmonics of increasing orders, the proposed method allows progressively accruing orientation information to be used in refining the registration. This essentially allows one to harness the best of both worlds — the robustness of lower order representations and the specificity of higher order representations. HARDI registration is an important step forward from approaches based on scalar images or diffusion tensors, since HARDI provides significantly more information which enables one to probe into the complex tissue micro-architecture. This work makes possible the comparison of diffusion-weighted information between subjects, between groups, or between images of the same subject acquired at different time-points.
Acknowledgment
This work was supported in part by grants EB006733, EB008374, EB009634, and MH088520.
Footnotes
Publisher's Disclaimer: This is a PDF file of an unedited manuscript that has been accepted for publication. As a service to our customers we are providing this early version of the manuscript. The manuscript will undergo copyediting, typesetting, and review of the resulting proof before it is published in its final citable form. Please note that during the production process errors may be discovered which could affect the content, and all legal disclaimers that apply to the journal pertain.
Contributor Information
Pew-Thian Yap, Email: ptyap@med.unc.edu.
Yasheng Chen, Email: yasheng chen@med.unc.edu.
Hongyu An, Email: hongyu an@med.unc.edu.
Yang Yang, Email: yyang@unc.edu.
John H. Gilmore, Email: jgilmore@med.unc.edu.
Weili Lin, Email: weili_lin@med.unc.edu.
Dinggang Shen, Email: dgshen@med.unc.edu.
References
- Alexander AL, Hasan KM, Lazar M, Tsuruda JS, Parker DL. Analysis of partial volume effects in diffusion-tensor mri. Magnetic Resonance in Medicine. 2001a;45:770–780. doi: 10.1002/mrm.1105. [DOI] [PubMed] [Google Scholar]
- Alexander D, Barker G, Arridge S. Detection and modeling of non-Gaussian apparent diffusion coefficient profiles in human brain data. Magnetic Resonance in Medicine. 2002;48:331–340. doi: 10.1002/mrm.10209. [DOI] [PubMed] [Google Scholar]
- Alexander DC. Visualization and Processing of Tensor Fields. Springer Berlin Heidelberg, Ch. An Introduction to Computational Diffusion MRI: the Diffusion Tensor and Beyond. 2006:83–106. [Google Scholar]
- Alexander DC, Pierpaoli C, Basser PJ, Gee JC. Spatial transformations of diffusion tensor magnetic resonance images. IEEE Transactions on Medical Imaging. 2001b;20(11):1131–1139. doi: 10.1109/42.963816. [DOI] [PubMed] [Google Scholar]
- Barmpoutis A, Hwang MS, Howland D, Forder JR, Vemuri BC. Regularized positive-definite fourth order tensor field estimation from DW-MRI. NeuroImage. 2009;45:S153–S162. doi: 10.1016/j.neuroimage.2008.10.056. [DOI] [PMC free article] [PubMed] [Google Scholar]
- Barmpoutis A, Vemuri BC, Forder JR. MICCAI. Vol. LNCS 4791. 2007. Registration of high angular resolution diffusion MRI images using 4th order tensors; pp. 908–915. [DOI] [PMC free article] [PubMed] [Google Scholar]
- Behrens T, Berg HJ, MFS J, Rushworth, Woolricha M. Probabilistic diffusion tractography with multiple fibre orientations: What can we gain? NeuroImage. 2007;34:144–155. doi: 10.1016/j.neuroimage.2006.09.018. [DOI] [PMC free article] [PubMed] [Google Scholar]
- Bloy L, Verma R. Demons registration of high angular resolution diffusion images; Proceedings of IEEE International Symposium on Biomedical Imaging (ISBI’10); 2010. pp. 1013–1016. [Google Scholar]
- Bookstein FL. Principal warps: Thin-plate splines and the decomposition of deformations. IEEE Transactions on Pattern Analysis and Machine Intelligence. 1989 June;11(6):567–585. [Google Scholar]
- Cheng G, Vemuri BC, Carney PR, Mareci TH. MICCAI. Vol. LNCS 5761. 2009. Non-rigid registration of high angular resolution diffusion images represented by Gaussian mixture fields; pp. 190–197. [DOI] [PMC free article] [PubMed] [Google Scholar]
- Christensen GE. Information Processing in Medical Imaging. 1999. Consistent linear-elastic transformations for image matching; pp. 224–237. [Google Scholar]
- Chui H, Rangarajan A. A new point matching algorithm for non-rigid registration. Computer Vision and Image Understanding. 2003;89(2–3):114–141. [Google Scholar]
- Cook PA, Bai Y, Nedjati-Gilani S, Seunarine KK, Hall MG, Parker GJ, Alexander DC. Camino: Open-source diffusion-MRI reconstruction and processing. 14th Scientific Meeting of the International Society for Magnetic Resonance in Medicine; 2006. p. 2759. [Google Scholar]
- Descoteaux M, Angelino E, Fitzgibbons S, Deriche R. Regularized, fast, and robust analytical q-ball imaging. Magnetic Resonance in Medicine. 2007;58:497–510. doi: 10.1002/mrm.21277. [DOI] [PubMed] [Google Scholar]
- Dice LR. Measures of the amount of ecologic association between species. Ecology. 1945;26:297–302. [Google Scholar]
- Frank LR. Characterization of anisotropy in high angular resolution diffusion-weighted MRI. Magnetic Resonance in Medicine. 2002;47:1083–1099. doi: 10.1002/mrm.10156. [DOI] [PubMed] [Google Scholar]
- Geng X, Ross JT, Zhan W, Gu H, Chao Y-P, Lin C-P, Christensen GE, Schuff N, Yang Y. IPMI. Vol. LNCS 5636. 2009. Diffusion MRI registration using orientation distribution functions; pp. 627–637. [DOI] [PMC free article] [PubMed] [Google Scholar]
- Gerig G, Gouttard S, Corouge I. Analysis of brain white matter via fiber tract modeling; Proceedings of the IEEE EMBS; 2004. pp. 4421–4424. [DOI] [PubMed] [Google Scholar]
- Hess CP, Mukherjee P, Han ET, Xu D, Vigneron DB. Q-ball reconstruction of multimodel fiber orientations using the spherical harmonic basis. Magnetic Resonance in Medicine. 2006;56:104–117. doi: 10.1002/mrm.20931. [DOI] [PubMed] [Google Scholar]
- Hong X, Arlinghaus L, Anderson A. Spatial normalization of the fiber orientation distribution based on high angular resolution diffusion imaging data. Magnetic Resonance in Medicine. 2009;61(6):1520–1527. doi: 10.1002/mrm.21916. [DOI] [PMC free article] [PubMed] [Google Scholar]
- Ingalhalikar M, Yang J, Davatzikos C, Verma R. DTI-DROID: Diffusion tensor imaging-deformable registration using orientation and intensity descriptors. International Journal of Imaging Systems and Technology. 2010;20:99–107. [Google Scholar]
- Jenkinson M, Smith S. A global optimisation method for robust affine registration of brain images. Medical Image Analysis. 2001;5(2):143–156. doi: 10.1016/s1361-8415(01)00036-6. [DOI] [PubMed] [Google Scholar]
- Klein A, Andersson J, Ardekani BA, Ashburner J, Avants B, Chiang M-C, Christensen GE, Collins DL, Gee J, Hellier P, Song JH, Jenkinson M, Lepage C, Rueckert D, Thompson P, Vercauteren T, Woods RP, Mann JJ, Parsey RV. Evaluation of 14 nonlinear deformation algorithms applied to human brain MRI registration. NeuroImage. 2009;46:786–802. doi: 10.1016/j.neuroimage.2008.12.037. [DOI] [PMC free article] [PubMed] [Google Scholar]
- Mori S, Kaufmann WE, Davatzikos C, Stieltjes B, Amodei L, Fredericksen K, Pearlson GD, Melhem ER, Solaiyappan M, Raymond GV, Moser HW, van Zijl PCM. Imaging cortical association tracts in the human brain using diffusion-tensor-based axonal tracking. Magnetic Resonance in Medicine. 2002;47:215–223. doi: 10.1002/mrm.10074. [DOI] [PubMed] [Google Scholar]
- Oishi K, Faria A, Jiang H, Li X, Akhter K, Zhang J, Hsu JT, Miller MI, van Zijl PC, Albert M, Lyketsos CG, Woods R, Toga AW, Pike GB, Rosa-Neto P, Evans A, Mazziotta J, Mori S. Atlas-based whole brain white matter analysis using large deformation diffeomorphic metric mapping: Application to normal elderly and alzheimer’s disease participants. NeuroImage. 2009;46:486–499. doi: 10.1016/j.neuroimage.2009.01.002. [DOI] [PMC free article] [PubMed] [Google Scholar]
- Raffelt D, Tournier J-D, Fripp J, Crozier S, Connelly A, Salvado O. Diffusion Modelling and the Fibre Cup, MICCAI. 2009. Non-linear spatial normalisation of high angular resolution diffusion imaging data using fiber orientation distributions. [Google Scholar]
- Shen D, Davatzikos C. HAMMER: Hierarchical attribute matching mechanism for elastic registration. IEEE Transactions on Medical Imaging. 2002;21(11):1421–1439. doi: 10.1109/TMI.2002.803111. [DOI] [PubMed] [Google Scholar]
- Smith S, Jenkinson M, Woolrich M, Beckmann C, Behrens T, Johansen-Berg H, Bannister P, Luca M, Drobnjak I, Flitney D, Niazy R, Saunders J, Vickers J, Zhang Y, Stefano N, Brady J, Matthews P. Advances in functional and structural MR image analysis and implementation as FSL. NeuroImage. 2004;23:208–219. doi: 10.1016/j.neuroimage.2004.07.051. [DOI] [PubMed] [Google Scholar]
- Tuch DS, Weisskoff RM, W BJ, J WV. ISMRM’1999. 1999. High angular resolution diffusion imaging of the human brain. [Google Scholar]
- Wakana S, Caprihan A, Panzenboeck MM, Fallon JH, Perry M, Gollub RL, Hua K, Zhang J, Jiang H, Dubey P, Blitz A, van Zijl P, Mori S. Reproducibility of quantitative tractography methods applied to cerebral white matter. NeuroImage. 2007;36:630–644. doi: 10.1016/j.neuroimage.2007.02.049. [DOI] [PMC free article] [PubMed] [Google Scholar]
- Wakana S, Jiang H, Nagae-Poetscher LM, van Zijl PCM, Mori S. Fiber tract-based atlas of human white matter anatomy. Radiology. 2004;230:77–87. doi: 10.1148/radiol.2301021640. [DOI] [PubMed] [Google Scholar]
- Xu D, Mori S, Shen D, van Zijl PCM, Davatzikos C. Spatial normalization of diffusion tensor fields. Magnetic Resonance in Medicine. 2003 July;50(1):175–182. doi: 10.1002/mrm.10489. [DOI] [PubMed] [Google Scholar]
- Yang J, Shen D, Davatzikos C, Verma R. MICCAI’08. Pt. 2. Vol. 11. 2008. Diffusion tensor image registration using tensor geometry and orientation features; pp. 905–913. [DOI] [PubMed] [Google Scholar]
- Yap P-T, Wu G, Zhu H, Lin W, Shen D. Fast Tensor Image Morphing for Elastic Registration. MICCAI 2009 LNCS. 2009;5761:721–729. doi: 10.1007/978-3-642-04268-3_89. [DOI] [PMC free article] [PubMed] [Google Scholar]
- Yap P-T, Wu G, Zhu H, Lin W, Shen D. F-TIMER: Fast Tensor Image Morphing for Elastic Registration. IEEE Transactions on Medical Imaging. 2010;29:1192–1203. doi: 10.1109/TMI.2010.2043680. [DOI] [PMC free article] [PubMed] [Google Scholar]
- Yushkevich P, Piven J, Cody H, Ho S, Gee J, Gerig G. User-guided level set segmentation of anatomical structures with itk-snap. IEEE Transactions on Medical Imaging. 2006;31:1116–1128. [Google Scholar]
- Zalesky A. DT-MRI fiber tracking: A shortest paths approach. IEEE Transactions on Medical Imaging. 2008;27(10):1458–1471. doi: 10.1109/TMI.2008.923644. [DOI] [PubMed] [Google Scholar]
- Zhang H, Yushkevich PA, Alexander DC, Gee JC. Deformable registration of diffusion tensor mr images with explicit orientation optimization. Medical Image Analysis. 2006;10(5):764–785. doi: 10.1016/j.media.2006.06.004. [DOI] [PubMed] [Google Scholar]
- Zöllei L, Stevens A, Huber K, Kakunoori S, Fischl B. Improved tractography alignment using combined volumetric and surface registration. NeuroImage. 2010;51(1):206–213. doi: 10.1016/j.neuroimage.2010.01.101. [DOI] [PMC free article] [PubMed] [Google Scholar]


