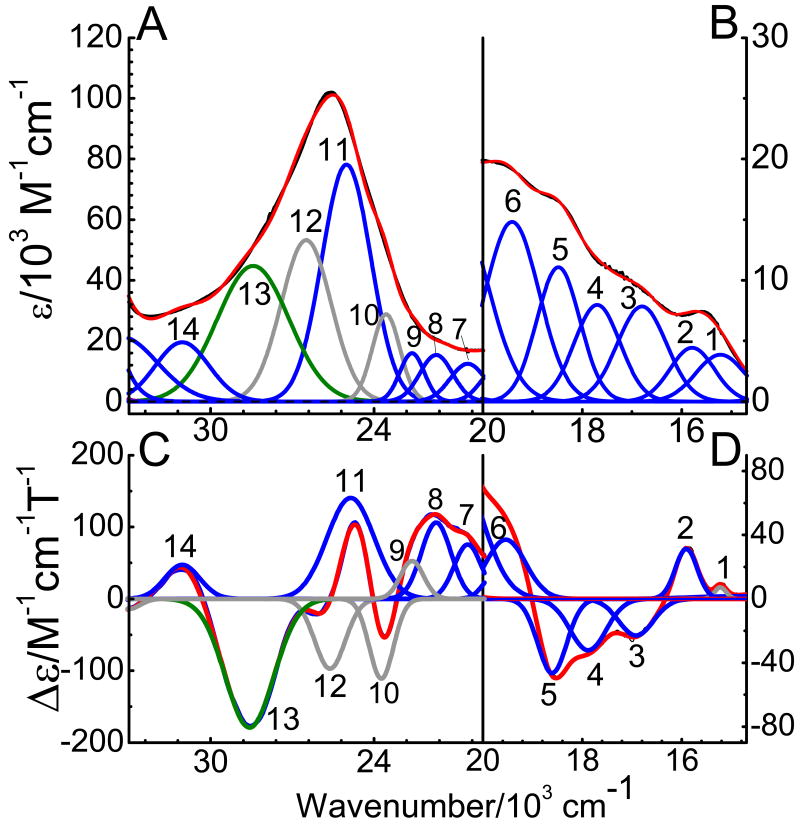
Figure 5.
Electronic spectra of ferric hs Q360P in 50 mM potassium phosphate buffer (pH 7.4) with 500 μM d-camphor. Top: UV-Vis absorption spectrum measured at room temperature. Bottom: MCD C-term spectrum measured at 5 K in phosphate buffer with 50 % (v/v) glycerol added. The colored lines represent a correlated Gaussian fit of these data (Table 2), where the predominant polarizations are color-coded (xy-polarizations in blue, z-polarizations in green, and undetermined polarizations in gray). The recorded spectra are red.

