Abstract
Summary: phangorn is a package for phylogenetic reconstruction and analysis in the R language. Previously it was only possible to estimate phylogenetic trees with distance methods in R. phangorn, now offers the possibility of reconstructing phylogenies with distance based methods, maximum parsimony or maximum likelihood (ML) and performing Hadamard conjugation. Extending the general ML framework, this package provides the possibility of estimating mixture and partition models. Furthermore, phangorn offers several functions for comparing trees, phylogenetic models or splits, simulating character data and performing congruence analyses.
Availability: phangorn can be obtained through the CRAN homepage http://cran.r-project.org/web/packages/phangorn/index.html. phangorn is licensed under GPL 2.
Contact: klaus.kschliep@snv.jussieu.fr
Supplementary information: Supplementary data are available at Bioinformatics online.
1 INTRODUCTION
With more than 20 packages devoted to phylogenetics, the R software (R Development Core Team, 2009) has become a standard in phylogenetic analysis (see http://cran.r-project.org/web/views/Phylogenetics.html for an overview). However so far it was only possible to estimate phylogenetic trees with distance methods in R. The phangorn package permits to estimate maximum likelihood (ML) and maximum parsimony (MP) trees. Besides reconstructing phylogenies, the package also focuses on assessing the congruence of different trees.
2 METHODS
The phangorn package interacts with several other R-packages, especially with the ape package (Paradis et al., 2004). From ape, phangorn inherits the tree format (class phylo which has become a standard), which allows use of the excellent plotting facilities within ape. phangorn defines its own data format to store character sequences, but offers functions to convert between formats from other packages (ape and seqinr) or with common data structures (data.frame and matrix) in R. The data format is kept very general allowing nucleotides (DNA, RNA), amino acids and general character states defined by the user. For example, it is easy to define a format for nucleotide data where gaps are coded as a fifth state or for binary data. All the different ML and MP functions described below can handle these general character states.
MP is an optimality criterion for which the preferred tree is the tree that requires the least changes to explain some data. In phangorn, the Fitch and Sankoff algorithms are available to compute the parsimony score. For heuristic tree searches the parsimony ratchet (Nixon, 1999) is implemented. Indices based on parsimony like the consistency and retention indices and the inference of ancestral sequences are also provided.
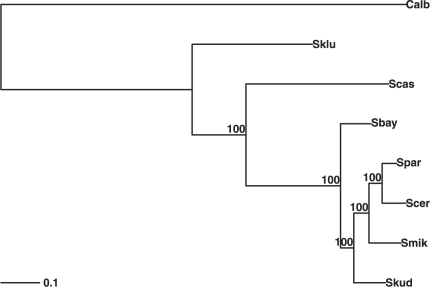
The ML function pml returns an object of class pml containing all the information about the model, the tree and data. The function optim.pml allows to optimize the tree topology, the edge lengths as well as all model parameters (e.g. rate matrices or base frequencies). The speed and accuracy of phylogenetic reconstruction by ML are comparable to PhyML (Guindon and Gascuel, 2003) using nearest neighbor interchange (NNI) rearrangements (see Supplementary Materials). As the results are stored in memory it is possible to further investigate, plot or summarize these objects. The following lines compute and display (Fig. 1) a phylogenetic tree based on the data of Rokas et al., 2003 using a GTR + Γ(4) + I model (Kelchner and Thomas, 2007):
Fig. 1.
phylogenetic tree with bootstrap support on the edges for the data of Rokas et al., 2003.
data(yeast)
tree <- NJ(dist.logDet(yeast))
fit <- pml(tree, yeast, k=4, inv= .2)
fit <- optim.pml(fit, optNni=TRUE,
optGamma=TRUE, optInv=TRUE, model=“GTR”)
BS <- bootstrap.pml (fit, optNni=TRUE)
plotBS(fit$tree, BS, type = “phylogram”)
For nucleotide data all models implemented in ModelTest (Posada, 2008) are available (e.g. “JC” or “GTR”). Moreover any reversible model can be specified by the user for different character states. For amino acids, the main common rate matrices are provided, e.g. WAG (Whelan and Goldman, 2001) or LG (Le and Gascuel, 2008). Additionally rate matrices can also be estimated. For instance Mathews et al., 2010 used the function optim.pml to infer a phytochrome amino acid transition matrix. There are several methods implemented to compare different ML models with for example likelihood ratio-tests, AIC or BIC as in ModelTest or the SH-test (Shimodaira and Hasegawa, 1999).
As phangorn is implemented in the high-level language R it is easy to extend the general ML framework. phangorn also contains mixture models (Pagel and Meade, 2004) and partition models. The function pmlPart allows estimation of partitioned ML models and has a flexible yet simple formula interface. For example, the command pmlPart(edge + Q ∼ rate + bf, fit) specifies which parameters are optimized in each partition individually (here the rate parameter and the base frequencies) or for all partitions together (the edge weights of the tree and rate matrix Q).
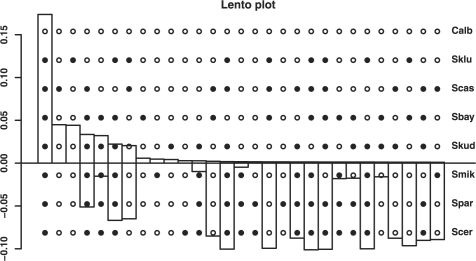
phangorn eases the analysis of splits. For instance, the Hadamard conjugation (Hendy, 2005) is a helpful tool to analyze relations between observed sequence patterns (spectra) and edge weights. The edge weight spectra can be constructed from DNA or binary data or from a distance matrix. These spectra can be visualized using a Lento plot (Lento et al., 1995) to present the supporting and conflicting signals for the splits of a dataset (Fig. 2). Splits can easily be exported to SpectroNet (Huber et al., 2002) or Splitsgraph (Huson and Bryant, 2006) and visualized as a network.
Fig. 2.
Lento plot of the edge weights from sequence spectrum for the data of Rokas et al., 2003. On the x-axis the splits or edges are represented by the dots overlying the graph. The bars above the axis indicate the edge weights or the support of a split, bars below represent the conflict with this split, i.e. the sum of the edge weights which are incompatible with this split.
phangorn is distributed with two tutorials. The first explains how to perform phylogenetic analysis (in R type vignette(“Trees”)) and the second vignette(“phangorn-specials”) shows how to define data with general character states and to estimate rate matrices for those states. phangorn depends only on other R packages which are also available from the CRAN repository and is portable to run on different operating systems. Since phangorn is written in R, results can be easily extended and further processed using the graphical and statistical capabilities of R.
3 CONCLUSION
phangorn offers a wide range of methods to reconstruct phylogenies, to compare phylogenetic trees, to test different phylogenetic models and perform split analysis to evaluate conflicting phylogenetic signal. Moreover the phangorn package provides a flexible framework for prototyping new phylogenetic methods.
Supplementary Material
ACKNOWLEDGEMENT
The author thanks Emmanuel Paradis, Eric Bapteste and Philippe Lopez for useful discussions and Thibaut Jombart and three anonymous referees for their comments which helped to improve the manuscript.
Funding: K.S. was supported by the Muséum National D'Histoire Naturelle.
Conflict of Interest: none declared.
REFERENCES
- Guindon S., Gascuel O. A simple, fast, and accurate algorithm to estimate large phylogenies by maximum likelihood. Syst. Biol. 2003;52:696–704. doi: 10.1080/10635150390235520. [DOI] [PubMed] [Google Scholar]
- Hendy M.D. Hadamard conjugation: an analytical tool for phylogenetics. In: Gascuel O., editor. Mathematics of evolution and phylogeny. Oxford: Oxford University Press; 2005. [Google Scholar]
- Huber K.T., et al. Spectronet: a package for computing spectra and median networks. Appl. Bioinformatics. 2002;1:159–161. [PubMed] [Google Scholar]
- Huson D.H., Bryant D. Application of phylogenetic networks in evolutionary studies. Mol. Biol. Evol. 2006;23:254–267. doi: 10.1093/molbev/msj030. [DOI] [PubMed] [Google Scholar]
- Kelchner S.A., Thomas M.A. Model use in phylogenetics: nine key questions. Trends in Ecology and Evolution. 2007;22:87–94. doi: 10.1016/j.tree.2006.10.004. [DOI] [PubMed] [Google Scholar]
- Le S.Q., Gascuel O. LG: an improved, general amino-acid replacement matrix. Mol. Biol. Evol. 2008;25:1307–1320. doi: 10.1093/molbev/msn067. [DOI] [PubMed] [Google Scholar]
- Lento G.M., et al. Use of spectral analysis to test hypotheses on the origin of pinninpeds. Mol. Biol. Evol. 1995;12:28–52. doi: 10.1093/oxfordjournals.molbev.a040189. [DOI] [PubMed] [Google Scholar]
- Mathews S., et al. A duplicate gene rooting of seed plants and the phylogenetic position of flowering plants. Phil. Trans. R. Soc. B. 2010;365:383–395. doi: 10.1098/rstb.2009.0233. [DOI] [PMC free article] [PubMed] [Google Scholar]
- Nixon K.C. The parsimony ratchet, a new method for rapid parsimony analysis. Cladistics. 1999;15:407–414. doi: 10.1111/j.1096-0031.1999.tb00277.x. [DOI] [PubMed] [Google Scholar]
- Pagel M., Meade A. A phylogenetic mixture model for detecting pattern-heterogeneity in gene sequence or character-state data. Syst. Biol. 2004;53:571–581. doi: 10.1080/10635150490468675. [DOI] [PubMed] [Google Scholar]
- Paradis E., et al. APE: analyses of phylogenetics and evolution in R language. Bioinformatics. 2004;20:289–290. doi: 10.1093/bioinformatics/btg412. [DOI] [PubMed] [Google Scholar]
- Posada D. ModelTest: phylogenetic model averaging. Mol. Biol. Evol. 2008;25:1253–1256. doi: 10.1093/molbev/msn083. [DOI] [PubMed] [Google Scholar]
- R Development Core Team. R: A Language and Environment for Statistical Computing. Vienna, Austria: R Foundation for Statistical Computing; 2009. [Google Scholar]
- Rokas A., et al. Genome-scale approaches to resolving incongruence in molecular phylogenies. Nature. 2003;425:798–804. doi: 10.1038/nature02053. [DOI] [PubMed] [Google Scholar]
- Shimodaira H., Hasegawa M. Multiple comparisons of log-likelihoods with applications to phylogenetic inference. Mol. Biol. Evol. 1999;16:1114–1116. [Google Scholar]
- Whelan S., Goldman N. A general empirical model of protein evolution derived from multiple protein families using a maximum-likelihood approach. Mol. Biol. Evol. 2001;18:691–699. doi: 10.1093/oxfordjournals.molbev.a003851. [DOI] [PubMed] [Google Scholar]
Associated Data
This section collects any data citations, data availability statements, or supplementary materials included in this article.


