

Abstract
A multitude of signalling cascades are implicated in the homeostasis of articular chondrocytes. However, the identity of these signalling pathways is not fully established. The 3, 5′-cyclic AMP-mediated signalling system is considered to be a prototype. Adenylyl cyclase (AC) is an effector enzyme responsible for the synthesis of cAMP. There are 10 mammalian AC isoforms and some of these are differentially regulated by calcium/calmodulin (Ca2+/CaM). Ca2+ is known to play an important role in the development and maintenance of skeletal tissues. Ca2+/CaM-dependent AC isoforms and their temporal expression in articular chondrocytes in rats were identified using RT-PCR and immunohistochemistry techniques. All Ca2+/CaM-dependent AC isoforms were expressed in chondrocytes from all age groups examined. Each isoform was differentially expressed in developing and adult articular chondrocytes. Generally, expression of AC isoforms was observed to increase with age, but the increase was not uniform for all Ca2+/CaM-dependent AC isoforms. Expression of Ca2+/CaM-dependent AC isoforms along with other signalling molecules known to be present in articular chondrocytes indicate complicated and multifactorial signalling cascades involved in the development and homeostasis of articular cartilage. The significance of these findings in terms of articular chondrocyte physiology is discussed.
Keywords: adenylyl cyclase, articular chondrocytes, cAMP-mediated signalling
Introduction
Adenylyl cyclase (AC) is an integral membrane protein that catalyzes the synthesis of 3, 5′-cyclic AMP from ATP (Hollins et al. 2002). To date, 10 isoforms of AC have been cloned in mammals, each with a distinct set of regulatory elements and varying degrees of amino acid homology. Nine of these isoforms are membrane-bound and one is cytosolic (Defer et al. 2000). These isoforms are involved in critical signal transduction pathways, where they regulate gene transcription, metabolism and ion channel activity (Tang et al. 1991; Krupinski et al. 1992; Guillou et al. 1999). Calcium/calmodulin (Ca2+/CaM) has regulatory effects on AC isoforms 1, 3, 5, 6 and 8 (Cooper et al. 1995). AC1, 3 and 8 are stimulated, while AC5 and 6 are inhibited by Ca2+/CaM (Choi et al. 1992; Wu et al. 1993; Willoughby & Cooper, 2007).
Isoforms 1 and 8 are mainly expressed in brain (Willoughby & Cooper, 2007). These isoforms are activated either directly by capacitative calcium entry (CCE) (Gomez & Spitzer, 2000) or through voltage-gated channels (Fagan et al. 2000). Both these AC isoforms are concentrated in the lipid rafts (Cooper & Crossthwaite, 2006; Masada et al. 2009). AC1 is more sensitive to Ca2+/CaM and can be stimulated by lower concentrations of Ca2+ (Villacres et al. 1995; Fagan et al. 1996). Isoform 3, originally isolated from olfactory epithelium (Bakalyar & Reed, 1990; Choi et al. 1992), is also expressed in several other tissues (Defer et al. 2000). AC3 is distinctly activated by micromolar concentration of Ca2+ (Choi et al. 1992). AC isoforms 5 and 6 are expressed abundantly in heart muscle and also detected in other organs. These isoforms are inhibited by Ca2+/CaM (Defer et al. 2000).
Articular cartilage is a type of connective tissue that covers the articular surface of all synovial joints. Like other connective tissues, it consists of cells, chondrocytes and macromolecules that form the framework for its matrix. Unlike other connective tissues, articular cartilage is avascular and it is devoid of nerve supply (Hunziker, 2002). Microscopically, articular cartilage is distinguishable into four zones (Hunziker et al. 1997; Poole et al. 2001). Chondrocytes in the adult articular cartilage are fully differentiated cells. In such avascular tissues, second messenger system may play an essential role in maintaining the healthy state of individual cells. cAMP is an important second messenger of G-protein-mediated signal transduction cascades. It is known to regulate intermediary metabolism, development, cellular proliferation and neuronal signalling cascades (Taussig & Gilman, 1995; Montminy, 1997; Sunahara & Taussig, 2002). It is important to know the expression of AC isoforms in articular chondrocytes as AC is the effector enzyme in this cascade. To our knowledge, expression of AC isoforms in developing and adult articular chondrocytes is not established. As Ca2+ plays important roles in the development and maintenance of skeletal tissues, we have attempted to identify Ca2+/CaM-dependent AC isoforms in the hip, knee and shoulder joints of rats at the transcriptional and translational levels in this study.
Materials and methods
Sprague-Dawley rats were housed and nourished according to standard requirements at the Aga Khan University animal house. Ethical approval was obtained from the Ethics Committee for Research on Animals (ECRA) of Aga Khan University.
Reverse transcription-polymerase chain reaction
Rats of either sex were used for this study. Articular cartilage were dissected from 1-day to 1–6-week-old rats. To detect the expression of AC genes, total RNA was extracted from the chondrocytes and RT-PCR was carried out. PCR was performed using cDNA with primers specific to Ca2+/CaM-dependent AC isoforms (Table 1). Each experiment was repeated three to five times for each age group. The positive and negative controls were run simultaneously. In the negative controls, RT enzyme was omitted during reverse transcription. PCR product bands of all AC isoforms were normalized with the β-actin housekeeping gene and quantified for densitometry using nih software (http://rsbweb.nih.gov/ij/). Arbitrary densitometry values up to 3 were considered to represent low expression, values 3–6 moderate expression, and values above 6 high expression.
Table 1.
Sequences and conditions of the primers used in this study
| ACs | Primer sequence | GenBank position | PCR Product size | Annealing Temp. (°C) | No. of cycles |
|---|---|---|---|---|---|
| AC1 | F 5′-ATA CCA GCA GCA GCA GGA CAG-3′ | 1437–1457 | 445 | 55 | 35 |
| R 5′-ACC AGC CAA GAG GAT GAA GTT-3′ | 1862–1882 | ||||
| AC3 | F 5′-CAT CGA GTG TCT ACG CTT C-3′ | 894–913 | 443 | 64 | 35 |
| R 5′-GGA TGA CCT GTG TCT CTT CT-3′ | 1318–1336 | ||||
| AC5 | F 5′-TCG TCG CCC AGG CTG TAG TTG AA-3′ | 1734–1756 | 338 | 64 | 35 |
| R 5′-ACC ATT GTG CCC CAC TCC CTG TT-3′ | 2049–2071 | ||||
| AC6 | F 5′-TGG GGA CAG ATC ACG GGA CTA G-3′ | 1744–1768 | 419 | 51 | 35 |
| R 5′-CAA AGG AAG GGA CGC CGA GAG-3′ | 2141–2163 | ||||
| AC8 | F 5′-GGA TGT AGA TGC GGT GGA AC-3′ | 2614–2633 | 627 | 55 | 35 |
| R 5′-TTC ACT TGA GCC TAG CCT CG-3′ | 3221–3240 |
Tissue isolation
One-day- and 1–3-week-old rats were decapitated and 4–6-week, older rats were anaesthetized with diethyl ether. Joints to be studied were opened and thin slices of articular cartilage from the plateau of tibia, condyles of femur, head of femur, head of humerus, and glenoid cavity of scapula were collected. Isolated tissues were immediately frozen in liquid nitrogen and homogenized in Tri Reagent. Cerebrum and cerebellum were collected separately and were used as control tissues.
RNA extraction
Total RNA was extracted through a modified single-step RNA extraction method (Chomczynski & Sacchi, 1987). The extracted RNA was treated with DNase I to eliminate the genomic DNA contamination.
cDNA synthesis was carried out in the presence of oligo-primer (Bornfeldt & Krebs, 1999) and RT enzyme. Master mix was prepared containing: dithiothreitol (DTT), oligo-primer (Bornfeldt & Krebs, 1999) 2 μL, 10 mm dNTPs 1 μL, 5 × buffer 4 μL, RNase inhibitor 1 μL, 10 mm RT enzyme 1 μL. RNA was added and the final volume was adjusted to 20 μL. The conditions for RT-PCR were: 42 °C for 60 min, 99 °C for 5 min and 4 °C for hold. To serve as negative control, cDNA synthesis was performed without adding RT enzyme.
Polymerase chain reaction
Specific primers for AC1, 3, 5, 6 and 8 isoforms (Bek et al. 2001) (Table 1) were purchased from MWG Oligo Synthesis, Germany. Mastermix contained: 10 × PCR buffer 5 μL, 25 mm MgCl2 2 μL, specific primer for AC isoform (10 pm 1 μL–1) 1 μL, dNTPs (10 mm) 0.5 μL, Taq polymerase 0.2 μL, and cDNA 2 μL. Final volume was adjusted to 25 μL. PCR amplification was performed with a reaction cycles of 95 °C for 1 min, 51–65 °C for 1 min, 72 °C for 1.5 min, and an extension of 2 s per cycle for 35 cycles. PCR products were analyzed by electrophoresis on 1.5% agarose gel containing ethidium bromide and photographed under ultraviolet illumination.
Immunohistochemistry
Dissection and tissue processing
For this investigation, 1-day- and 1–3-week-old Sprague-Dawley rats of either sex were decapitated and 4–6-week-old rats were anaesthetized with ether and perfused transcardially with the fixative containing 2% paraformaldehyde and 0.1% glutaraldehyde in 100 mm phosphate buffer, pH 7.4 at 4 °C. Fixative was also injected into the hip, knee and shoulder joint cavities of all rats to obtain adequate preservation of articular cartilage. Surrounding muscles and other structures were removed and joint capsules were opened. The articulating bones were cut with a bone cutter and immediately transferred to cold fixative for additional 3–4 h. Specimens were washed overnight in 100 mm phosphate buffer (Hollins et al.), and transferred to 3% EDTA at 4 °C for decalcification of the attached bone. EDTA solution was changed daily for 3–4 weeks. Washing in buffer and decalcification was done on a shaker run at low speed. Following decalcification, tissues were washed in buffer, dehydrated in graded ethanol series, and embedded in paraffin wax. Tissue sections were cut at 5 μm thickness on a rotary microtome and used for immunohistochemical localization of AC isoforms in articular chondrocytes.
Immunohistochemistry incubations
Purified rabbit or goat polyclonal antibodies against AC isoforms and their corresponding blocking peptides (Table 2) were purchased from Santa Cruz Biotechnology (Santa Cruz, CA, USA). Diaminobenzidine (DAB) substrate kit and Vectastain Elite ABC kit were purchased from Vector Laboratories (Burlingame, CA, USA). All other reagents were purchased from Sigma Chemical Company (St. Louis, MO, USA).
Table 2.
Characteristics of antibodies used in this study
| Antibody | Antigen | Host | Dilution |
|---|---|---|---|
| AC1 | Epitope mapping at the C-terminus of adenylyl cyclase of human origin | Rabbit | 1 : 200 |
| AC3 | Epitope corresponding to amino acids 1–270 mapping at the N-terminus of adenylyl cyclase III of human origin | Rabbit | 1 : 500 |
| AC5/6 | Epitope corresponding to amino acids 1–130 of adenylyl cyclase VI of human origin | Rabbit | 1 : 200 |
| AC8 | Epitope mapping at the C-terminus of adenylyl cyclase of rat origin | Goat | 1 : 200 |
Sections were dewaxed and rehydrated in graded ethanol series and washed with 100 mm phosphate-buffered saline (PBS), pH 7.4 at room temperature. The tissue slides were warmed for 10–15-min at 60 °C to expose the epitopes (Yamashita, 2007; Bu, 2009). The sections were incubated in 0.1% sodium borohydride and 50 mm glycine in PBS and 3% hydrogen peroxide in water to quench free aldehyde groups and block endogenous peroxidase activity, respectively. The sections were then incubated in 1.5% normal serum diluted in 0.01 m PBS for 1 h to block nonspecific binding sites. The sections were incubated with the primary antibody solutions diluted with 1.5% normal serum for 12–16 h at 4 °C. All subsequent incubations were done at room temperature. Sections were washed with PBS and then incubated with biotinylated secondary antibody for 30 min (50 μL of stock biotinylated antibody in 10 mL of 1% normal serum prepared in 0.01 m PBS (Vectastain ABC kit, Vector Laboratories). After washing with PBS, sections were incubated with the avidin-biotin-peroxidase complex for 30 min. Sections were washed with PBS and peroxidase activity was demonstrated with a solution of 3 mm tetrachloric diaminobenzidine and 0.01% H2O2 in Tris-buffered saline. Sections were washed in tap water and one section on each slide was counter-stained with haematoxylin. The sections were mounted with glycerol. Sections incubated with primary antibody preabsorbed with the control peptide served as negative controls (one representative example for each isoform is shown in Results).
Tissues known to express AC isoforms (cerebrum, cerebellum, hippocampus, olfactory epithelium and kidney tubules) (Bakalyar & Reed, 1990; Mons et al. 1998; Bek et al. 2001; Visel et al. 2006; Conti et al. 2007) were used as positive controls (results not shown). Antibodies were diluted at 1 : 50, 1 : 100, 1 : 200, 1 : 500 and 1 : 1000. Dilutions that provided optimum staining with control tissues were used for incubating the articular cartilage sections. Individual dilutions are mentioned in the figure legends and summarized in Table 2. The sections were viewed on a Nikon Eclipse E-800 microscope and photographed with a Nikon Digital Camera DMX 1200.
Results
Histological zones of articular cartilage
Articular cartilage typically shows four zones. The superficial zone (SZ) is the surface facing the joint cavity. In this zone, the chondrocytes are small and compressed. The deep zone (DZ) lies superficial to the calcified zone (CZ) of the cartilage. In the DZ, the chondrocytes are large and vacuolated. The middle zone (MZ) is present between the superficial and deep zones. Healthy chondrocytes of normal morphology are present in the MZ. In the CZ, vacuolated chondrocytes are surrounded by calcified matrix (Fig. 1) (Schumacher et al. 1994; Lorenzo et al. 1998; Vanderploeg et al. 2008; Karlsson & Lindahl, 2009).
Fig. 1.
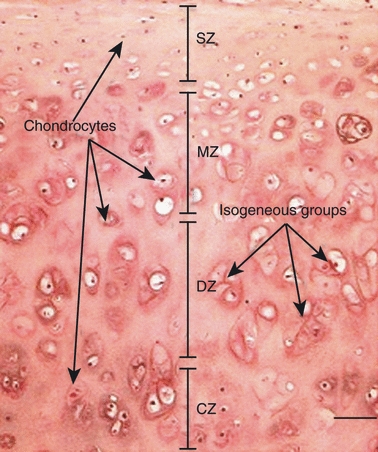
Haematoxylin and eosin-stained section of articular cartilage showing zones of articular cartilage. The superficial zone (SZ) is near the surface, with small compressed chondrocytes. The middle zone (MZ) shows morphologically healthy chondrocytes arranged in isogenous groups (arrows). The deep zone shows large vacuolated chondrocytes. The calcified zone (CZ) is adjacent to subchondral bone, having large chondrocytes with sparse cytoplasm and calcification in matrix.
Temporal expression of AC1 isoforms
Figure 2 demonstrates gel electrophoretic separation of PCR products of AC1 from cerebellum (positive control) and articular chondrocytes of 1-day- and 1–6-week-old rats. Bands in lanes 3, 5, 7, 9, 11, 13, 15 and 17 depicted the expression of AC1 isoform in control and experimental tissues. PCR bands were not observed (negative controls) when RT-PCR was carried out in the absence of RT enzyme. Densitometric analysis of PCR bands for AC1 revealed high expression during weeks 2 and 5 and then a sharp drop in 6-week-old rats (Fig. 3). The housekeeping gene band is not shown.
Fig. 2.

PCR bands of AC1 isoform in cerebellum (control) and articular chondrocytes. Lane 1: DNA ladder of 50 bps. Lanes 2, 4, 6, 8, 10, 12, 14 and 16: negative controls not showing any bands. Lane 3: cerebellum. Lane 5: 1-day; Lane 7, 1-week-; Lane 9, 2-week; Lane 11, 3-week; Lane 13, 4-week; Lane 15, 5-week; and Lane 17, 6-week articular chondrocytes showing bands of appropriate size.
Fig. 3.
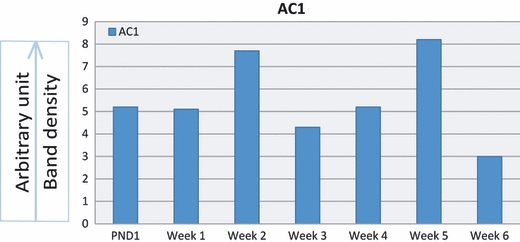
Densitometric analyses of PCR product bands of AC1 from cerebellum and articular chondrocytes normalized with housekeeping gene. Expression of AC1 is high during weeks 2 and 5.
Positive immunoreactivity was detected in articular chondrocytes of 1-day- and 1–6-week-old rats in all the joints examined. Chondrocytes were uniformly distributed in the articular cartilage of 1-day- and 1–3-week-old rats. The chondrocytes in these sections were not uniformly stained (Fig. 4A–D). Four zones of articular cartilage were clearly distinguishable in the sections from 4–6-week-old rats. In the superficial zone, the chondrocytes were smaller with weak staining. In the middle zone, the chondrocytes were healthy with strong immunoreactivity. The chondrocytes present in the deep zone were large and vacuolated with moderate immunoreactivity (Fig. 5A–C). No immunoreactivity was observed in negative controls; one representative example is shown in Fig. 5D.
Fig. 4.
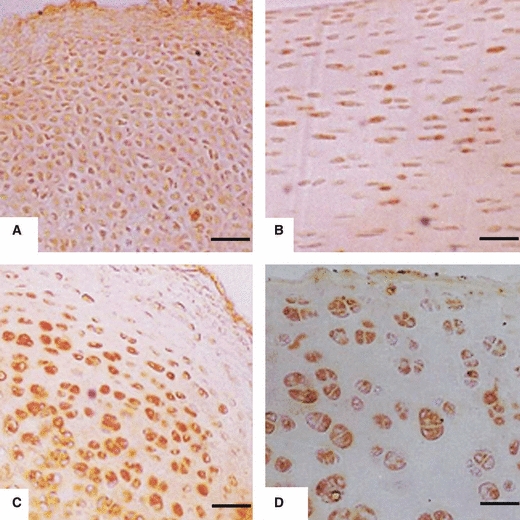
Immunoreactivity to AC1 in articular chondrocytes: (A) Condyle of femur from 1-day-old rat. Chondrocytes are evenly distributed with weak immunoreactivity. Scale bar: 13 μm. (B) Glenoid cavity of scapula from 1-week-old rat. Chondrocytes are evenly distributed with moderate immunoreactivity. Scale bar: 6.5 μm. (C) Head of humerus from 2-week-old rat. Chondrocytes have started rearranging in zones and are showing strong immunoreactivity. Scale bar: 13 μm. (D) Head of femur from 3-week-old rat. Chondrocytes are arranged in zones with strong immunoreactivity. Scale bar: 13 μm.
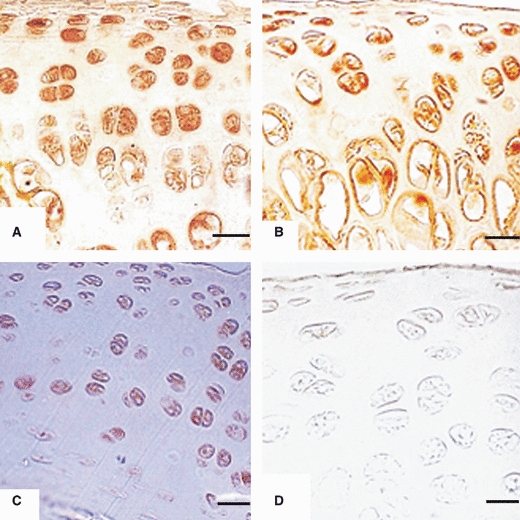
Fig. 5.
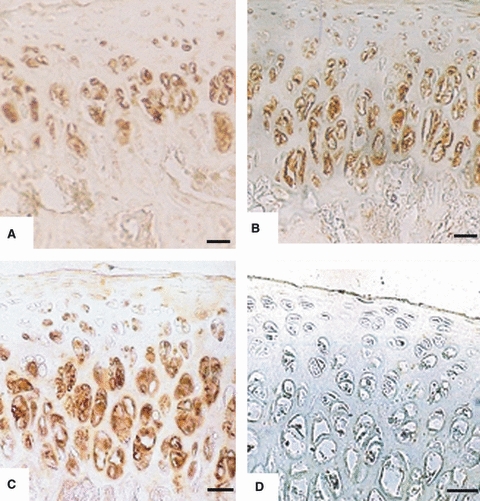
Immunoreactivity to AC1 in articular chondrocytes of: (A) Head of femur from 4-week-old rat. Chondrocytes are arranged in zones with strong immunoreactivity. Scale bar: 13 μm; (B) head of humerus from 5-week-old rat. Chondrocytes are arranged in zones with strong immunoreactivity in middle and deep zones. Scale bar: 13 μm. (C) Plateau of tibia from 6-week-old rat. Chondrocytes are arranged in zones with strong immunoreactivity in middle and deep zones. Scale bar: 13 μm. (D) Plateau of tibia (negative controls) in 6-week-old rats with no immunoreactivity. Scale bars = 13 μm.
Temporal expression of AC8 isoform
Figure 6 demonstrates gel electrophoretic separation of PCR products of AC8 from cerebrum (positive control) and articular chondrocytes of 1-day- and 1–6-week-old rats. A band of appropriate size in lane 5 showed the presence of AC8 gene in cerebrum. Despite trying different temperatures and cyclic conditions, AC8 genes were not detectable at the transcriptional level in articular chondrocytes of any of the age groups (Fig. 6, lanes 7–19). Absence of AC8 messages could be attributed to fast turnover and having more than one splice variant of AC8. Very specific primers need to be designed for AC8 to confirm its expression in chondrocytes. The presence of AC8 enzyme was detected in all age groups by immunohistochemistry. One-day- and 1-week-old chondrocytes were uniformly distributed with weak immunoreactivity to AC8 in a few cells (Fig. 7A,B). Two- and 3-week-old chondrocytes showed a zonal arrangement with moderate immunoreactivity in the majority of these cells. The chondrocytes in the superficial zone were small and compressed (Fig. 7C,D). The chondrocytes of 4–6-week-old rats showed obvious zonal arrangement and strong immunoreactivity in many cells (Fig. 8A–C). No immunoreactivity was observed in negative controls; one representative example is shown in Fig. 8D. Our inability to detect expression of AC8 at the transcriptional level is in agreement with the results of Bek et al. (2001) and Mattick et al. (2007). Mattick, (2007) explained the discrepancy in expression of mRNA and proteins by stating that there may be some trade-off between protein and mRNA-based forms of gene regulation in simple eukaryotes.
Fig. 6.
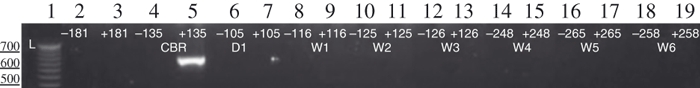
PCR bands of AC8 isoform in cerebrum and articular chondrocytes of rat. Lane 1: DNA ladder of 50 bps. Lanes 4, 6, 8, 10, 12, 14, 16 and 18: negative controls did not show any bands. Lane 5: cerebrum (control) with band of appropriate size. Lane 7, 1-day; Lane 9, 1-week; Lane 11, 2-week; Lane 13, 3-week; Lane 15, 4-week; Lane 17, 5-week; Lane 19, 6-week-old articular chondrocytes where bands of expected size are not detected.
Fig. 7.
Immunoreactivity to AC8 in articular chondrocytes of: (A) Plateau of tibia from 1-day-old rat. Small chondrocytes are uniformly distributed with weak staining. Scale bar: 13 μm. (B) Glenoid cavity of scapula from 1-week-old rat. Chondrocytes are uniformly distributed with weak staining in few cells. Scale bar: 21 μm. (C) Humerus from 2-week-old rat. Chondrocytes are arranged in zones with moderate immunostaining. Scale bar: 8.5 μm. (D) Glenoid cavity of scapula form 3-week-old rat. Chondrocytes are arranged in zones showing immunoreactivity. Scale bar: 10.5 μm.
Fig. 8.
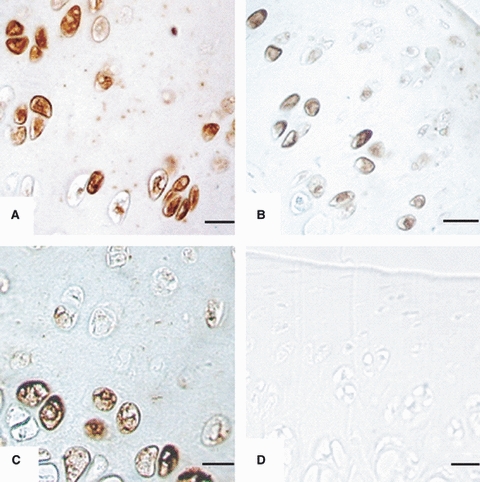
Immunoreactivity to AC8 in articular chondrocytes of: (A) Head of humerus from 4-week-old rat. Chondrocytes are arranged in zones showing strong immunoreactivity. Scale bar: 10.5 μm. (b) Head of femur from 5-week-old rat. Chondrocytes are arranged in zones with strong immunoreactivity in middle and deep zones. Scale bar: 10.5 μm. (C) Head of humerus from 6-week-old rat. Chondrocytes are arranged in zones with strong immunoreactivity in the deep zone. Scale bar: 10.5 μm. (D) Plateau of tibia (negative controls) with no immunoreactivity. Scale bar: 10.5 μm.
Temporal expression of AC3 isoform
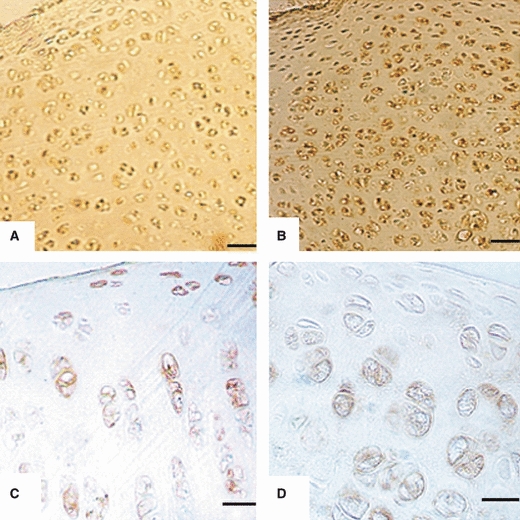
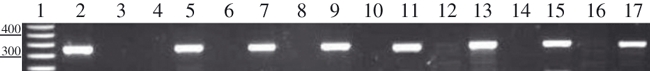
Figure 9 demonstrates the gel electrophoretic separation of PCR products of AC3 from nasal mucosa (positive control) and articular chondrocytes of 1-day- and 1–6-week-old rats. Bands in lanes 3, 5, 7, 9, 11, 13, 15 and 17 represent the expression of AC3 isoform in control and experimental tissues. PCR bands were not observed in negative controls. Densitometric analysis of PCR bands for AC3 revealed an increase in the expression of AC3 isoform with age. A fast rise in expression was seen in 3-week-old chondrocytes and the expression remained stable in adult chondrocytes (Fig. 10). One-day-old chondrocytes were uniformly distributed in the section and most of those were immunoreactive. One-week-old chondrocytes were also uniformly arranged, showing immunoreactivity in some of the cell. Two- and 3-week-old chondrocytes had started their rearrangement in zones and showed staining in the majority of the cells (Fig. 11A–D). Four- to 6-week-old chondrocytes were arranged in four zones. In all four zones, the morphology of the chondrocytes was typically the same as described in the histological zones of the articular cartilage (Fig. 1). Chondrocytes in the middle and deep zones of 4–6-week-old rats showed the normal morphology of healthy chondrocytes. Strong immunoreactivity was detected in articular chondrocytes of 4–6-week-old rats in all the joints examined (Fig. 12A–C). No immunoreactivity was observed in negative controls; one representative example is shown in Fig. 12D.
Fig. 9.
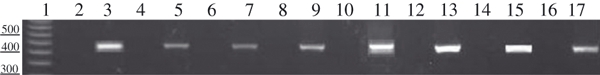
PCR product bands for AC3 isoform in cerebellum and articular chondrocytes of rat. Lane 1: DNA marker of 50 bp. Lanes 2, 4, 6, 8, 10, 12, 14, and 16: negative controls did not show any bands. Lane 3: cerebellum. Lane 5: 1-day; Lane 7, 1-week; Lane 9, 2-week; Lane 11, 3-week; Lane 13, 4-week; Lane 15, 5-week; Lane 17, 6-week-old articular chondrocytes showing bands of appropriate size.
Fig. 10.
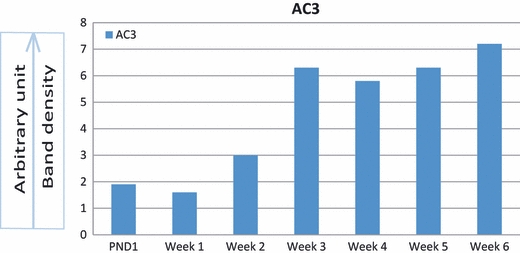
Densitometric analyses of PCR bands of AC3 from cerebellum and articular chondrocytes normalized with housekeeping gene. Band densities increase with age.
Fig. 11.
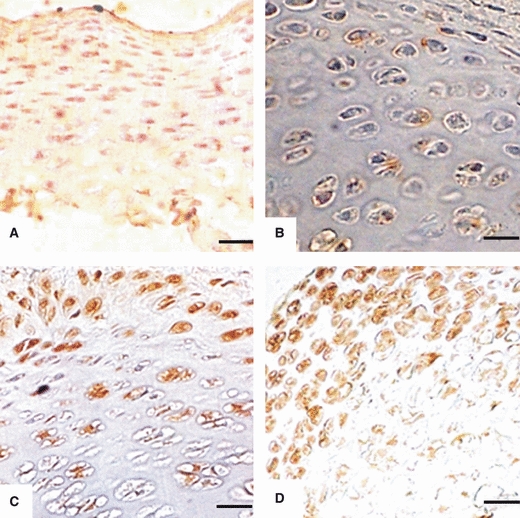
Immunoreactivity to AC3 in articular chondrocytes of: (A) Head of femur from 1-day-old rat. Chondrocytes are uniformly distributed and are immunoreactive. Scale bar: 13 μm. (B) Condyle of femur from 1-week-old rats. Chondrocytes are uniformly distributed and few are immunoreactive. Scale bar: 6.5 μm. (C) Head of humerus from 2-week-old rat. Chondrocytes are rearranged in zones and show immunoreactivity. Scale bar: 6.5 μm. (D) Glenoid cavity of scapula from 3-week-old rat. Chondrocytes have started to rearrange in zones and show immunoreactivity in superficial and middle zones. Scale bar: 6.5 μm.
Fig. 12.
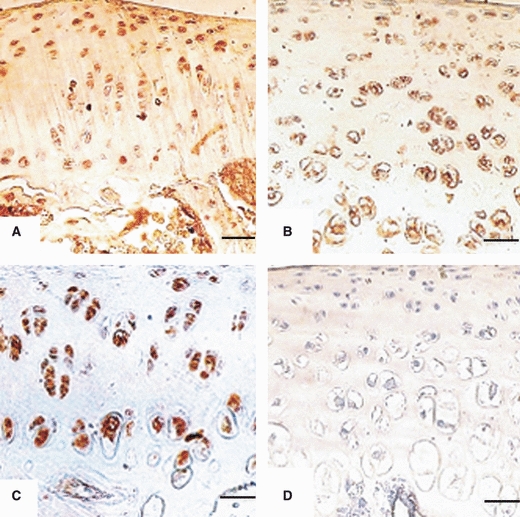
Immunoreactivity to AC3 in articular chondrocytes of: (A) Head femur from 4-week-old rat. Chondrocytes are arranged in zones with strong immunoreactivity in all zones. Scale bar: 27 μm. (B) Head of femur from 5-week-old rat. Chondrocytes are arranged in zones with strong immunoreactivity in all zones. Scale bar: 13 μm. (C) Head of femur from 6-week-old rat. Chondrocytes are arranged in zones with strong immunoreactivity in all zones. Scale bar: 13 μm. (D) Head of femur (negative controls) with no immunoreactivity, Scale bars = 13 μm.
Temporal expression of AC5/6 isoforms
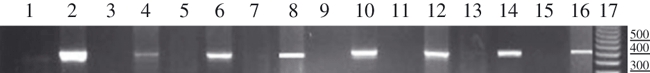
Figure 13 demonstrates the gel electrophoretic separation of PCR products of AC5 from cerebellum (positive control) and articular chondrocytes of 1-day- and 1–6-week-old rats. Bands in lanes 3, 5, 7, 9, 11, 13, 15 and 17 depicted the expression of AC5 isoform in control and experimental tissues. PCR bands were not observed in negative controls. Densitometric analysis of PCR bands for AC5 revealed a steady rise in the expression of AC5 isoform in the chondrocytes of increasing age (Fig. 14). Figure 15 demonstrates the gel electrophoretic separation of PCR products of AC6 from cerebellum (positive control) and articular chondrocytes of 1-day- and 1–6-week-old rats. Bands in lanes 2, 4, 6, 8, 10, 12, 14 and 16 depicted the expression of AC6 isoform in control and experimental tissues. Densitometric analysis of PCR bands for AC6 revealed age-related rise in the expression, and the expression remained stable in developing and adult chondrocytes (Fig. 16).
Fig. 13.
PCR product bands of AC5 isoform in cerebellum and articular chondrocytes. Lane 1: DNA ladder of 50 bp. Lane 2: cerebellum. Lanes 3, 4, 6, 8, 10, 12, 14 and 16: negative controls not showing any bands. Lane 5, 1-day; Lane 7, 1-week; Lane 9, 2-week; Lane 11, 3-week; lane 13, 4-week; Lane 15, 5-week; Lane 17, 6-week-old articular chondrocytes with bands of appropriate size.
Fig. 14.
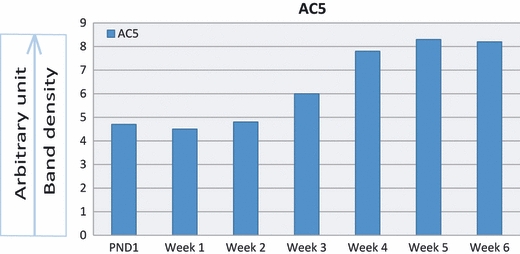
Densitometric analyses of PCR bands of AC5 from cerebellum and articular chondrocytes normalized with housekeeping gene. Band densities increase with age.
Fig. 15.
PCR bands of AC6 isoform in cerebellum and articular chondrocytes of rat. Lanes 1, 3, 5, 7, 9, 11, 13, 15: negative controls, not showing any bands. Lane 2: cerebellum. Lane 4, 1-day; Lane 6, 1-week; Lane 8, 2-week; Lane 10, 3-week; Lane 12, 4-week; Lane 14, 5-week; Lane 16, 6-week-old articular chondrocytes showing bands of appropriate size; Lane 17: DNA ladder of 50 bp.
Fig. 16.
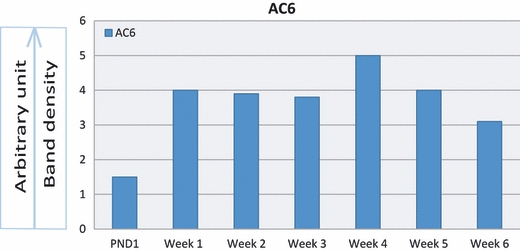
Densitometric analyses of PCR product bands of AC6 in cerebellum and articular chondrocytes normalized with housekeeping gene. Band densities are nearly uniform in developing adult chondrocytes except in newborn rat.
AC5 and 6 are closely related isoforms. Commercially available antibodies cross-react with isoforms 5 and 6. The antibody used for AC 5/6 in this study is shown in Table 2. One-day- and 1-week-old chondrocytes were evenly arranged and many of those were immunoreactive. The chondrocytes from 2–3-week-old rats showed a zonal arrangement and were immunoreactive to AC5/6. Typical zonation of chondrocytes was seen in sections from 4–6-week-old rats; the chondrocytes in these sections were strongly immunoreactive (Figs 17A–D and 18A–C). No immunoreactivity was observed in negative controls; one representative figure is shown in Fig. 18D.
Fig. 17.
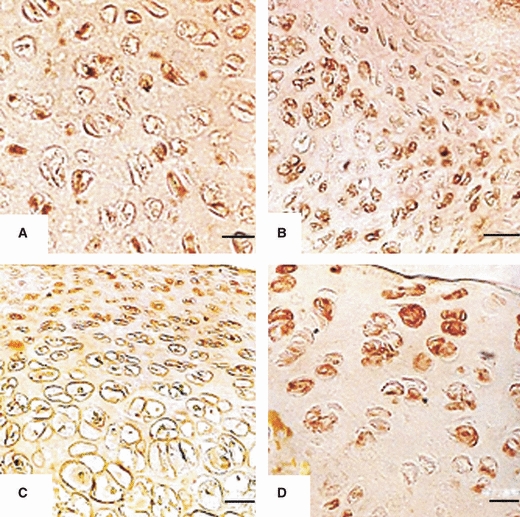
Immunoreactivity to AC5/6 in articular chondrocytes of: (A) Plateau of tibia from 1-day-old rat. Chondrocytes are uniformly distributed and show immunoreactivity. Scale bar: 4.5 μm. (B) Condyle of femur from 1-week-old rat. Chondrocytes are uniformly distributed and show immunoreactivity. Scale bar: 6.5 μm. (C) Head of femur from 2-week-old rat. Chondrocytes show zonation with moderate immunoreactivity. Scale bar = 6.5 μm. (D) Head of femur from 3-week-old rat. Chondrocytes show zonation with strong immunoreactivity in superficial and middle zones. Scale bar: 6.5 μm.
Fig. 18.
Immunoreactivity to AC5/6 in articular chondrocytes of: (A) Head of femur from 4-week-old rat. Chondrocytes are arranged in zones with strong immunoreactivity in all zones. Scale bar: 6.5 μm. (B) Head of femur from 5-week-old rat. Chondrocytes are arranged in zones with strong immunoreactivity in all zones. Scale bar: 6.5 μm. (C) Head of femur from 6-week-old rat. Chondrocytes are arranged in zones with strong immunoreactivity in all zones. Scale bar: 6.5 μm.; (D) Head of humerus (negative control) from 6-week-old rat with no immunoreactivity. Scale bar: 13 μm.
Temporal expression of Ca2+/CaM-dependent AC isoforms
Figure 19 demonstrates the temporal expression of Ca2+/CaM-dependent AC isoforms at the transcriptional level. Messages of all Ca2+/CaM-dependent AC isoforms were detected in articular chondrocytes of 1-day- and 1–6-week-old rats. AC1 and 5 showed a higher expression than AC3 and 6 in all age groups examined. Expression of all five AC isoforms increased with age. Expression AC1 decreased in chondrocytes of 6-week-old rats.
Fig. 19.
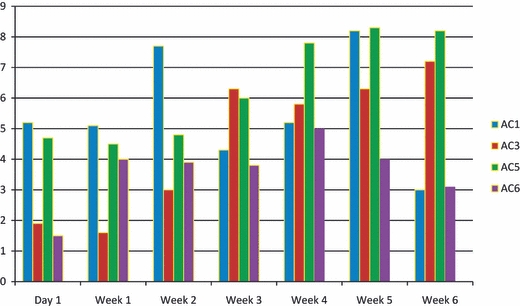
Summary of temporal expression of Ca2+/CaM-dependent AC isoforms at translational level. AC8 isoform was not detected in our samples. AC isoforms 1 and 5 are expressed comparatively more than 3 and 6 isoforms.
Discussion
In this study we report temporal expression of Ca2+/CaM-dependent AC isoforms in articular chondrocytes of hip, knee and shoulder joints in the rat (Fig. 19). Our RT-PCR results show an increase in expression of the Ca2+/CaM-dependent AC isoforms in maturing articular chondrocytes. We have also noted differences in the intensity of immunoreactivity for these five AC isoforms. Furthermore, our results indicate that Ca2+/CaM-dependent AC isoforms are not expressed evenly in chondrocytes in the superficial, middle and deep zones of the articular cartilage of the joints examined. Although we did not perform double- or triple-labeling studies, our results suggest that more than one isoform is expressed in articular chondrocytes. Several studies have reported tissue- and organ-specific expression of AC isoforms and that the expression of more than one isoform in a particular cell is the norm rather than an exception (Defer et al. 2000; Drescher et al. 2000; Sunahara & Taussig, 2002; Sadana & Dessauer, 2009).
Modulation of the enzymatic activity of individual isoforms with specific pharmacology at discrete cellular sites is key to the transduction by the cAMP-second messenger cascade of signal derived from external stimuli upstream to effect, i.e. to cause, a biological response downstream (Willoughby & Cooper, 2007). cAMP activates protein kinase A (PKA) to modulate physiological functions including transcription (Scott, 1991; Taussig et al. 1994; Iwami et al. 1995). As with most proteins involved in signal transduction, Ca2+/CaM-dependent AC isoforms with different regulatory properties suggest complex signal integration.
The compartmentalization of ACs in microdomains may ensure the protection of the rest of the cell from the hyperactivity of cAMP signalling. Lipid rafts are specialized areas of plasma membrane that have high concentrations of cholesterol and sphingolipids (Simons & Toomre, 2000). Recently, Crossthwaite et al. (2006) have reported localization of AC8 isoform in lipid rafts along with the catalytic subunit of protein phosphatase 2A, a downstream component of cAMP signalling cascade. In many cell types, raft domains also contain the scaffold protein caveolin (Razani et al. 2002; Parton & Simons, 2007). Caveolin is reported to be expressed in newborn and adult rat articular chondrocytes (Schwab et al. 1999) and in avian limbs during endochondral ossification (Hollins et al. 2002). Our results show the presence of AC isoforms 1, 3, 5/6 and 8 in articular chondrocytes. It is highly probable that the expressed AC isoforms in articular chondrocytes are sequestered in caveolae to regulate cAMP signalling.
The chondrocytes in articular cartilage have to maintain a differentiated state to synthesize and secrete cartilage-specific matrix components (Buckwalter, 1997). The differentiated state of chondrocytes is regulated by complex protein kinase signalling pathways, among which protein kinase C (PKC) plays an integral role (Lee et al. 2004; Yoon et al. 2002). PKC is known to stimulate (AC1, 2, 3, 5 and 8) and inhibit (AC6) the activity of Ca2+/CaM-dependent AC isoforms (Jacobowitz et al. 1993; Lustig et al. 1993; Sadana & Dessauer, 2009). We have noted variable immunoreactivity to the PKC-modulated AC isoforms (see Results). The presence of PKC and AC isoforms in articular chondrocytes suggests an intricate balance between these enzymes, and their importance in maintaining homeostasis in articular cartilage.
Chondrocytes in the middle and deep zones of the articular cartilage are important for maintaining the cartilaginous matrix (Buckwalter & Mankin, 1998). To support the matrix, chondrocytes have to sustain metabolic activities. To carry out these diverse functions, chondrocytes require cross-talk between signal transduction pathways. AC1, 3 and 8 immunoreactivity in chondrocytes of the middle and deep zones suggests an intricate balance in the availability of free cytosolic calcium in articular chondrocytes. An increase in free cytosolic calcium in articular chondrocytes in response to insulin-growth (IGF) factors 1 and 2 (IGF-1 and IGF-2) has been shown (Poiraudeau et al. 1997). IGF-1 and IGF-2 could induce increase in intracellular Ca2+, causing activation of AC1 and AC3 isoforms and resulting in cAMP production. cAMP in turn can activate PKA, and PKA can activate phospholipase C, resulting in downstream activation of PKC through inositol phosphate and diacylglycerol. Once activated, PKC could maintain the differentiated state of chondrocytes (Defer et al. 2000; Lee et al. 2004; Sadana & Dessauer, 2009). The other possibility is that cAMP-activated PKA could enter the nucleus and phosphorylate the cAMP-response element binding protein (CREB) gene. CREB gene is an important regulator of proliferation of mesenchymal cells, rate of chondrocyte differentiation, and repair and restoration of articular cartilage (Ionescu et al. 2001). Thus, it is likely that chondrocyte proliferation as seen during interstitial growth of cartilage and differentiation of chondrocytes for restoration of tissue damage is also modulated by cAMP-activated PKA and downstream phosphorylation of CREB gene.
To establish a role for AC-mediated signalling, several studies have focused on the expression of G-protein coupled receptors in articular chondrocytes. These include the expression of P1 and P2 purine receptors (Koolpe et al. 1999; Kudirka et al. 2007), prostaglandin receptors (Aoyama et al. 2005), adenosine receptors (Varani et al. 2008) and adrenergic receptors (Lai & Mitchell, 2008). Expression of these receptors along with the expression of Ca2+/CaM-dependent AC isoforms in articular chondrocytes suggests the complexity of signalling pathways. The expression of G-protein coupled receptors and their downstream signalling pathways demonstrate a chondrocyte–matrix interaction, which is essential to maintain the integrity of articular cartilage (Aoyama et al. 2005; Kudirka et al. 2007; Lai & Mitchell, 2008; Varani et al. 2008). Furthermore, the importance of articular chondrocyte–matrix interaction is demonstrated in age-related changes in articular cartilage. Osteoarthritis is a classic example, in which senescence of articular chondrocytes leads to matrix degradation (Loeser, 2009). An increased level of cAMP in articular chondrocytes has been shown to inhibit expression of matrix metalloproteinase, resulting in inhibition of matrix degradation (Karsdal et al. 2007). As all five Ca2+/CaM-dependent AC isoforms are expressed in articular chondrocytes, it is appropriate to suggest their role in maintaining the physiological level of intracellular cAMP. Additionally, it is tempting to suggest a therapeutic role for cAMP modulators in aging articular chondrocytes.
Thus, evidence has been obtained for expression of Ca2+/CaM-dependent AC isoforms in articular chondrocytes at transcriptional and translational levels. These findings suggest a role for cAMP signalling cascades in these cells. Further studies on chondrocytes from a particular joint are necessary to understand the joint specific complexity of signalling pathways. In future studies, we intend to characterize other components of cAMP-regulated pathways in articular chondrocytes.
Acknowledgments
This research work was funded by a seed money grant from the FHS-Research Committee of the Aga Khan University and in part by the Department of Biological & Biomedical Sciences Research budget. Dr Kulsoom Ghias has kindly proofread the manuscript and Ms Gulafroz Fazli assisted in using endnote.
Authors' contributions
Ismail Memon designed this research work, wrote the grant proposal, carried out bench work and wrote the manuscript. Dr Khalid M. Khan assisted in designing this research work, writing the grant proposal, supervised a major part of the bench work and finalized the manuscript. Sammar Siddiqui assisted in animal dissection, immunohistochemistry and PCR, and contributed to the writing of the manuscript. Siddiqa Perveen assisted in RT-PCR and gel electrophoresis and contributed to the preparation of the manuscript. Muhammad Ishaq assisted in designing this research work, writing the grant proposal, supervised over all bench work and contributed to the preparation of the manuscript.
References
- Aoyama T, Liang B, Okamoto T, et al. PGE2 signal through EP2 promotes the growth of articular chondrocytes. J Bone Miner Res. 2005;20:377–389. doi: 10.1359/JBMR.041122. [DOI] [PubMed] [Google Scholar]
- Bakalyar HA, Reed RR. Identification of a specialized adenylyl cyclase that may mediate odorant detection. Science. 1990;250:1403–1406. doi: 10.1126/science.2255909. [DOI] [PubMed] [Google Scholar]
- Bek MJ, Zheng S, Xu J, et al. Differential expression of adenylyl cyclases in the rat nephron. Kidney Int. 2001;60:890–899. doi: 10.1046/j.1523-1755.2001.060003890.x. [DOI] [PubMed] [Google Scholar]
- Bornfeldt KE, Krebs EG. Crosstalk between protein kinase A and growth factor receptor signalling pathways in arterial smooth muscle. Cell Signal. 1999;11:465–477. doi: 10.1016/s0898-6568(99)00020-0. [DOI] [PubMed] [Google Scholar]
- Bu G. Apolipoprotein E and its receptors in Alzheimer's disease: pathways, pathogenesis and therapy. Nat Rev Neurosci. 2009;10:333–344. doi: 10.1038/nrn2620. [DOI] [PMC free article] [PubMed] [Google Scholar]
- Buckwalter JA. Were the Hunter brothers wrong? Can surgical treatment repair articular cartilage? Iowa Orthop J. 1997;17:1–13. [PMC free article] [PubMed] [Google Scholar]
- Buckwalter JA, Mankin HJ. Articular cartilage: tissue design and chondrocyte-matrix interactions. Instr Course Lect. 1998;47:477–486. [PubMed] [Google Scholar]
- Choi EJ, Xia Z, Storm DR. Stimulation of the type III olfactory adenylyl cyclase by calcium and calmodulin. Biochemistry. 1992;31:6492–6498. doi: 10.1021/bi00143a019. [DOI] [PubMed] [Google Scholar]
- Chomczynski P, Sacchi N. Single-step method of RNA isolation by acid guanidinium thiocyanate-phenol-chloroform extraction. Anal Biochem. 1987;162:156–159. doi: 10.1006/abio.1987.9999. [DOI] [PubMed] [Google Scholar]
- Conti AC, Maas JW, Jr, Muglia LM, et al. Distinct regional and subcellular localization of adenylyl cyclases type 1 and 8 in mouse brain. Neuroscience. 2007;146:713–729. doi: 10.1016/j.neuroscience.2007.01.045. [DOI] [PMC free article] [PubMed] [Google Scholar]
- Cooper DM, Crossthwaite AJ. Higher-order organization and regulation of adenylyl cyclases. Trends Pharmacol Sci. 2006;27:426–431. doi: 10.1016/j.tips.2006.06.002. [DOI] [PubMed] [Google Scholar]
- Cooper DM, Mons N, Karpen JW. Adenylyl cyclases and the interaction between calcium and cAMP signalling. Nature. 1995;374:421–424. doi: 10.1038/374421a0. [DOI] [PubMed] [Google Scholar]
- Crossthwaite AJ, Ciruela A, Rayner TF, et al. A direct interaction between the N terminus of adenylyl cyclase AC8 and the catalytic subunit of protein phosphatase 2A. Mol Pharmacol. 2006;69:608–617. doi: 10.1124/mol.105.018275. [DOI] [PubMed] [Google Scholar]
- Defer N, Best-Belpomme M, Hanoune J. Tissue specificity and physiological relevance of various isoforms of adenylyl cyclase. Am J Physiol Renal Physiol. 2000;279:F400–F416. doi: 10.1152/ajprenal.2000.279.3.F400. [DOI] [PubMed] [Google Scholar]
- Drescher MJ, Khan KM, Hatfield JS, et al. Immunohistochemical localization of adenylyl cyclase isoforms in the lateral wall of the rat cochlea. Brain Res Mol Brain Res. 2000;76:289–298. doi: 10.1016/s0169-328x(00)00008-5. [DOI] [PubMed] [Google Scholar]
- Fagan KA, Mahey R, Cooper DM. Functional co-localization of transfected Ca(2+)-stimulable adenylyl cyclases with capacitative Ca2+ entry sites. J Biol Chem. 1996;271:12438–12444. doi: 10.1074/jbc.271.21.12438. [DOI] [PubMed] [Google Scholar]
- Fagan KA, Graf RA, Tolman S, et al. Regulation of a Ca2+-sensitive adenylyl cyclase in an excitable cell. Role of voltage-gated versus capacitative Ca2+ entry. J Biol Chem. 2000;275:40187–40194. doi: 10.1074/jbc.M006606200. [DOI] [PubMed] [Google Scholar]
- Gomez TM, Spitzer NC. Regulation of growth cone behavior by calcium: new dynamics to earlier perspectives. J Neurobiol. 2000;44:174–183. [PubMed] [Google Scholar]
- Guillou JL, Nakata H, Cooper DM. Inhibition by calcium of mammalian adenylyl cyclases. J Biol Chem. 1999;274:35539–35545. doi: 10.1074/jbc.274.50.35539. [DOI] [PubMed] [Google Scholar]
- Hollins AJ, Campbell L, Gumbleton M, et al. Caveolin expression during chondrogenesis in the avian limb. Dev Dyn. 2002;225:205–211. doi: 10.1002/dvdy.10143. [DOI] [PubMed] [Google Scholar]
- Hunziker EB. Articular cartilage repair: basic science and clinical progress. A review of the current status and prospects. Osteoarthritis Cartilage. 2002;10:432–463. doi: 10.1053/joca.2002.0801. [DOI] [PubMed] [Google Scholar]
- Hunziker EB, Michel M, Studer D. Ultrastructure of adult human articular cartilage matrix after cryotechnical processing. Microsc Res Tech. 1997;37:271–284. doi: 10.1002/(SICI)1097-0029(19970515)37:4<271::AID-JEMT3>3.0.CO;2-O. [DOI] [PubMed] [Google Scholar]
- Ionescu AM, Schwarz EM, Vinson C, et al. PTHrP modulates chondrocyte differentiation through AP-1 and CREB signalling. J Biol Chem. 2001;276:11639–11647. doi: 10.1074/jbc.M006564200. [DOI] [PubMed] [Google Scholar]
- Iwami G, Kawabe J, Ebina T, et al. Regulation of adenylyl cyclase by protein kinase A. J Biol Chem. 1995;270:12481–12484. doi: 10.1074/jbc.270.21.12481. [DOI] [PubMed] [Google Scholar]
- Jacobowitz O, Chen J, Premont RT, et al. Stimulation of specific types of Gs-stimulated adenylyl cyclases by phorbol ester treatment. J Biol Chem. 1993;268:3829–3832. [PubMed] [Google Scholar]
- Karlsson C, Lindahl A. Articular cartilage stem cell signalling. Arthritis Res Ther. 2009;11:121. doi: 10.1186/ar2753. [DOI] [PMC free article] [PubMed] [Google Scholar]
- Karsdal MA, Sumer EU, Wulf H, et al. Induction of increased cAMP levels in articular chondrocytes blocks matrix metalloproteinase-mediated cartilage degradation, but not aggrecanase-mediated cartilage degradation. Arthritis Rheum. 2007;56:1549–1558. doi: 10.1002/art.22599. [DOI] [PubMed] [Google Scholar]
- Koolpe M, Pearson D, Benton HP. Expression of both P1 and P2 purine receptor genes by human articular chondrocytes and profile of ligand-mediated prostaglandin E2 release. Arthritis Rheum. 1999;42:258–267. doi: 10.1002/1529-0131(199902)42:2<258::AID-ANR7>3.0.CO;2-O. [DOI] [PubMed] [Google Scholar]
- Krupinski J, Lehman TC, Frankenfield CD, et al. Molecular diversity in the adenylylcyclase family. Evidence for eight forms of the enzyme and cloning of type VI. J Biol Chem. 1992;267:24858–24862. [PubMed] [Google Scholar]
- Kudirka JC, Panupinthu N, Tesseyman MA, et al. P2Y nucleotide receptor signalling through MAPK/ERK is regulated by extracellular matrix: involvement of beta3 integrins. J Cell Physiol. 2007;213:54–64. doi: 10.1002/jcp.21087. [DOI] [PubMed] [Google Scholar]
- Lai LP, Mitchell J. Beta2-adrenergic receptors expressed on murine chondrocytes stimulate cellular growth and inhibit the expression of Indian hedgehog and collagen type X. J Cell Biochem. 2008;104:545–553. doi: 10.1002/jcb.21646. [DOI] [PubMed] [Google Scholar]
- Lee SJ, Jeon HB, Lee JH, et al. Identification of proteins differentially expressed during chondrogenesis of mesenchymal cells. FEBS Lett. 2004;563:35–40. doi: 10.1016/S0014-5793(04)00243-1. [DOI] [PubMed] [Google Scholar]
- Loeser RF. Aging and osteoarthritis: the role of chondrocyte senescence and aging changes in the cartilage matrix. Osteoarthritis Cartilage. 2009;17:971–979.. doi: 10.1016/j.joca.2009.03.002. [DOI] [PMC free article] [PubMed] [Google Scholar]
- Lorenzo P, Bayliss MT, Heinegard D. A novel cartilage protein (CILP) present in the mid-zone of human articular cartilage increases with age. J Biol Chem. 1998;273:23463–23468. doi: 10.1074/jbc.273.36.23463. [DOI] [PubMed] [Google Scholar]
- Lustig KD, Conklin BR, Herzmark P, et al. Type II adenylylcyclase integrates coincident signals from Gs, Gi, and Gq. J Biol Chem. 1993;268:13900–13905. [PubMed] [Google Scholar]
- Masada N, Ciruela A, Macdougall DA, et al. Distinct mechanisms of regulation by Ca2+/calmodulin of type 1 and 8 adenylyl cyclases support their different physiological roles. J Biol Chem. 2009;284:4451–4463. doi: 10.1074/jbc.M807359200. [DOI] [PMC free article] [PubMed] [Google Scholar]
- Mattick JS. A new paradigm for developmental biology. J Exp Biol. 2007;210:1526–1547. doi: 10.1242/jeb.005017. [DOI] [PubMed] [Google Scholar]
- Mattick P, Parrington J, Odia E, et al. Ca2+-stimulated adenylyl cyclase isoform AC1 is preferentially expressed in guinea-pig sino-atrial node cells and modulates the I(f) pacemaker current. J Physiol. 2007;582:1195–1203. doi: 10.1113/jphysiol.2007.133439. [DOI] [PMC free article] [PubMed] [Google Scholar]
- Mons N, Yoshimura M, Ikeda H, et al. Immunological assessment of the distribution of type VII adenylyl cyclase in brain. Brain Res. 1998;788:251–261. doi: 10.1016/s0006-8993(98)00005-5. [DOI] [PubMed] [Google Scholar]
- Montminy M. Transcriptional regulation by cyclic AMP. Annu Rev Biochem. 1997;66:807–822. doi: 10.1146/annurev.biochem.66.1.807. [DOI] [PubMed] [Google Scholar]
- Parton RG, Simons K. The multiple faces of caveolae. Nat Rev Mol Cell Biol. 2007;8:185–194. doi: 10.1038/nrm2122. [DOI] [PubMed] [Google Scholar]
- Poiraudeau S, Lieberherr M, Kergosie N, et al. Different mechanisms are involved in intracellular calcium increase by insulin-like growth factors 1 and 2 in articular chondrocytes: voltage-gated calcium channels, and/or phospholipase C coupled to a pertussis-sensitive G-protein. J Cell Biochem. 1997;64:414–422. [PubMed] [Google Scholar]
- Poole AR, Kojima T, Yasuda T, et al. Composition and structure of articular cartilage: a template for tissue repair. Clin Orthop Relat Res. 2001;391 (Suppl):S26–S33. doi: 10.1097/00003086-200110001-00004. [DOI] [PubMed] [Google Scholar]
- Razani B, Woodman SE, Lisanti MP. Caveolae: from cell biology to animal physiology. Pharmacol Rev. 2002;54:431–467. doi: 10.1124/pr.54.3.431. [DOI] [PubMed] [Google Scholar]
- Sadana R, Dessauer CW. Physiological roles for G protein-regulated adenylyl cyclase isoforms: insights from knockout and overexpression studies. Neurosignals. 2009;17:5–22. doi: 10.1159/000166277. [DOI] [PMC free article] [PubMed] [Google Scholar]
- Schumacher BL, Block JA, Schmid TM, et al. A novel proteoglycan synthesized and secreted by chondrocytes of the superficial zone of articular cartilage. Arch Biochem Biophys. 1994;311:144–152. doi: 10.1006/abbi.1994.1219. [DOI] [PubMed] [Google Scholar]
- Schwab W, Hempel U, Funk RH, et al. Ultrastructural identification of caveolae and immunocytochemical as well as biochemical detection of caveolin in chondrocytes. Histochem J. 1999;31:315–320. doi: 10.1023/a:1003718002088. [DOI] [PubMed] [Google Scholar]
- Scott JD. Cyclic nucleotide-dependent protein kinases. Pharmacol Ther. 1991;50:123–145. doi: 10.1016/0163-7258(91)90075-w. [DOI] [PubMed] [Google Scholar]
- Simons K, Toomre D. Lipid rafts and signal transduction. Nat Rev Mol Cell Biol. 2000;1:31–39. doi: 10.1038/35036052. [DOI] [PubMed] [Google Scholar]
- Sunahara RK, Taussig R. Isoforms of mammalian adenylyl cyclase: multiplicities of signalling. Mol Interv. 2002;2:168–184. doi: 10.1124/mi.2.3.168. [DOI] [PubMed] [Google Scholar]
- Tang WJ, Krupinski J, Gilman AG. Expression and characterization of calmodulin-activated (type I) adenylylcyclase. J Biol Chem. 1991;266:8595–8603. [PubMed] [Google Scholar]
- Taussig R, Gilman AG. Mammalian membrane-bound adenylyl cyclases. J Biol Chem. 1995;270:1–4. doi: 10.1074/jbc.270.1.1. [DOI] [PubMed] [Google Scholar]
- Taussig R, Tang WJ, Hepler JR, et al. Distinct patterns of bidirectional regulation of mammalian adenylyl cyclases. J Biol Chem. 1994;269:6093–6100. [PubMed] [Google Scholar]
- Vanderploeg EJ, Wilson CG, Levenston ME. Articular chondrocytes derived from distinct tissue zones differentially respond to in vitro oscillatory tensile loading. Osteoarthritis Cartilage. 2008;16:1228–1236. doi: 10.1016/j.joca.2008.02.016. [DOI] [PMC free article] [PubMed] [Google Scholar]
- Varani K, De Mattei M, Vincenzi F, et al. Characterization of adenosine receptors in bovine chondrocytes and fibroblast-like synoviocytes exposed to low frequency low energy pulsed electromagnetic fields. Osteoarthritis Cartilage. 2008;16:292–304. doi: 10.1016/j.joca.2007.07.004. [DOI] [PubMed] [Google Scholar]
- Villacres EC, Wu Z, Hua W, et al. Developmentally expressed Ca2+-sensitive adenylyl cyclase activity is disrupted in the brains of type I adenylyl cyclase mutant mice. J Biol Chem. 1995;270:14352–14357. doi: 10.1074/jbc.270.24.14352. [DOI] [PubMed] [Google Scholar]
- Visel A, Alvarez-Bolado G, Thaller C, et al. Comprehensive analysis of the expression patterns of the adenylate cyclase gene family in the developing and adult mouse brain. J Comp Neurol. 2006;496:684–697. doi: 10.1002/cne.20953. [DOI] [PubMed] [Google Scholar]
- Willoughby D, Cooper DM. Organization and Ca2+ regulation of adenylyl cyclases in cAMP microdomains. Physiol Rev. 2007;87:965–1010. doi: 10.1152/physrev.00049.2006. [DOI] [PubMed] [Google Scholar]
- Wu Z, Wong ST, Storms DR. Modification of the calcium and calmodulin sensitivity of the type I adenylyl cyclase by mutagenesis of its calmodulin binding domain. J Biol Chem. 1993;268:23766–23768. [PubMed] [Google Scholar]
- Yamashita S. Heat-induced antigen retrieval: mechanisms and application to histochemistry. Prog Histochem Cytochem. 2007;41:141–200. doi: 10.1016/j.proghi.2006.09.001. [DOI] [PubMed] [Google Scholar]
- Yoon YM, Kim SJ, Oh CD, et al. Maintenance of differentiated phenotype of articular chondrocytes by protein kinase C and extracellular signal-regulated protein kinase. J Biol Chem. 2002;277:8412–8420. doi: 10.1074/jbc.M110608200. [DOI] [PubMed] [Google Scholar]