

Abstract
Purpose
To establish the feasibility of measuring the concentration of Choline (Cho) by proton MR spectroscopy (MRS) in skeletal muscle at 3T.
Materials and Methods
At 3T, Cho measurements were performed in phantoms and healthy volunteers by MRS (PRESS, TR/TE: 2000/144 ms). In vitro Cho concentrations were measured in 3 phantom solutions (10, 5, 1.25mmol). Cho T1 and T2 relaxation times were measured in muscles of 5 subjects. In vivo Cho concentrations were measured using water as an internal reference and average T1 and T2 times, in 20 muscle locations (quadriceps, hamstring) of 7 subjects (3 males, 4 females). Descriptive statistics were reported.
Results
In vitro, the average measured Cho concentrations of the 10, 5 and 1.25 mmol solutions were 9.91, 5.03 and 1.22 mmol respectively. In vivo, the average T1 and T2 relaxation times of Cho were 1372 +/−57 and 134 +/−11 ms respectively. Inter-individual variation existed (quadriceps range, 6.7–13 mmol/kg), but there was little gender or intra-individual variation.
Conclusion
In the musculoskeletal system, the measurement of Cho concentration by MRS at 3T is feasible using water as an internal reference. These data provide a quantitative basis for future investigations of metabolite concentration in normal and diseased musculoskeletal tissues.
Keywords: Proton MR Spectroscopy, Quantification, Skeletal Muscle, Choline
INTRODUCTION
Proton magnetic resonance spectroscopy (MRS) has recently found application to investigate tumor metabolism in the musculoskeletal system (1–6). MRS investigations of musculoskeletal tumors have focused on the metabolite Choline (Cho) as a marker of malignancy, as the “Cho peak” visible at 3.2 ppm of the MR spectrum contains contributions from several Cho containing compounds that are involved in the synthesis and degradation of cell membranes, characteristically altered in malignancy (7). To date, investigations of Cho metabolism in musculoskeletal tumors have relied on the qualitative assessment of the presence of a metabolite peak in a region of interest (1–4) or a relative quantification of the metabolite of interest, reporting metabolite signal-to-noise ratios (SNR) (5–6). However, such strategies are limited in that the Cho SNR can vary with many factors, including pulse sequence efficiency, magnetic field strength, the type of coil used, the distance between the region of interest and the coil, and the size of the lesion involved. Therefore, in performing clinical proton MRS, there is a need for a more robust method of metabolite quantification that overcomes these limitations.
A number of metabolite quantification techniques have been proposed for determining metabolite concentration by MRS, and applied mostly in the brain (8–16). These techniques generally involve the comparison of in vivo metabolite signals from a region of interest with an external or internal reference of known concentration. As an external reference, a voxel is placed in a phantom solution containing a compound at a known concentration near the site of interest (8–12, 16). However, the latter technique is not ideal, as variations in coil geometry and homogeneity can affect the measurements. The external reference method is also time-consuming and labor-intensive, features that are not suitable for clinical applications. On the other hand, with a method which relies on an internal reference compound, such as water, comparison is made to a known endogenous compound that has a defined concentration. Indeed, such quantification methods have been utilized in the brain and breast (13–17). In the musculoskeletal system, there are reports regarding the absolute quantification of Cho, performed at 2T (18) as well as reports regarding the absolute quantification of Creatine (Cr) at 1.5T (19, 20) and lipids at 1.5T (21). However, a robust metabolite quantification method with an internal referencing technique has not been implemented in the musculoskeletal system at 3T, where increased signal compared with lower field strength systems is expected to provide improved spectral resolution and quantification of metabolites.
The purpose of this study was to develop an absolute quantification method for the determination of in vivo Cho concentration in the musculoskeletal system at 3T, using MRS. First, phantom studies were performed with known Cho concentrations to validate the quantification procedure. Second, in order to correct for relaxation time effects, in vivo T1 and T2 relaxation times of Cho in the musculoskeletal system at 3T were determined. Finally, the quantification procedure was tested in a group of healthy volunteers in various skeletal muscle groups to obtain Cho concentrations.
METHODS AND MATERIALS
Overview
MRS methodology for the determination of the absolute Cho concentration, previously described for lesions of the breast (13), was implemented in the musculoskeletal system at 3T in two phases. First, a series of phantom solutions containing known Cho concentrations were assessed by MRS. Calculating Cho concentration requires knowledge of the T1 and T2 relaxation times of Cho and water at 3T in the in vitro solutions, parameters which were measured as part of this experiment. A comparison was made of Cho concentration measured by MRS with the true concentrations. Second, the Cho concentration within 20 voxels located in various skeletal muscles of 7 healthy volunteers was calculated. T1 and T2 relaxation times of Cho at 3T in vivo were measured as part of this experiment. Intra-individual and inter-individual comparisons of Cho concentration were performed. This study was approved by our Institutional Review Board and informed consent was obtained from all subjects prior to the performance of the study.
Quantification Method
Choline concentrations, in units of mmol/kg, were estimated using the non-suppressed water peak as an internal reference compound, a method previously described for lesions in the breast at lower field strength (13, 14). This method was modified for use in the musculoskeletal system, with the addition of two correction factors (CFH2O × CFLipid), described below, to account for the relative amount of water and lipid within the localized voxel:
| [1] |
where SCho = Integral value of Cho peak at 3.2 ppm, SH2O = Integral value of the non-suppressed water signal, nH2O = 2, nCho = 9 (from 3 CH3 groups), MW = 18.0153 x 10⁻⁶ kg/mmol, f T1 = 1− exp (−TR/T1), fT2 = exp (−TE/T2); CFH2O is 0.77 (i.e. 77% water content of muscle), which is believed to be relatively constant between different muscle groups, both in normal and diseased states (19, 22–23); CFLipid represents a correction factor that accounts for the lipid content within each voxel, as muscle lipid content is variable (22) and chemical shift displacement artifact may increase lipid content within a voxel, and is equivalent to SH2O/(SH2O + SLipid) measured from the non-suppressed spectrum. (Note that the option for preventing chemical shift artifact, as is a common practice in other body locations, by setting the transmitter to the Cho resonance for the water-suppressed spectra and resetting it to water for the water-unsuppressed scan, was considered, but determined to be impractical in a clinical setting.)
MR Imaging and MRS
All studies were performed on a 3T MR system (MAGNETOM Trio, Siemens Medical Solutions, Malvern, PA) using a flexible phased array body-matrix coil. For the in vitro measurements, MR imaging consisted of axial and coronal localizer sequences for positioning of a single voxel (12×12×20 mm3) within each phantom solution. For the in vivo measurements, MR imaging consisted of scout images followed by an axial fat suppressed T2 weighted sequence (fast spin-echo, TR/TE 2886/100, FOV 20cm, slice thickness 6mm) of the thigh of each subject, obtained for voxel placement. A single voxel (20×20×40 mm3) was positioned within the skeletal muscle of interest such that the voxel was located entirely within muscle, with careful exclusion of adjacent subcutaneous fat and osseous structures.
Spectroscopy was performed using a point-resolved spectroscopy sequence (PRESS) (repetition time (TR)/echo time (TE) = 2000/135ms). An intermediate TE of 144 ms was chosen in anticipation of developing a method that would be applicable to the musculoskeletal system where, unlike the brain, a large amount of lipid is present; at an intermediate TE of 135 ms, the lipid signal is reduced, as lipid has a short T2, and is less likely to interfere with neighboring peaks than at a shorter TE. T1 and T2 relaxation times were measured, by varying the TR and TE, with no water suppression. For T1 measurements, TE was kept constant (30ms) and TR varied from 0.5s to 30s; for T2 measurements, TR was kept constant (3000ms) and TE varied from 30 ms to 700 ms. For measurement of Cho concentration, the MRS PRESS sequence was applied in each location twice, one with water suppression (128 averages) and one without water suppression (16 averages). No lipid suppression was applied. Automatic and manual shimming was performed to optimize the signal. Scan time was 4 minutes for the water-suppressed scan and less than 1 minute for the scan performed without water suppression.
MRS Data Processing
Spectroscopy data were analyzed using a jMRUI (java version, Magnetic Resonance User Interface) semi-automated method. Spectra were processed by applying a high-pass convolution filter to remove the residual water signal in the time-domain, with zero-order phase correction based on the water peak, and zero-filling by a factor of 2. The peak integral values of the Cho signal at 3.2 ppm and the non suppressed water signal at 4.7 ppm were quantified using curve-fitting to Gaussian lines. Fitting of both the Cho and neighboring Cr peaks in vivo was performed for reliable identification and quantification of the metabolites. With the time-domain analysis method utilized, the amplitude of the signal was measured rather than the line shape; as such, there was no significant contribution of the Creatine peak area to the calculation of the Cho peak area. The quality of the spectra was recorded based on visibility of a discrete Cho peak at 3.2ppm, Cho linewidth (≤5 Hz in phantoms and ≤ 10 Hz in vivo), clear separation of Cho and Cr peaks in vivo, and the absence of artifacts. Finally, this semi-automated quantification approach was chosen over other automated approaches such as the Linear Combination of Model (LCModel) and Quantum ESTimation (QUEST) (24), as the latter require a basis set (in some cases determined from in vitro data (25) and may be limited for use in the in vivo setting.
In Vitro phantom studies
Three aqueous solutions of choline chloride were prepared (10 mmol, 5mmol, 1.25mmol) in tubes of 10cm length and 3 cm diameter. These concentration values were chosen to reflect Cho concentration observed in normal tissue and malignant tumors in other organ systems that generally vary between 1 and 10 mmol/kg (12–14). T1 and T2 relaxation times of Cho and water were determined as described above, and Cho concentrations estimated using equation 1.
In-vivo implementation and determination of Cho concentration at 3T
T1 and T2 relaxation times were measured in five healthy subjects at rest, in different proximal skeletal muscles (3 vastus medialis, 2 hamstring) according to the methodology described above. The 5 subjects consisted of 3 males and 2 females, with mean age of 38.4 years and age range 28–50 years. T1 relaxation times were re-measured in one subject, four weeks apart, to confirm the reproducibility of the measurements. The average T1 and T2 relaxation times were calculated.
The average T1 and T2 relaxation times for Cho and water at 3T were used to estimate Cho concentration in 20 voxels in the muscles of 7 healthy subjects. The 7 subjects consisted of 3 males and 4 females, with mean age of 37.7 years and age range 28–50 years. The muscles examined were of the quadriceps muscle group (vastus medialis, vastus intermedius) and hamstring muscle group (biceps femoris). An MRS PRESS sequence was applied in each location on a 3T system as detailed above. To confirm the reproducibility of the measurements, three sets of Cho concentration measurements in the vastus intermedius muscle were repeated, three times each in the same individual (one set in the morning on the left side, one set in the morning on the right side, and one set in the afternoon of the same day on the left side). Descriptive statistics were reported for the calculated Cho concentrations along with intra-individual and inter-individual variation.
RESULTS
Phantom Studies
For the phantom solutions, the average T1 and T2 relaxation times of Cho were 1826 ± 11 msec and 632 ± 3 msec respectively. The average T1 and T2 relaxation times of water were 2731 ± 37 and 1754 ± 123 msec respectively. Calculated Cho concentrations for the phantoms are shown in Table 1. The calculated Cho concentrations were in excellent agreement with the known values of Cho concentration in each phantom.
TABLE 1.
Cho concentration determined by MRS in phantom model
| Phantom (mmol solution) | T1 Cho | T1 Water | T2 Cho | T2 Water | Cho Concentration | Cho Concentration Using Average T1/T2 |
|---|---|---|---|---|---|---|
| 10 | 1881 | 2262 | 631 | 1869 | 10.05 | 9.91 |
| 5 | 1859 | 2736 | 627 | 1769 | 5.05 | 5.03 |
| 1.25 | 1738 | 2797 | 637 | 1623 | 1.18 | 1.22 |
| Average | 1826 | 2731 | 632 | 1754 |
In vivo study
Shimming in vivo resulted in well-separated Cho and Creatine peaks and a Cho line width of 6 to 8Hz in normal muscle. Figures 1 and 2 show representative spectra obtained from quadriceps and hamstring muscles respectively. For each of the 5 healthy subjects, T1 and T2 relaxation time measurements were performed with 13 different TR and TE times, respectively. The T1 and T2 times of Cho and water for each of the subjects are shown in Table 2 and a representative measurement in Figure 3. The measurement of T1 relaxation time was reproducible in volunteer 2 (1408 ms and 1398 ms for Cho, 1498 ms and 1407 ms for water) with small intra-individual measurement variation, (variation of less than 1% for Cho and 6.5% for water). Inter-individual measurement variation was also acceptable, ranging from 2.5% to a maximum of 8.2%, less than that observed in several studies the literature (23–24, 26).
Figure 1.
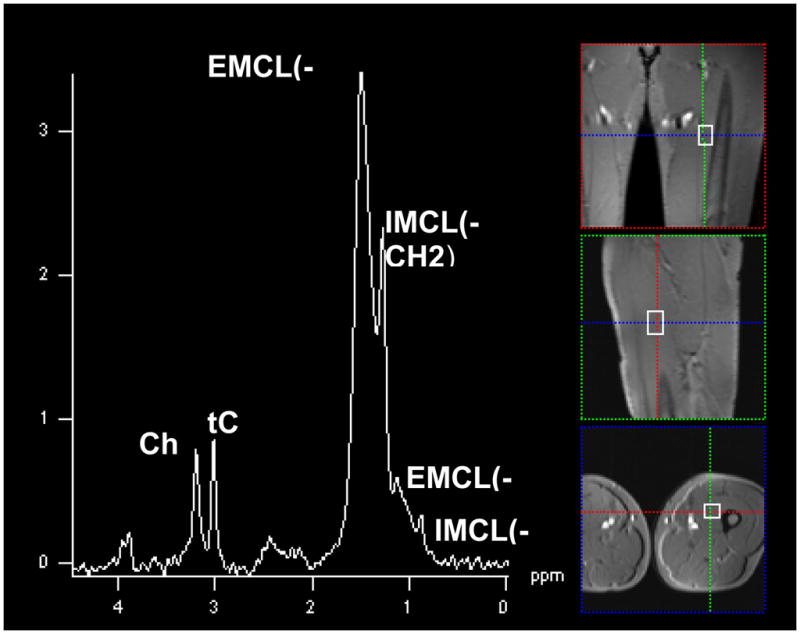
SV-MRS obtained in Volunteer 6 within the left quadriceps muscle.
Voxel size is (20×20×30) mm3, TR=3000ms, TE=135 ms. Note the characteristic spectral signature of normal skeletal muscle containing both Choline (cho) and total Creatine (tCr) peaks, unlike that of musculoskeletal tumors [6]. EMCL and IMCL represent the extramyocellular and intramyocellular lipids.
Figure 2.

SV-MRS obtained in Volunteer 6 within the right hamstring muscle, (PRESS, voxel size is 20×20×40 mm3, TR=2000ms, TE=135ms). Again, note the characteristic spectral signature of normal skeletal muscle containing both Cho and tCr peaks with the EMCL and IMCL lipid peaks identified.
Table 2.
Metabolite biologic parameters determined by MRS in healthy volunteers
| Subject | T1 Relaxation Time (ms) | T2 Relaxation Time (ms) | ||
|---|---|---|---|---|
| Cho | Water | Cho | Water | |
| 1 | 1430 | 1518 | 132 | 41 |
| 2 | 1408 | 1498 | 142 | 41 |
| 2 | 1398 | 1407 | - | - |
| 3 | 1331 | 1486 | 148 | 39 |
| 4 | 1386 | 1449 | 129 | 40 |
| 5 | 1276 | 1511 | 109 | 39 |
| Average | 1372 | 1478 | 134 | 40 |
| Standard Error | 23.4 | 17.4 | 6.7 | 0.42.5% |
| Coefficient of Variation (SD/mean) | 4.2% | 2.9% | 8.2% | |
Figure 3.


Measurement of T1 and T2 relaxation times of Cho in volunteer 2.
Figure 3a. Measurement of T1 relaxation time using TE 30 ms and numerous TRs between 500 ms and 30000 ms. The curve represents variations of the peak integral value of Cho as a function of TR.
Figure 3b. Figure 3b. Measurement of T2 relaxation time using TR 3000 ms and numerous TEs between 30 ms and 700 ms. The curve represents variations of the peak integral value of Cho as a function of TE.
Utilizing the calculated average T1 and T2 relaxation times for Cho and water at 3T, Cho concentration within various skeletal muscle locations of 7 healthy subjects were calculated and shown in Table 3.
TABLE 3.
Quantification of Cho by proton MRS at 3T in 7 healthy volunteers
| Subject | Gender | Age | Voxel Location | Cho Concentration (mmol/kg) |
|---|---|---|---|---|
| 1 | F | 32 | RQ | 9.0 |
| 2 | M | 50 | RQ | 10.1 |
| LQ | 10.1 | |||
| LQ | 11.6 | |||
| RH | 5.2 | |||
| 3 | F | 28 | RQ | 11.7 |
| 4 | F | 44 | RH | 10.9 |
| 5 | F | 34 | RQ | 10.9 |
| 6 | M | 47 | LQ | 10.2 |
| RQ | 11.1 | |||
| RH | 7.3 | |||
| 7 | M | 34 | LQ* | 10.0 |
| LQ* | 7.7 | |||
| LQ* | 10.9 | |||
| RQ* | 8.5 | |||
| RQ* | 7.9 | |||
| RQ* | 6.7 | |||
| LQ^ | 12.2 | |||
| LQ^ | 11.9 | |||
| LQ^ | 13.0 | |||
| Quadriceps [Cho] Average ± SE | 10.0 ± 0.4 | |||
| Hamstring [Cho] Average ± SE | 7.8 ± 1.7 | |||
RQ=Right quadriceps
LQ=Left quadriceps
RH=Right hamstring
performed in the morning
performed in the afternoon
Cho concentration estimates were also shown to be reproducible: Cho concentration was measured in three sets of muscles, three times each, in one individual, yielding average Cho concentration of 9.5 ± 1.6, 7.7 ± 0.9 and 12.4 ± 0.7 mmol/kg with coefficients of variation of 16.8%, 11.7% and 5.6% respectively.
Little intra-individual variation in Cho concentration existed between the right and left muscle groups: Comparing the right and left quadriceps muscles in the same individuals yielded little right to left variability for volunteer 7 (right vs left, 7.7 ± 0.9 mmol/kg vs 9.5 ± 1.7 mmol/kg, p=0.16), volunteer 2 (right vs left, 10.1 vs 10.9 ± 1.1 mmol/kg) and volunteer 6 (right vs left, 11.1 vs 10.2 mmol/kg). However, comparing morning and afternoon measurements in the same muscle of the same individual, the average Cho concentration was 9.5 ± 1.7 mmol/kg and 12.4 ± 0.6 mmol/kg respectively, p=0.05.
Inter-individual variation in measured [Cho] existed between muscle groups but was not significant. Comparing the quadriceps muscles with the hamstring muscles, the average Cho concentration was 10.0 ± 1.7 mmol/kg and 7.8 ± 2.9 mmol/kg respectively, p=0.059. Little gender-related variation was observed: The average Cho concentration of the quadriceps muscle group in males compared with females was 10.1 ± 1.8 mmol/kg vs. 10.5 ± 1.4 mmol/kg respectively, p=0.7.
DISCUSSION
These data demonstrate the feasibility of measuring the concentration of Cho by MRS in musculoskeletal system, using water as an internal reference compound, at 3T. Normative Cho and water T1 and T2 relaxation times are also presented. The development of a non-invasive quantitative measure of Cho by proton MRS in the musculoskeletal system is important, since Cho content has been shown to aid in the assessment of musculoskeletal tumor characterization, grade and post-treatment evaluation (1–6) and may be altered in diseased muscle (27). While previous studies have measured Cho content qualitatively (1–4, 27) or with a relative quantification measure (5–6), the current study is the first that we are aware of that reports the absolute quantification of Cho using water as an internal reference compound at 3T in the musculoskeletal system.
In the musculoskeletal system, Cho levels in normal tissue (bone, joint elements, fascia, fat) are usually too low to be detected by in vivo MRS, except for muscle itself. For clinical MRS examinations, Cho T1 and T2 relaxation times cannot be measured for each individual at the time of a clinical exam, as measurements are too time-consuming. Also, although T1 and T2 values may be obtained in vitro in solution, it is important to measure relaxation times in vivo, in view of the large number of parameters that affect these values such as pH, temperature, ions, proteins and cellular structures (15). Thus, our computation of T1 and T2 relaxation times of water and Cho in vivo was necessary to provide reasonable estimates of these values that may be applied for general use in calculating Cho concentration in the musculoskeletal system by MRS.
A number of studies have reported the relaxation times of skeletal muscle metabolites. At 3T, Krssak et al measured the T1 and T2 relaxation times of metabolites in two skeletal muscle locations in the calf, reporting ranges for water (1377–1387 ms and 28–131.3 respectively) and for trimethylammonium (TMA, a Cho containing compound) (945–1010 ms and 78–119 ms respectively)(26). At 2T, Bruhn et al measured the T1 and T2 relaxation times of Cho in skeletal muscle as 1150 and 110 ms respectively (18). At 1.5T, Schick et al (28) measured Cho T1 and T2 relaxation times as 1100 and 190 ms respectively. Similarly, Bongers et al (27) reported T1 and T2 relaxation times of Cho in the range 1100–1600 and 150–210 at 1.5T. These values are similar to the T1 and T2 relaxation times of Cho (1372 and 134 ms respectively) and water (1478 and 40 ms respectively) determined in the current study at 3T. Differences are attributable to the known behavior of metabolite relaxation times that vary significantly with the magnetic field strength, namely small increases in T1 and decreases in T2 with increasing field strength (29). Second, this study differs from prior studies in that T1 and T2 relaxation times were measured in several individuals and various muscle groups with a larger number of measurement points. In the prior studies, fewer measurement points were obtained; for example, in Bruhn et al, only 3 measurements in one individual were performed for the determination of Cho T1 and T2 relaxation times (18) and in the study by Krssak et al, 5–7 measurements were performed for the determination of the relaxation times (26). In contrast, we performed 13 measurements for each determination of the T1 and T2 relaxation times in 5 individuals, for a total of 130 measurements, with repeat measurements in one individual to confirm reproducibility. We observed very small differences between normal individuals (a maximum of 4.2% for T1 relaxation times and a maximum of 8.2% for T2 measurements) and few regional differences between muscle groups in the T1 and T2 values (in comparison to the report by Bonger et al that relayed up to 20% variation in measurements (27) and the study of Krssak et al that relayed up to 17.6% variation in measurements (26). An important finding of the Bongers et al study (27) was that T1 and T2 relaxation times measured within diseased tissue demonstrated no significant differences to those from normal muscle.
Cho concentrations were measured in the skeletal muscles of seven individuals in twenty voxels. There was little intra-individual variation, but although not statistically significant, much inter-individual variation in Cho concentration between different muscle groups was observed, as was shown at lower field strength (17), with the average quadriceps Cho concentration (10.0 mmol/kg) higher than the average hamstring Cho concentration (7.8 mmol/kg). Furthermore, Cho content, as measured by relative Cho signal has been observed to vary between muscle groups (30). The source of variability is probably due to physiologic factors, such as the fiber type and activity level of each muscle group. In addition, the effects of gender, age, race and athletic condition on Cho concentration in normal skeletal muscle is not fully understood, although these factors are known to affect Cr metabolism (22, 31–34). Bottomley et al (19) reported the variability of Cr concentration between 21.5 and 36.2 mmol/kg in different muscle groups and individuals, results that parallel our observation on the variability of Cho concentration. The variability observed between muscle groups and individuals supports the need for future investigations into normal skeletal muscle metabolism.
In tumors of the musculoskeletal system, Cho metabolism has been studied to a limited degree. At 1.5T and 3T, the Cho content as measured qualitatively (as the presence of discrete Cho peaks in the spectrum) and with relative quantification measures (as Cho SNRs), has been shown to be significantly different for benign and malignant entities, may relate to tumor grade and be affected in the post-treatment setting (1–6). However, the range of Cho concentration present in musculoskeletal malignancy is unknown. With this work, a method has been established for determining Cho concentration in the musculoskeletal system and may now be implemented for the determination of musculoskeletal tumor concentrations. The natural variation observed between individuals and between muscle groups suggests that normal skeletal muscle Cho concentration may be an unpredictable reference parameter for comparison in the assessment of tumors. While water referencing may be more reliable, it does depend on the assumption of a constant water content, which is most likely not true for all lesions.
A number of limitations of this study exist. First, our sample size was small. Nevertheless, the Cho concentration measurements were reproducible. The etiology of the observed inter-individual variation in Cho concentration cannot be deciphered from this study. Our intention for this study was primarily to establish the feasibility of this quantification method, validating and implementing it for determining Cho concentration in the musculoskeletal system at 3T, and not for exploring Cho concentration variability.
Second, it has been suggested that T2 relaxation times may be affected by muscle orientation (35), although metabolite concentration is not (36). In addition, according to Li et al (37), while T1 relaxation times of Cho in the brain are stable between normal and diseased white matter, T2 relaxation times differ between normal and diseased states in the brain. Such a fact argues that T2 relaxation times are more affected by the integrity and composition of the tissues. It is unclear from our data if measured differences in Cho concentration between muscle groups and individuals are anatomical (due to tissue structure modification that affects T2 measurements) or biochemical (due to true changes of Cho metabolite levels). Ideally, histologic confirmation of our measured Cho concentration in vivo would be obtained, but such a proposal is not practical. In addition, measuring Cho content in biopsy specimens is potentially inaccurate (19).
Third, the success of shimming the magnet for homogeneity prior to the MRS measurement heavily affects the signal observed in the spectrum and our ability to quantify the metabolite content. In the muscles of our normal volunteers, the Cho line width was 6 to 8 Hz. It is possible that in diseased states and other body locations, shimming will not be as satisfactory, though measures of Cho SNR in musculoskeletal pathology have largely been successful, with a reported failure rate of approximately 13% at 3T (6).
In conclusion, this work lays a foundation for future investigations of Cho by proton MRS in the musculoskeletal system. As a tool for studying sources of physiologic and pathologic variability, MRS is advantageous as a non-invasive measure of Cho concentration in musculoskeletal pathology, particularly with potential application to musculoskeletal lesion characterization and determination of therapeutic response. For future investigation, multiple avenues of study are warranted, including the comprehensive exploration of inter-individual and intra-individual Cho concentration variation, as well as alternative MRS quantitation schemes for the musculoskeletal system.
Acknowledgments
This work was made possible by the support of the 2004 Young Investigator’s Award from the Society of Body CT and MRI, the 2007 William M.G. Gatewood M.D. Fellowship and the 2008 General Electric-Association of University Radiologists Radiology Research Academic Fellowship (GERRAF).
GRANT SUPPORT:
1. 2004 Young Investigator’s Award from the Society of Body CT and MRI
2. 2007 William M.G. Gatewood M.D. Fellowship
3. 2008 General Electric-Association of University Radiologists Radiology Research Academic Fellowship (GERRAF).
References
- 1.Oya N, Aoki J, Shinozaki T, Watanabe H, Takagishi K, Endo K. Preliminary study of proton magnetic resonance spectroscopy in bone and soft tissue tumors: an unassigned signal at 2.0–2.1 ppm may be a possible indicator of malignant neuroectodermal tumor. Radiat Med. 2000;18:193–8. [PubMed] [Google Scholar]
- 2.Wang CK, Li CW, Hsieh TJ, Chien SH, Liu GC, Tsai KB. Characterization of bone and soft-tissue tumors with in vivo 1H MR spectroscopy: initial results. Radiology. 2004;232:599–605. doi: 10.1148/radiol.2322031441. [DOI] [PubMed] [Google Scholar]
- 3.Sah PL, Sharma R, Kandpal H, Seith A, Rastogi S, Bandhu S, Jagannathan NR. In vivo proton spectroscopy of giant cell tumor of the bone. AJR. 2008;290:W133–139. doi: 10.2214/AJR.07.2802. [DOI] [PubMed] [Google Scholar]
- 4.Bongers H, Schick F, Skalej M, Hess CF, Jung WI. Localized in vivo 1H spectroscopy of human bone and soft tissue tumors. Eur Radiol. 1992:459–464. [Google Scholar]
- 5.Fayad LM, Bluemke DA, McCarthy EF, Weber KL, Barker PB, Jacobs MA. Musculoskeletal tumors: use of proton MR spectroscopic imaging for characterization. J Magn Reson Imaging. 2006;23:23–8. doi: 10.1002/jmri.20448. [DOI] [PubMed] [Google Scholar]
- 6.Fayad LM, Barker PB, Jacobs MA, Eng J, Weber KL, Kulesza P, Bluemke DA. Characterization of musculoskeletal lesions on 3-T proton MR spectroscopy. AJR. 2007;188:1513–1520. doi: 10.2214/AJR.06.0935. [DOI] [PubMed] [Google Scholar]
- 7.Hara T, Bansal A, DeGrado TR. Choline transporter as a novel target for molecular imaging of cancer. Mol Imaging. 2006;5:498–509. [PubMed] [Google Scholar]
- 8.Helms G. A precise and user-independent quantification technique for regional comparison of single volume proton MR spectroscopy of the human brain. NMR Biomed. 2000;13:398–406. doi: 10.1002/1099-1492(200011)13:7<398::aid-nbm660>3.0.co;2-w. [DOI] [PubMed] [Google Scholar]
- 9.Schirmer T, Auer DP. On the reliability of quantitative clinical magnetic resonance spectroscopy of the human brain. NMR Biomed. 2000;13:28–36. doi: 10.1002/(sici)1099-1492(200002)13:1<28::aid-nbm606>3.0.co;2-l. [DOI] [PubMed] [Google Scholar]
- 10.Danielsen ER, Michaelis T, Ross BD. Three methods of calibration in quantitative proton MR spectroscopy. J Magn Reson B. 1995;106:287–291. doi: 10.1006/jmrb.1995.1046. [DOI] [PubMed] [Google Scholar]
- 11.Tofts PS, Wray S. A critical assessment of methods of measuring metabolite concentrations by NMR spectroscopy. NMR Biomed. 1988;1:1–10. doi: 10.1002/nbm.1940010103. [DOI] [PubMed] [Google Scholar]
- 12.Li CW, Kuo YC, Chen CY, et al. Quantification of choline compounds in human hepatic tumors by proton MR spectroscopy at 3 T. Magn Reson Med. 2005;53:770–776. doi: 10.1002/mrm.20412. [DOI] [PubMed] [Google Scholar]
- 13.Bolan PJ, Meisamy S, Baker EH, et al. In vivo quantification of choline compounds in the breast with 1H MR spectroscopy. Magn Reson Med. 2003;50:1134–1143. doi: 10.1002/mrm.10654. [DOI] [PubMed] [Google Scholar]
- 14.Baik HM, Su MY, Yu H, et al. Quantification of choline-containing compounds in malignant breast tumors by 1H MR spectroscopy using water as an internal reference at 1.5 T. MAGMA. 2006;19:96–104. doi: 10.1007/s10334-006-0032-4. [DOI] [PubMed] [Google Scholar]
- 15.Frahm J, Bruhn H, Gyngell ML, Merboldt KD, Hanicke W, Sauter R. Localized proton NMR spectroscopy in different regions of the human brain in vivo. Relaxation times and concentrations of cerebral metabolites. Magn Reson Med. 1989;11:47–63. doi: 10.1002/mrm.1910110105. [DOI] [PubMed] [Google Scholar]
- 16.Ozdemir MS, Reyngoudt H, De Deene Y, et al. Absolute quantification of carnosine in human calf muscle by proton magnetic resonance spectroscopy. Phys Med Biol. 2007;52:6781–6794. doi: 10.1088/0031-9155/52/23/001. [DOI] [PubMed] [Google Scholar]
- 17.Soher BJ, Hurd RE, Sailasuta N, Barker PB. Quantitation of automated single-voxel proton MRS using cerebral water as an internal reference. Magn Reson Med. 1996;36:335–339. doi: 10.1002/mrm.1910360302. [DOI] [PubMed] [Google Scholar]
- 18.Bruhn H, Frahm J, Gyngell ML, Merboldt KD, Hanicke W, Sauter R. Localized proton NMR spectroscopy using stimulated echoes: application to human skeletal muscle in vivo. Magn Reson Med. 1991;17:82–94. doi: 10.1002/mrm.1910170113. [DOI] [PubMed] [Google Scholar]
- 19.Bottomley PA, Lee Y, Weiss RG. Total creatine in muscle: Imaging and quantification with proton MR spectroscopy. Radiology. 1997;204:403–410. doi: 10.1148/radiology.204.2.9240527. [DOI] [PubMed] [Google Scholar]
- 20.Rico-sanz J, Hajnal JV, Thomas EL, Mierisova S, Ala-korpela M, Bell JD. Intracellular and extracellular skeletal muscle triglyceride metabolism during alternating intensity exercise in humans. J of Physiology. 1998;510:615–622. doi: 10.1111/j.1469-7793.1998.615bk.x. [DOI] [PMC free article] [PubMed] [Google Scholar]
- 21.Barany M, Venkatasubramanian PN, Mok E, et al. Quantitative and qualitative fat analysis in human leg muscle of neuromuscular diseases by 1H MR spectroscopy in vivo. Magn Reson Med. 1989;10:210–226. doi: 10.1002/mrm.1910100206. [DOI] [PubMed] [Google Scholar]
- 22.Forsberg AM, Nilsson E, Werneman J, Bergstrom J, Hultman E. Muscle composition in relation to age and sex. Clin Sci. 1991;81:249–256. doi: 10.1042/cs0810249. [DOI] [PubMed] [Google Scholar]
- 23.Ronzoni E, Wald S, Berg L, et al. Distribution of high energy phosphate in normal and dystrophic muscle. Neurology. 1958;8:359–368. doi: 10.1212/wnl.8.5.359. [DOI] [PubMed] [Google Scholar]
- 24.Shen ZW, Chen YW, Wang HY, et al. Quantification of metabolites in swine brain by 1H MR spectroscopy using LCModel and QUEST: A comparison study. IEEE Congress on Image and Signal Processing. 2008:299–302. [Google Scholar]
- 25.Provencher SW. Estimation of metabolite concentrations from localized in vivo proton NMR spectra. Magn Reson Med. 1993;30:672–679. doi: 10.1002/mrm.1910300604. [DOI] [PubMed] [Google Scholar]
- 26.Krssak M, Mlynarik V, Meyerspeer M, Moser E, Roden M. 1H NMR relaxation times of skeletal muscle metabolites at 3T. MAGMA. 2004;16:155–159. doi: 10.1007/s10334-003-0029-1. [DOI] [PubMed] [Google Scholar]
- 27.Bongers H, Schick F, Skalej M, Jung W, Stevens A. Localized in vivo 1H spectroscopy on human skeletal muscle: normal and pathologic findings. Magnetic Resonance imaging. 1992;10:957–964. doi: 10.1016/0730-725x(92)90450-e. [DOI] [PubMed] [Google Scholar]
- 28.Schick F, Eismann B, Jun W, Bonger H, Bunse M, Lutz O. Comparison of localized proton NMR signals of skeletal muscle and fat tissue in vivo: two lipid compartments in muscle tissue. Magn Reson Med. 1993;29:158–167. doi: 10.1002/mrm.1910290203. [DOI] [PubMed] [Google Scholar]
- 29.Barker PB, Hearshen DO, Boska MD. Single-voxel proton MRS of the human brain at 1.5T and 3.0T. Magn Reson Med. 2001;45:765–769. doi: 10.1002/mrm.1104. [DOI] [PubMed] [Google Scholar]
- 30.Hu J, Xia Y, Shen Y, Li J, Zuo CS, Xuan Y, Jiang Q. Significant differences in proton trimethyl ammonium signals between human gastrocnemius and soleus muscle. J Magn Reson Imaging. 2004;19:617–622. doi: 10.1002/jmri.20036. [DOI] [PubMed] [Google Scholar]
- 31.Edstrom L, Hultman E, Sahlin K, Sjoholm H. The contents of high-energy phosphates in different fibre types in skeletal muscles from rat, guinea-pig and man. J Physiol. 1982;332:47–58. doi: 10.1113/jphysiol.1982.sp014399. [DOI] [PMC free article] [PubMed] [Google Scholar]
- 32.Kreis R, Koster M, Kamber M, Hopperler H, Boesch C. Peak assignment in localized 1H MR spectra of human muscle based on oral creatine supplementation. Magn Reson Med. 1997;37:159–163. doi: 10.1002/mrm.1910370202. [DOI] [PubMed] [Google Scholar]
- 33.Kreis R, Boesch C. Spatially localized, one-and two-dimensional NMR spectroscopy and in vivo application to human muscle. J Magn Reson Ser B. 1996;113:103–118. doi: 10.1006/jmrb.1996.0163. [DOI] [PubMed] [Google Scholar]
- 34.Boesch C, Slotboom H, Hoppeler H, Kreis R. In vivo determination of intra-myocellular lipids in human muscle by means of localized 1H MR spectroscopy. Magn Reson Med. 1997;37:484–493. doi: 10.1002/mrm.1910370403. [DOI] [PubMed] [Google Scholar]
- 35.Xia Y. Relaxation anisotropy in cartilage by NMR microscopy (uMRI) at 14 um resolution. MRM. 1998;39:941–949. doi: 10.1002/mrm.1910390612. [DOI] [PubMed] [Google Scholar]
- 36.Gao F, Bottomley PA, Arnold C, Weiss RG. The effect of orientation on quantification of muscle creatine by 1H MR spectroscopy. Mag Res Imaging. 2003;21:561–566. doi: 10.1016/s0730-725x(03)00073-0. [DOI] [PubMed] [Google Scholar]
- 37.Li Y, Srinivasan R, Ratiney H, Lu Y, Chang SM, Nelson SJ. Comparison of T1 and T2 metabolite Relaxation times in glioma and normal brain at 3T. JMRI. 2008;28:342–350. doi: 10.1002/jmri.21453. [DOI] [PMC free article] [PubMed] [Google Scholar]