

Abstract
Prior research has found strong evidence of a prospective association between R movie exposure and teen smoking. Using parallel process latent-growth modeling, the present study examines prospective associations between viewing of music video channels on television (e.g., MTV and VH-1) and changes over time in smoking and association with smoking peers. Results showed that baseline viewing of music-oriented channels such as MTV and VH-1 robustly predicted increasing trajectories of smoking and of associating with smoking peers, even after application of a variety of controls including parent reports of monitoring behavior. These results are consistent with the arguments from the reinforcing spirals model that such media use serves as a means of developing emergent adolescent social identities consistent with associating with smoking peers and acquiring smoking and other risk behaviors; evidence also suggests that media choice in reinforcing spiral processes are dynamic and evolve as social identity evolves.
Recent research suggests one of the strongest influences on youth smoking and alcohol use is the viewing of R-rated movies, in which the portrayal of substance use is frequent and salient (Dalton et al., 2003). Substance use portrayals are also frequent on cable channels such as MTV and VH-1 that focus on contemporary pop music and lifestyle (see Smith, 2005). Unlike R-rated movies, younger teens have relatively unrestricted access to such cable channels, and such channels are widely viewed by adolescents (Kaiser Family Foundation, 2001). The present study examines the influence of MTV and VH-1 viewership on smoking among adolescents, using a national probability sample of youth and a four-wave panel design.
In so doing, we also employ the reinforcing spirals model (Slater, 2007) to propose a theoretical explanation for such effects that focus on the role of media use in adolescent social identity formation. The reinforcing spirals model conceptualizes media use as endogenous; media content consonant with existing or developing social identity is selected by readers or viewers, and in turn reinforce such identities, with continuing selection of media content that is identity-consistent.
Discussions of such media effects on adolescent behavior often rely on social cognitive theory (Bandura, 2002) as an explanatory mechanism—that youth acquire behaviors by observing attractive models. The reinforcing spirals model suggests that such effects are embedded in larger social and developmental processes. Media such as MTV or VH-1, the reinforcing spirals model suggests, are sought out by some adolescents in order to explore peer-centered norms and values as part of their process of adolescent identity formation. This mediated socialization experience (see also Arnett, 1995; Kelly & Donohew, 1999) may serve as a bridge between earlier, family-approved associations to associating with peers accepting of behaviors such as cigarette smoking.
Tobacco Portrayals on Television Music Channels
A 2003 study indicates that 75% of 16–24 year olds in a national random sample watched MTV, 20% for an hour or more per day (Kaiser Family Foundation, 2001). A 1997 study of music videos found that 25.7% of the MTV music videos in the sample portrayed tobacco use (DuRant, Rome, Rich, Allred, Emans, & Woods, 1997). A White House-sponsored study of 300 music videos (100 each from MTV, VH-1, and BET) from a sample drawn in 2000 found that 21% of the videos portrayed tobacco use, plus another 6% showed smoke that might have been tobacco or marijuana (Roberts, Christenson, Henrisksen & Bandy, 2002); many of the instances of tobacco use were on BET, with tobacco use portrayals at 16% for VH-1 and 11% for MTV. Another study of 359 music videos from MTV and BET conducted during autumn 2001 found that 10% of the videos included tobacco products, with 80% of these videos showing tobacco use (Gruber, Thau, Hill, Fisher & Grube, 2005). An analysis of The Osbournes, a popular celebrity reality show on MTV, found 16 instances of tobacco use (either visual or part of talk/discussion) during the 10 episodes coded (Blair, Yue, Singh & Bernhardt, 2005). In short, tobacco use portrayals are commonplace on MTV-type programming, though the exact extent varies across different samples and studies.
Evidence for Entertainment Smoking Portrayal Effects on Youth Smoking
A series of studies has assessed the impact of smoking portrayals in movies on youth smoking (Dalton et al., 2003; Sargent et al., 2004). These studies have incorporated extensive content analyses of the major movies released in the U.S. during study periods, and have assessed adolescent viewership of these movies with large and heterogeneous samples of adolescents. Analyses include extensive statistical controls for youth and parent behavior and parenting style. These studies indicate that viewing of R-rated movies in which smoking is commonplace is a strong and significant prospective predictor of youth smoking (Sargent et al., 2004).
Despite the apparent importance of film portrayals of smoking on adolescent smoking outcomes and the frequency with which smoking appears on MTV/VH-1 programming, there has been no research of which we are aware linking MTV/VH-1 or other music channel viewership with adolescent smoking. In some respects, effects of channels such as MTV/VH-1 on substance use may be simpler to study than the effects of movies. Movies are a tremendously variable set of stimuli, ranging even within the R-rating from movies such as Pulp Fiction to Knocked Up, and very considerable resources have been needed to characterize content differences in individual movies and link them to the viewing behavior of youth. While programming is variable on channels such as MTV/VH-1, the heterogeneity seems small relative to the range of movie storylines, characters, and content.
At the same time, it should be acknowledged that movies may be potentially more influential on smoking behavior than are channels such as MTV/VH-1. Social cognitive theory and theories of narrative persuasion effects (Bandura, 2002) suggest that the impact of modeled behavior is likely to be a function of involvement with the character (or a favorite actor) and absorption in the story line; such involvement is likely to be much greater in the well-developed stories of movies (Tickle, Sargent, Dalton, Beach & Heatherton, 2001) than in the less-developed narratives of music videos or reality-TV programming. Nonetheless, tobacco use presentations in association with aspirational musicians and attractive actors and performers should have, from a social cognitive theory perspective, potential to influence viewer behavior.
Moreover, from the reinforcing spirals perspective (Slater, 2007), the amount of tobacco use portrayed isn’t as important as the role MTV-type viewing plays in the socialization process, and the likely association of such viewing with a move away from parental values and toward teens experimenting with proscribed behaviors, as discussed in more detail below. From this perspective, channels such as MTV and VH-1 in the first years of this decade exemplify media content that provides a convenient way to assimilate to peer- instead of family-centered behavioral norms.
Given the strong body of evidence from well-controlled longitudinal studies indicating that exposure to R-movies increases risk of smoking uptake among adolescents, evidence that smoking and other substance use portrayals are common in music video cable channel programming, and our theoretical arguments regarding the socializing role of such programming in adolescence, we predict:
Hypothesis 1. Early use of channels such as MTV and/or VH-1 will predict increasing rates of cigarette consumption among adolescents.
Media Use, Associating with Smoking Peers, and Reinforcing Spirals
Smoking, peers, and media use
The relationship between adolescent smoking and “hanging out” with smoking peers has been extensively theorized and studied. Primary Socialization Theory (Oetting & Donnermeyer, 1998) and Social Development Theory (Catalano, Kosterman, Hawkins, Newcomb & Abbott, 1996) point out that there is a natural developmental progression for maturing teens from orientation to parents and school as socialization sources to peer groups. Teens with weaker or more conflicted ties to such socialization influences, these researchers find, gravitate toward peer groups that engage in non-prosocial behaviors such as substance use, including smoking.
It should be noted that while such theories emphasize movement towards a substance-using peer group preceding initiation of substance use behavior, it is likely that the relationship between smoking and associating with smoking peers is probably iterative. Once an adolescent begins smoking, he or she is probably more likely to be welcomed among smoking peers, which is likely to further reinforce enactment of smoking behaviors. Clearly, though, movement to associating with smoking peers is likely to be a typical way station en route to taking up smoking, mediating the effects of other influences (Donohew, Clayton, Skinner & Colon, 1999).
Therefore, another possible path to media influence on adolescent smoking is through increased likelihood of associating with smoking peers. We believe there is good theoretical reason for expecting such a relationship. Primary Socialization Theory highlights the importance of the adolescent process of separating from parents as the primary socialization influence and moving increasingly towards the influence of peers as well (or, in some cases, instead of parents), and suggests that media might play a role in facilitating these processes (Kelly & Donohew, 1999).
Conceptualizing the role of media use in youth smoking with the reinforcing spirals model
The reinforcing spirals model of media selectivity and effects (Slater, 2007) develops a theoretical perspective for understanding this socialization role of media. According to this model, social identity is in large measure established, expressed, and reinforced through selection of media content consistent with a given identity. In turn, the selected media content reinforces the social identity and its attendant interpersonal associations and enacted behaviors. In other words, effects of media content are not only attributable to social learning, but are also due to the role of media content in establishing and reinforcing social identities and the behaviors arising from such identity. In the present case, for a teen preparing to move away to some degree from parental supervision and values, viewing of channels such as MTV provides a vicarious way to “try on” alternative values. As the content analyses cited above have shown, sexuality and substance use are widely represented on MTV and other, similar channels. Greater use of such media content at baseline, we suggest, is indicative of an initial movement of an adolescent respondent away from values of parents and school, and towards a more rebellious teen stance. This may be a safe, initial, vicarious exploration, but one that is likely to be followed in time by a move towards less pro-social peers, including smoking peers. Therefore,
Hypothesis 2. Greater early use of channels such as MTV/VH-1 will be associated with increased frequency of socializing with smoking teens in subsequent years.
The question of whether, in turn, greater smoking and greater association with smoking peers will increase rates of viewership of channels such as MTV and VH-1 is interesting and potentially complex. The reinforcing spirals model (Slater, 2007) suggests that development of a particular adolescent social group identity would lead to greater use of media content embraced by members of that social group and vice versa, in addition to the effect of media content use on supporting development of social identity. Our argument made earlier was that channels such as MTV and VH-1 provide a means of moving away from a more compliant, parent-centered identity to one more associated with pop culture and peers. However, channels such as MTV and VH-1 are general market and widely-used media channels. It may well be that when a youth becomes involved with a group of smoking peers, they may have a much more particular identity (punk, goth, cowboy, skater, etc.) with its own distinctive music and media preferences. Channels such as MTV and VH-1 may be perceived as too generic or simply off-target with respect to their evolving social identity and associated music preferences (e.g. van der Rijt, d’Haenens, Jansen & de Vos, 2000). In this case, use of MTV and VH-1 or similar music channels may be unaffected or even decline as smoking and smoking peer associations increase, because media and music preferences become increasingly particular to the social group, displacing earlier MTV/VH-1 content use. Therefore, we ask:
Research question 1. What is the association between the rates of increase in use of channels such as MTV/VH-1 and both smoking and association with smoking peers?
Method
Data Source
The data come from the National Study of Parents and Youth (NSPY), a longitudinal study of teens and their parents mandated by Congress to examine the effectiveness of a national media campaign to curb adolescent substance abuse. The study, administered by the National Institute on Drug Abuse, Westat, and the Annenberg School of Communication and the University of Pennsylvania, is based on a nationally representative sample of children and their parents or caregivers interviewed face-to-face between November 1999 and June 2004. Each child in the NSPY study provided data during at least one wave of data collection, and typically more than one, up to a maximum of four waves. Many of the questions were asked repeatedly without any change to question wording between waves, and we capitalize on this consistency in the study reported here to estimate initial states and change over time in exposure to MTV and VH-1 programming, smoking, and other variables pertinent to this study. For details on the measures, sampling and design of the NSPY, see https://www.nspycenter.com/.
Participants
The analysis was based on 2259 adolescents (52% male, 68% white) from the full data set. On average, an adolescent’s first interview took place at the age of 13.4 years (SD = 0.97) and the last interview at the age of 16.8 years (SD = 0.99). Because the NSPY data set contains over 8,000 adolescents, some explanation for how we settled on these adolescents in the sample is warranted. First, we restricted the analysis to adolescents who were interviewed at all four waves of data collection. Because the NSPY procedure terminated interviewing once an adolescent reached the age of 19, that means that any adolescent who had reached 19 prior to the fourth wave of data collection was not included, nor was any adolescent who dropped out for other reasons (not always documented in the NSPY data file) prior to the fourth wave. This procedure resulted in the elimination of 3421 adolescents. Of the remaining 4763, we excluded an additional 2450 adolescents who were younger than 12 at the age of first interview, leaving 2313.1 Next, because the design of the NSPY study allowed up to two children from the same household to participate, including both in multi-child households would produce violations of the independence assumption of the statistical methods we used, so we included only the child whose birthday was nearest to the date of the first interview. In the case of ties, we used the younger child. This procedure eliminated an additional 20 adolescents, yielding 2293. Finally, we excluded 34 adolescents who, for one reason or another, could not be matched up to data provided by one or more of his or her parents, as some of our analyses include parental variables as predictors.
The 2259 parents who provided data during the first wave of data collection were, on average, 41.5 years old (SD = 6.9 years) and were more likely to be female (63.5%) than male (36.5%). Eighty-seven percent reported having graduated from high school, and roughly an equal number reported having taken some college coursework (26.6%) or had a college degree (26.5%). One quarter reported earning at least $50,000 per year, and another quarter reported earnings of under $25,000 per year. There was a negligible but statistically significant association between the age of the parent and age of the adolescent at first interview, r = 0.09, p < .001, but there was no association between the gender of the adolescent and the gender of the participating parent, χ2(1) = 0.652, p > .10.
There was some variation between families in time lag between measurement waves. The earliest two waves were separated by an average of about 16 months (SD = 3.75 months), whereas the time lag between all other waves was about a year on average (SD = 3.62 months between waves 2 and 3 and SD = 3.58 between waves 3 and 4). In all discussion that follows below, we refer to the age of the adolescent at the first interview as the adolescent’s baseline age.
We used the sample as is, without incorporating weighting schemes intended to adjust the sample per demographic norms or the stratified sampling scheme. The analysis was restricted to a small subset of the entire sample, so the use of weights provided for generalization of the full sample would not have been appropriate.
Adolescent Measures
For the longitudinal adolescent measures, we included six questions that were asked in identical form across all four waves of data collection. In the description below, the NSPY variable name is bracketed in capital letters.
Smoking
Two questions were used to assess adolescent smoking at each wave. Each respondent was first asked whether he or she had “ever smoked part or all of a cigarette” [YCIGEVER]. Those who said they had never smoked a cigarette were classified as nonsmokers. Anyone who responded he or she had smoked were then asked “How long has it been since you last smoked part or all of a cigarette?” [YCIGLAST] and were provided with options of “during the last 30 days,” “more than 30 days ago but within the last 12 months” or “more than 12 months ago”. Responses to these questions were used, combined with the first question, to produce an ordinal scale of smoking: never (0), not within the last 12 months (1), not within the last 30 days (2), and during the last 30 days (3). Although not literally a measure of smoking frequency, this measure is similar to one used in similar studies of substance use in adolescents (Simons-Morton & Chen, 2005, Simons-Morton, Chen, Abroms, & Hayne, 2004) in that it scales people along a continuum of recency of use, which no doubt is highly correlated at least ordinally with how frequently the child actually does smoke. The means (SDs) were 0.29 (0.70), 0.52 (0.93), 0.67 (1.04), and 0.87 (1.15) for waves 1 through 4, respectively.
Music television viewing frequency
A single question was used to quantify each respondent’s viewing of channels such as MTV or VH-1 at each wave. Each respondent was asked “In the last 30 days, on how many days have you watched a music television station, such as MTV or VH-1?” Response options were scaled ordinally: 1 (never), 2 (1 to 4 days), 3 (5 to 14 days) and 4 (15 to 30 days) [TMTV30D]. The means (SDs) were 1.48 (1.12), 1.52 (1.14), 1.57 (1.12), and 1.54 (1.12) for waves 1 through 4, respectively. In our presentation of results, for brevity’s sake we refer to MTV and VH-1 viewing but note the item used those channels as examples but may have tapped exposure to other music channels as well, such as BET.
General TV viewing frequency
At each wave, two indicators were used to measure frequency of TV viewing without regards to specific content. The questions read “How much TV do you estimate watching on an average weekday?” [YWKDYTV] and “How much TV do you estimate watching on an average weekend, that is, both Saturday and Sunday combined?” [YWKNDTV] Because different ordinal scales were used with differing interval widths (number of hours), responses to each question were standardized across respondents within each wave and then averaged and used as an observed indicator of TV viewing frequency at each wave. The correlations between the two items with each wave ranged between 0.57 and 0.64, corresponding to Cronbach’s α of between 0.73 and 0.78.
Exposure to tobacco-using peers
Response to a single question at each wave was used as an observed indicator of exposure to peers who use tobacco: “In the last seven days, how many times did you get together with friends who smoke cigarettes or chew tobacco?” The response scale was roughly interval: 0 (never), 1 (1 time), 2 (2 times), 3 (3 times), 4 (4 or 5 times), 5 (6 or 7 times), and 6 (more than 7 times) [YFRNCIG]. The means (SDs) were 0.56 (1.34), 1.07 (1.82), 1.39 (2.00), and 1.71 (2.16) for waves 1 through 4, respectively.
Sensation-seeking
Sensation-seeking was used as a baseline control variable given research suggesting it is associated both with adolescent substance use and media use (Krcmar & Greene, 2003; Slater, 2003; Zuckerman, 1979), and thus might account for spurious relations between these behaviors. Four items measured in the first wave of data collection were used to quantify sensation seeking (Stevenson, Hoyle, Palmgreen, & Slater, 2003). Respondents were asked the extent to which they agreed with the following statements: “I would like to explore strange places” [YLKEXPLR], “I like to do frightening things” [YLKFRGHT], “I like new and exciting experiences, even if I have to break the rules” [YLKEXPER], and “I prefer friends who are exciting and unpredictable” [YLKEXCIT]. All items used an identical 1 (strongly disagree) to 5 (strongly agree) response scale. The mean of the four items was calculated for each respondent and used as an observed indicator of sensation seeking at baseline (Cronbach’s α = 0.80; M = 2.53, SD = 0.93).
Questions were also asked at the first interview to ascertain the child’s sex and ethnicity (coded as white or not white).
Parent Measures
Three variables (constructed from responses to 9 questions) were collected from the parent who participated during the first wave of data collection, including socioeconomic status, smoking status, and parental monitoring of the child.
Socioeconomic status
Questions tapping into the educational and income attainments of the participating parent were aggregated into a measure of socioeconomic status. Education level was quantified using responses to a question about highest level of school completed (with ordinal response options from no formal schooling up to graduate or professional school) [PSCHLCOM], and income was measured in response to a question about the yearly income of the entire household combined (ordinally scaled from under $10,000 to $100,000 or above) [PYRINCOM]. These two variables correlated 0.47 and were standardizing and then averaged into a measure of socioeconomic status (α = 0.67).
Smoking status
The participating parent at wave one was asked whether he or she “had ever smoked part or all of a cigarette” [PCIGEVER]. Those who said they had never smoked were classified as nonsmokers (30.3%). Those who responded “in the last 30 days” were classified as regular smokers (23.4%), and those who responded that had smoked ‘once or twice,’ ‘occasionally’ or ‘regularly’ in the past but not in the last 30 days were classified as occasional smokers (46.3%). Smoking status was coded for analysis with two dummy variables using nonsmokers as the reference category.
Parental monitoring
Monitoring is a potential third-variable explanation in that lack of monitoring of friends and friends behavior is likely to predict hanging out with peers who smoke and smoking behavior (Biglan, Duncan, Ary, & Smolkowski, 1995); parents who don’t monitor a son or daughter’s friendship groups also may not monitor and restrict TV watching. (According to an unpublished survey of parents cited by Smith [2005] MTV was the third most discouraged programming choice, after South Park and The Simpsons.) Such monitoring is no doubt correlated with parenting style, which is linked to substance use (Baumrind, 1991; Stephenson & Helme, 2006). However, parenting style is an imperfect way to assess monitoring, which is the parenting behavior of concern here as a third variable explanation. We address this issue by assessing parental reports of monitoring; in so doing, we complement existing research on movies and smoking, which typically controls for parenting style and not parental monitoring (Dalton et al., 2003; Sargent et al., 2004). If the parental monitoring variable does not explain away effects in this study, then there is less reason to suspect it is a potential problem in explaining the movie exposure-smoking link found in this previous research.
An index was constructed using responses to five questions in the NSPY instrument assessing parental monitoring (see Biglan et al., 1995). The first three questions had “never,” “seldom,” “about half the time,” “often,” and “always or almost always” as response options: (1) “How often to do [or your partner/coparent] know what [your child] is doing when he/she is away from home?” [PPARKNOW] (2) “How often do you [or your partner/coparent] have a pretty good idea about [child’s] plans for the coming day?” [PPARPLAN] (3) “How often does [child] spend his/her time hanging out with friends without child supervision?” [PFRNHANG]. The parent was also asked (4) “How well do you [or your partner/coparent] personally know [child’s] friends?” [PFRNKNOW] with response options of “not at all’ “a little bit” “somewhat well,” “pretty well” and “very well”. Finally, the participating parent was asked (5) “During the school year, about what time is [child] required to be home at night?” [PHOMWKND] and given a variety of times during the evening as response options. A parental monitoring index was constructed by scoring each response zero or one and adding them up to produce a score between 0 and 5. A point was earned by an “always or almost always” response to questions 1, 2, a “never” responses to question 3, a “very well” response to question 4, and for any response other than “no set time” to question 5 (M = 2.12, SD = 0.98).
Missing Data
As is typical in survey research, not every question asked was answered by each adolescent or parent. In total, 69 adolescents (3.1%) and 89 parents (3.9%) were missing on at least one of the variables described above. We used a hotdeck imputation procedure to replace missing values (Hawthorne & Elliott, 2005; Little & Rubin, 2002; Nordholdt, 1998; Reilly, 1993). This procedure imputes a missing value with the value from a randomly selected case similar to the missing case. For the adolescents, we defined similar as someone of the same age at the first wave of data collection, and for each imputed variable for each case, we selected from the distribution of responses in the wave that was missing. For the parents, we defined similar as someone of the same sex and age. So, for example, if an adolescent first interviewed at age 13 was missing a sensation seeking score at wave 2, we randomly selected a case also first interviewed at age 13 and used his or her sensation seeking score in the second wave as the imputed value for the missing case. This method of imputation in effect randomly selects an imputation value from the conditional distribution of the variable for people of the same age.
Results
We analyzed the data using parallel process latent growth modeling (Curran, 2000; Preacher, Wichman, MacCallum, & Briggs, 2008; Willett & Keiley, 2000). This method involves estimating the latent baseline and latent change in each of the four adolescent variables measured across the four waves. The analysis progressed in two stages. First, we used multivariate latent growth modeling to estimate latent baseline and latent change parameters for each of the four longitudinally-measured variables as well as the associations between these parameter estimates. This stage of the analysis allows us to ascertain the extent to which measurements at baseline are correlated with other baseline measures as well as change in those variables over time. In the second stage, we linked these estimates in a parallel process path model estimating change from baseline and entertaining various models of causality linking change to change. See Curran, Stice, and Chassin (1997), Simons-Morton et al. (2005), and Simons-Morton and Chen (2005) for recent examples of the use of this method in the study of adolescent substance use. The data were analyzed with Mplus 5 using maximum likelihood estimation of model parameters.2
A generic latent growth model for a single variable measured across four waves that corresponds to our analysis is presented in Figure 1. In this model, Xji represents participant i’s measurement at wave j on a given variable (e.g., exposure to tobacco using peers), Bi estimates “latent baseline” for participant i on that variable and σ2B estimates the variance in the latent baseline for across all 2259 participants. The slope of the trajectory in “latent change” for participant i is represented in this model as Δ1i, with the variance in change across all 2259 participants represented as σ2Δ. The weights in the model linking latent change to the indicators (i.e., Xji) correspond to the average number of years elapsed between baseline measurement and that wave across all 2259 adolescents. This renders the interpretation of Δi as a rough approximation of the change per year on that variable for participant i. By estimating the average Δi and its variance, we can determine whether there is any change in that variable, on average, across the adolescents in the study as well as whether there is significant heterogeneity in change. Finally, ρBΔ represents the correlation between latent baseline and latent change for that variable.
Figure 1.
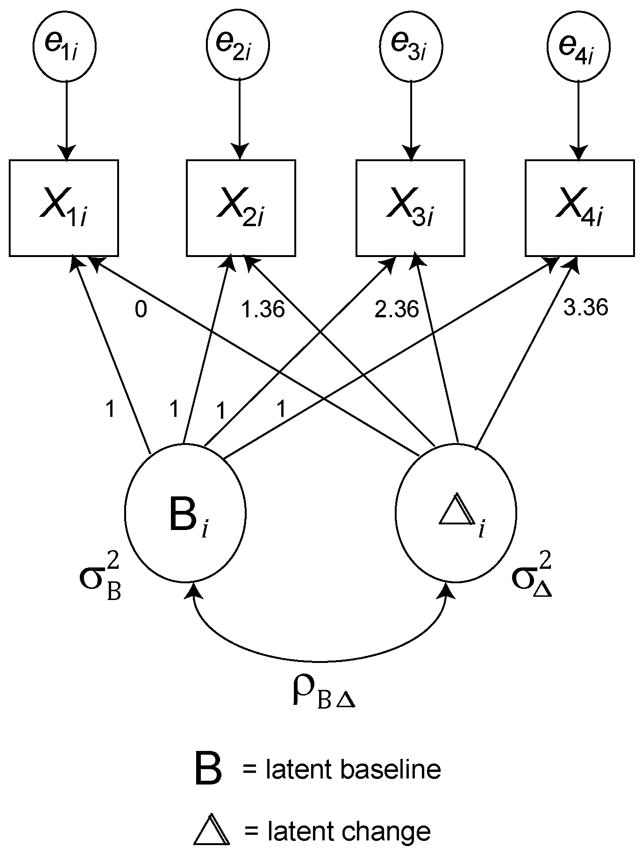
A representation of the four-wave latent growth model estimated for each adolescent variable measured longitudinally. Bi = latent baseline for adolescent i, Δi = latent change per year for adolescent i, Xji = observed measurement for adolescent i at wave j.
Figure 1 presents only a single latent growth model for a single variable. But in the analysis, we actually estimated four such models simultaneously (for MTV/VH-1 viewing, smoking, exposure to tobacco using peers, and general TV viewing), including all possible correlations between latent baseline and latent change estimates across these four variables. In so doing, we are able to ascertain how these variables covary at baseline, how baseline measurements covary with change, and how changes covary over time.
The top portion of Table 1 presents the mean baseline and change estimates across all 2259 adolescents, as well as variance in those estimates. Means and variance at baseline are not particularly informative. The means estimate the average baseline score on each variable, and the variances, all of which are statistically different from zero, tell us only that there was significant variation between adolescents at baseline. More interesting are the estimates of change as well as variance of those estimates. Observe that three of the four estimates are positive and statistically different from zero. Substantively, this means that on average, over time adolescents reported watching more MTV/VH-1, smoking more frequently, and hanging around with tobacco users more often. However, the negative estimate for general TV viewing means that they reported, in general, watching less television over time. Note that all of the variance estimates are different from zero, reflecting individual differences in change over the period of observation.
Table 1.
Means, Variances, and Correlations between Latent Baseline and Latent Change in MTV/VH1 Viewing Frequency, Exposure to Tobacco-Using Friends, Smoking, General TV Viewing Frequency in 2259 Adolescents
| Latent Baseline (B) | Latent Change (Δ) | |||||||
|---|---|---|---|---|---|---|---|---|
| MTV/VH1 Viewing Freq. | Tobacco-using Peers | Smoking Incidence | Gen TV Viewing | MTV/VH1 Viewing Freq. | Tobacco-using Peers | Smoking Incidence | Gen TV Viewing | |
| Mean | 1.50*** | 0.57*** | 0.29*** | 0.13*** | 0.02* | 0.34*** | 0.17*** | −0.08*** |
| Variance | 0.63*** | 1.08*** | 0.38*** | 0.46*** | 0.06*** | 0.21*** | 0.06*** | 0.02*** |
| Correlations1 | ||||||||
| Latent Baseline | ||||||||
| MTV/VH1 Viewing | --- | .19*** | .09* | .45*** | −.32*** | .16*** | .14*** | −.26*** |
| Tobacco-Using Peers | .33*** | --- | .70*** | .05 | −.15** | −.23*** | −.13*** | .00 |
| Smoking Incidence | .23*** | .77*** | --- | .02 | −.10* | −.05 | −.13** | .01 |
| General TV Viewing Frequency | .39*** | .04 | .03 | --- | −.12** | .11** | .08* | −.28*** |
| Latent Change | ||||||||
| MTV/VH1 Viewing | −.36*** | −.26*** | −.20*** | −.07 | --- | .02 | .04 | .50*** |
| Tobacco-Using Peers | .21*** | −.08 | .05 | .10** | −.03 | --- | .74*** | −.12* |
| Smoking Incidence | .22*** | .02 | .01 | .10** | −.00 | .76*** | --- | −.06 |
| General TV Viewing Frequency | −.27*** | −.08 | −.05 | −.25*** | .51*** | −.14** | −.10* | --- |
p < .05
p < .01
p < .001
Correlations below the diagonal are simple correlations; correlations above the diagonal are partial correlations, controlling for adolescent sex, ethnicity, baseline age, sensation seeking, parent smoking, parent socioeconomic status, and parental monitoring.
Note: For the model that generates the lower diagonal, χ2(92) = 729.478, p < .001; CFI = 0.95, TLI = 0.95, RMSEA = 0.055 (90% CI: 0.052 to 0.059). For the upper diagonal, χ2(156) = 810.16, p < 001, CFI = 0.96; TLI = 0.94, RMSEA = 0.043 (90% CI: 0.040 to 0.046)
More relevant to the goals of this study are the correlations between baseline and change estimates, on the lower diagonal of Table 1. Focusing first on the correlations between baseline estimates, observe the statistically significant positive correlations between smoking, MTV/VH-1 viewing frequency, and smoking. At baseline, adolescents who reported watching relatively more MTV/VH-1 also reported smoking more (r = 0.23, p < .001) and hanging around with frequently more tobacco using peers (r = 0.33, p < .001). Also observe the strong correlation between smoking and exposure to tobacco users (r = 0.77, p < .001). Adolescents who smoke relatively more at baseline also report more frequent exposure to tobacco-using peers.
We turn next to correlations between baseline and change estimates. The pattern of correlations shows that adolescents who watch relatively more MTV/VH-1 at baseline show more positive change in smoking (r = .22, p < .001) and exposure to tobacco-using peers (r = 0.21, p < .001). However, the reverse is not true. There is no evidence that adolescents who are smoking relatively more at baseline or hang out with smokers more frequently increase their MTV/VH-1 viewing over time. In fact, the opposite seems to be the case. Greater smoking and exposure to tobacco using peers at baseline is related to less positive change in MTV/VH-1 viewing (r = −0.20 and −.26, p < .001, respectively). Although these findings are correlational, if a causal claim is justified, the direction of cause clearly must move from baseline to change rather than the other direction.
Finally, the lower right hand quadrant of Table 1 provides correlations between changes. Two findings are noteworthy. First, observe the correlation between change in smoking and exposure to tobacco-using peers. The correlation is positive, strong, and different from zero (r = .76, p < .001), meaning that adolescents who show more positive change in their smoking also report greater change in their exposure to tobacco using peers. However, we see no evidence here that changes in MTV/VH-1 viewing predict changes in smoking (r = −.00, ns) or frequency of exposure to tobacco users (r = −0.03, ns).
The results involving baseline MTV/VH-1 viewing frequency suggest that early exposure to smoking models in popular genres of entertainment media can prompt increased smoking over time as well as exposure to smoking peers. But there are alternative explanations. Youth who watch more MTV/VH-1 when they are younger may differ in important ways from those who watch less that predispose them to smoke more over time for one reason or another, such as exposure to models at home, a lack of monitoring by parents, or such characteristics as sensation seeking that may lead adolescents to be attracted to both smoking and this form of media. These findings could also be attributable to between-child variation in age at initial measurement, or an epiphenomenon of the fact that adolescents who watch more television in general also show positive change in smoking (r = .10, p < .01) and exposure to tobacco using peers (r = .10, p < .01. Therefore, subsequent analyses address these possible confounds in various ways.
First, we repeated the prior analysis but partialing out adolescent gender, ethnicity, age and sensation seeking at baseline, parent socioeconomic status, parental monitoring of the child, and parent smoking. This was accomplished by including these controls are predictors of all baseline and change parameters in the latent growth model and re-estimating the model. The correlations between the errors in estimation of these parameters can be interpreted as partial correlations, holding constant these control variables. These correlations can be found in the upper diagonal of Table 1. Although correlations reported earlier between the baseline estimates were weaker, they remained positive and statistically significant. Furthermore, even after these controls, greater early exposure to MTV/VH-1 predicted more positive change in exposure to tobacco users (partial r = .16, p < .001) and smoking (partial r = .14, p < .001). Finally, changes in smoking were still positive related in changes in exposure to tobacco-using peers (partial r = .74, p < .001).
This analysis leaves some questions unanswered. First, this approach does not account for the possibility that adolescents who watch more MTV/VH-1 at baseline may simply watch more TV in general, so we can’t be sure that these associations between baseline MTV/VH-1 viewing and change are unique to MTV/VH-1 viewing. Second, we could be more confident that initially higher MTV/VH-1 prompts greater increases in smoking and exposure to tobacco users if we knew that this association is independent of initial smoking and exposure. Relatedly, they could be due to some kind of measurement artifact. Specifically, people who are relatively high or low on one variable may have relatively greater likelihood of changing positive or negative on another, depending on initial status. It would beneficial to know that baseline predicts change independent of baseline status on all other variables measured longitudinally. Finally, the analyses thus far assesses only what are known in the causal modeling literature as total effects. They do not assess possible indirect effects between baseline and change, nor do they address causal direction between changes over time. Although the lack of association between changes in MTV/VH-1 viewing and other changes hints at the possibility of no causal association, it is possible for one variable to indirect causally affect another even in the absence of an association between them (see Hayes, 2009, for an example). None of the analyses conducted thus far model indirect effects of baseline on change or between estimates of change. The final analysis we report overcomes these weaknesses.
Our final approach to modeling the data is depicted visually in Figure 2. In this model, we model change as a function of baseline measures as well as other changes. We include all exogenous controls discussed thus far in the model, and also partial out baseline general TV viewing and changes in general TV viewing from all pathways. Proposed causal paths are depicted in Figure 2 with bold unidirectional arrows. Paths that exist purely for control purposes are depicted with lighter dashed arrows.
Figure 2.

The parallel process latent growth mediation model estimated in the second stage of analysis. Paths between latent change estimates (a through f), in sets of three, were constrained to zero to generate six models of causal direction. The measurement models for each growth model are excluded (see Figure 1) to reduce visual clutter. Solid black arrows represent paths in a causal model. Dashed gray arrows represent paths present purely for statistical control with no assumption of causality. B = baseline, Δ = change, PEERS = exposure to tobacco-using peers, SMOKE = smoking, MTV = MTV/VH-1 viewing frequency
We did not estimate the entire model in Figure 2 because a model with reciprocal pathways is not identified. Instead, we estimated six variants of this model by constraining various directions of cause between changes to zero. These constraints were chosen to produce various direct and indirect pathways between change going in specific causal directions. Specifically, we estimated two models in which change in MTV/VH-1 viewing was antecedent, two with exposure to tobacco using friends as antecedent, and two with changes in smoking as antecedent. Each of these two models had a submodel that we also fit. For example, in the two models with MTV/VH-1 viewing as antecedent (meaning that paths b and e were constrained to zero and paths a and f were freely estimated), one model placed change in exposure to tobacco using peers as the final consequent with changes in smoking as intervening (meaning path d was constrained to zero and c was freely estimated), and the other submodel placed changes in smoking as the consequent and exposure to tobacco using peers as intervening (meaning path c was constrained to zero and d was freely estimated). This strategy yields six possible models of causal influence, both direct and indirect, in a specific direction between changes in these three variables.
Although the six models combined by these combinations of constraints seem very similar, many of the paths have different interpretations depending on the constraints between pathways of change. For example, in any model in which the pathway from change in exposure to tobacco-using peers to change in smoking is constrained to zero (path d in Figure 2), the pathways from baseline measures to change in smoking do not account for corresponding changes in exposure to smoking peers. However, such changes in exposure to smoking peers are statistically adjusted out of the path estimates in models that freely estimated this path. Similarly, in models that constrain path e to zero, the causal association between changes in smoking and changes in MTV/VH-1 viewing do not account for corresponding changes in exposure to tobacco using peers, whereas in models where such corresponding changes are controlled in models that freely estimate path e.
One weakness of this approach is that these are statistically equivalent models. meaning that they fit the data equally well and so can’t be distinguished based on measures of fit (see, e.g., MacCallum, Wegener, Uchino, & Fabrigar, 1993; Stelzl, 1986; for all six models, χ2(156) = 810.158, CFI = 0.96, TLI = 0.94, RMSEA = 0.043, 90% confidence interval for RMSEA = 0.040 to 0.046). So we focus on interpretation on consistencies in paths across models, for these consistencies are the clearest lens through which to view and interpret possible directions of cause and the processes that give rise to the observed data. We spare the reader the tedium of examining a table of coefficients for all six models and instead represent the findings visually in Figure 3, with statistically significant paths in dark bold arrows and nonsignificant paths in lighter dashed arrows. Paths that exist in the model purely to serve a statistical control function are excluded to reduce visual clutter. Also note that all statistically significant paths are positive in sign.
Figure 3.

Statistically significant (bold) and nonsignificant (dashed) paths in the six causal models estimated. Models differ primarily with respect to causal direction of associations between change parameters (see text for details). All statistically significant paths are positively signed. To reduce visual clutter, paths in the model purely for statistical control (see Figure 2) are not depicted. These are all equivalent models and fit the data equally well, so cannot be distinguished by measures of fit.
First, observe that in all models, there is evidence of either a direct or an indirect path between baseline MTV/VH-1 viewing and changes in smoking, independent of all exogeneous controls, all baseline measures, and change in general TV viewing frequency.3 In models 1, 2, and 5, the pathway is direct—adolescents who watch more MTV/VH-1 at baseline report a relative increase in smoking over time. That direct pathway does not exist in models 3, 4, and 6. Instead, the pathway is indirect, with greater MTV/VH-1 viewing frequency positively affecting changes in exposure to tobacco using friends, which in turn prompts greater change in smoking over time.
However, we cannot say that increases in smoking over time as a result of early exposure to MTV/VH-1 are necessarily the end result of this process. Instead, such increases in smoking could also be construed as intermediary. Observe that in all six models, there is evidence of either a direct or an indirect effect of relatively greater early MTV/VH-1 exposure on changes in exposure to tobacco-using peers. That pathway is direct in models 3,4, and 6, or indirect through increases in smoking over time (in models 1,2, and 5), which in turn affect exposure to tobacco using peers. So combined, the evidence is consistent with causal effects of early exposure to MTV/VH-1 viewing on increases in exposure to tobacco users and increases in smoking. It is likely that these changes are mutually reinforcing—adolescents who smoke more over time are also hanging out with smokers more, who reinforce smoking behavior.
In contrast, the evidence that changes in exposure to MTV/VH-1 (as opposed to extent of early exposure) are linked to changes in smoking or exposure to smoking peers is weak. In only one of the five models in which changes in MTV/VH-1 viewing frequency were allowed to directly or indirect affect other changes was such a path statistically significant. We consider this compelling evidence that changes in exposure to televised smoking models through such programming does not affect how much adolescents smoke or their exposure to peers who smoke. Furthermore, evidence that adolescents may reinforce lifestyle choices such as smoking or selection of smoking peers by increased exposure to televised smoking models in these programs is largely nonexistent. In only one model is a pathway from smoking or exposure to smoking friends statistically, either at baseline or change, related to changes in MTV/VH-1 viewing over time.
Finally, notice that in all models, adolescents who smoke more at baseline show more positive change in exposure to tobacco using friends. This effect exists regardless of whether (models 1, 2, and 5) or not (models 3, 4, and 6) change in smoking over time is controlled. But evidence for a causal effect of greater early exposure to smoking peers on later smoking is somewhat less consistent. The pathway is statistically significant in only three of the six models.
Discussion
These results show that early exposure to popular music channels predicts later increases in smoking and associating with smoking peers, even after inclusion of controls for demographic, dispositional, and parent behavior variables. However, change in the frequency of viewing of channels such as MTV and VH-1 was not significantly correlated with changes in the number of smoking peers or in smoking uptake.
These findings are consistent with our argument that channels such as MTV and VH-1 influence youth smoking behavior through the role of media use in development of social identity, and do not exert their influence solely through social cognitive processes. If social cognitive effects were the primary or exclusive explanation of such a relationship, one would expect to see significant correlations of the growth trajectories. After all, social cognitive theory would lead us to expect that as the number of attractive models seen smoking increased over time, so should the effects on smoking behavior. There may have been social cognitive effects early on, contributing to baseline impact—but the pattern of results suggests that there is more than social learning--behavioral acquisition from aspirational models--at work.
Our argument, based on the reinforcing spirals model (Slater, 2007) proposed that viewing of channels such as MTV and VH-1 would likely serve as a way for youth to experiment with a vicarious relationship to somewhat deviant (with respect to substance use and sexuality) peer norms. A higher level at baseline is therefore predictive of a greater likelihood of engagement with activities such as smoking henceforth.
This perspective would also suggest that these effects are not dependent on the specifics of MTV, VH-1, or other television music channel content in the years under study. With the advent of reality-TV programming, that content of these cable programs has also no doubt evolved. As long as these channels present content that is heavily peer-oriented and in which cigarette and other substance use is portrayed as part of peer culture, we would expect to find similar results—as we would for any such media content playing a similar socialization role.
This reinforcing spirals perspective would also suggest that increasing engagement with peers engaging in less pro-social behavior should also influence youth media content choice. If peer groups that were more likely to be using cigarettes also would encourage greater use of channels such as MTV and VH-1, the lack of correlation between the trajectories of MTV/VH-1 use and smoking variables would be a problem for this test of the model. However, as noted earlier, there is evidence that as youth become differentiated into peer social groups, that these groups develop quite distinctive musical preferences (van der Rijt et al., 2000). Popular music on MTV and VH-1 aims for a broad youth audience and often may not focus on specific music content preferred by a given youth peer group. Therefore, greater specificity of music content preference would lead members of such social groups to look elsewhere than channels such as MTV or VH-1 to reinforce their social identity through media content choice. This also serves to explain the lack of a statistically significant positive relationship between smoking behavior at baseline and subsequent MTV/VH-1 use trajectory, and why greater smoking at baseline is not positively associated with an increasing trajectory of MTV/VH-1 use in subsequent years.
Another recent analysis provides data supportive of this interpretation (Scheier & Grenard, in press). Radio stations tend to be more targeted in terms of genre (heavy metal, hip hop, etc) than channels such as MTV/VH-1, which attempts to reach a broad audience by providing a wider cross-section of popular music. During the period of this survey, ending in 2004, music downloads were not dominant in terms of music choice among teens. In fact, consistent with reinforcing spiral predictions, increases in the trajectories of radio listening and cigarette use were in fact correlated in these survey data. In other words, we suggest that as adolescents in the study became more involved with smoking peers and cigarette use, that their media preference moved from the more generic MTV/VH-1-type programs to use of radio stations that reflected their specific peer group preferences.
Therefore, the results of these analyses underscore the importance of conceptualizing reinforcing spirals in complex and nuanced way. A more primitive argument is that initial media exposures associated with an evolving social identity will lead to more exposure to precisely the same type of media content. In some cases, that may be so. Here, however, it appears that as identity evolves, so do the specifics of the media content selected. The role of media in evolving social identity apparently is dynamic, as are the nature of the specific media content choices made.
We note several limitations: the data, while longitudinal, are nonetheless still associational, with the resultant uncertainties regarding causal direction and possible third variable effects. As noted above, we have addressed those analytically, but alternative explanations cannot be definitively ruled out. Self-report measures of media use, smoking, and smoking peers may be subject to inaccuracies based on faulty recall or respondent desires to self-present in less than honest ways. A limitation of the study instrument was the availability of a single item to measure use of channels such as MTV and VH-1. Mean self-reported viewing levels of such channels was generally low, as were rates of smoking among respondents; however, the effect of this restricted variability should be on limiting statistical power, which was compensated for by the relatively large sample size. In addition, given the use of a sample subset and not the full study sample, we have not incorporated the complex weighting scheme associated with this data set. As a result, while these respondents are clearly a good cross-section of American youth, the parameter estimates reported here cannot be readily generalized to the population of U.S. adolescents given possible bias associated with recruitment, retention, and the sampling frame.
Substantively, these findings extend the evidence for media effects on teen smoking found in previous research (Dalton, et al., 2003) to MTV/VH-1. These findings may be of greater concern than those on the effects of R-rated movie viewing, given the accessibility of channels such as MTV in the home, and their availability to younger teens. These findings also extend that prior work by including a control for parent self-reports of monitoring behavior.
From a theoretical perspective, these findings underscore the potential utility of understanding the effects of media exposure on adolescent behavior from the perspective of the development of social identity. Social cognitive effects are no doubt important, and may play a role not only in behavior acquisition but in learning about alternative norms and behaviors that might also be embraced by aspirational peer groups. The point we would emphasize, from the perspective of the reinforcing spirals model, is that to conceptualize the effects of media exposure on adolescent behavior as simply an imitative process of social learning from media models is probably simplistic. The norms and behaviors of media content are likely to be part of the process of the selection and development among the alternative social identities available to an adolescent.
In addition, this research extends the reinforcing spirals model by suggesting that reinforcing effects of media use on social identity may well be complicated by evolution in media content choices, as social identities evolve. An important role for qualitative research may be to identify the media content choices associated with youth subgroups of interest; if these are not known with some confidence, it may be challenging to appropriately measure media content preference in a survey instrument.
Strengths of this study include the quality of the data set, data from parents as well as children, and analytic models that permit study of predictors and correlates of developmental change itself. The primary limitations include, as is typically the case for a survey data set, the possibility of a key unexamined control variable that would explain some results, and possible selection bias in those willing to participate in this data collection.
These findings strongly suggest that early use of channels such as MTV and VH-1 predicts increasing rates of teen smoking and associations with smoking peers, consistent with other research on teens and R movie viewing. Music television viewing by teens appears to deserve greater scrutiny from concerned parents and public health educators.
Acknowledgments
This research was supported in part by grant CA109694 from the National Cancer Institute to Erwin Bettinghaus at KleinBuendel, Inc., whose encouragement is gratefully acknowledged. The data reported herein were collected under the auspices of National Institute on Drug Abuse contract number N01DA-8-5063. The data were subsequently obtained via the National Survey of Parents and Youth Center, NIDA contract number N01DA-5-5532.
Footnotes
Variation among the youngest children on all measures was generally low. A lack of variation tends to produce estimation problems in latent growth models. Our selection of age 12 represented a compromise in trying to maximize use of the data available without making completely arbitrary decisions for inclusion in the analysis, while also minimizing estimation problems.
We could not assume multivariate normality of either the indicators or the latent variables. Primarily, our concern was the effects of nonnormality on standard errors, which affect the validity of hypothesis tests. To verify nonnormality did not disrupt inference, we estimated bias corrected bootstrap confidence intervals for all paths using 5000 bootstrap samples. All paths, covariances, and correlations we label or describe as statistically significant had corresponding bootstrap confidence intervals that did not include zero.
We focus here on the paths connecting variables together when discussing indirect effects. However, we did explicitly estimate the indirect effects and also constructed bias corrected bootstrap confidence intervals for the product of paths, using 5000 bootstrap confidence intervals (see e.g., Preacher and Hayes, 2008; Hayes, 2009, to ensure that those we discuss were in fact statistically different from zero.
References
- Arnett JJ. Adolescents’ uses of media for self-socialization. Journal of Youth and Adolescence. 1995;24:519–533. [Google Scholar]
- Bandura A. Social cognitive theory of mass communication. In: Bryant J, Zillmann D, editors. Media effects: Advances in theory and research. 2. Hillsdale, NJ: Erlbaum; 2002. pp. 121–154. [Google Scholar]
- Baumrind D. The influence of parenting style on adolescent competence and substance use. Journal of Early Adolescence. 1991;11:56–95. [Google Scholar]
- Biglan A, Duncan TE, Ary DV, Smolkowski K. Peer and parental influences on adolescent tobacco use. Journal of Behavioral Medicine. 1995;18:315–330. doi: 10.1007/BF01857657. [DOI] [PubMed] [Google Scholar]
- Blair NA, Yue SK, Singh R, Bernhardt JM. Depictions of substance use in reality television: A content analysis of The Osbournes. British Medical Journal. 2005;331(7531):1517–1519. doi: 10.1136/bmj.331.7531.1517. [DOI] [PMC free article] [PubMed] [Google Scholar]
- Catalano R, Kosterman R, Hawkins J, Newcomb M, Abbott R. Modeling the etiology of adolescent substance use: A test of the social development model. Journal of Drug Issues. 1996;26:429–455. doi: 10.1177/002204269602600207. [DOI] [PMC free article] [PubMed] [Google Scholar]
- Curran PJ. A latent curve framework for the study of developmental trajectories in adolescent substance use. In: Rose JS, Chassin L, Presson CC, Sherman SJ, editors. Multivariate applications in substance use research: New methods for old questions. Mahwah, NJ: Lawrence Erlbaum Associates; 2000. pp. 1–42. [Google Scholar]
- Curran PJ, Stice E, Chassin L. The relation between adolescent alcohol use and peer alcohol use: A longitudinal random coefficients model. Journal of Consulting and Clinical Psychology. 1997;65:130–140. doi: 10.1037//0022-006x.65.1.130. [DOI] [PubMed] [Google Scholar]
- Dalton MA, Sargent JD, Beach ML, Titus-Ernstoff L, Gibson JJ, Ahrens MB, et al. Effect of viewing smoking in movies on adolescent smoking initiation: A cohort study. Lancet. 2003;362(9380):281–285. doi: 10.1016/S0140-6736(03)13970-0. [DOI] [PubMed] [Google Scholar]
- Donohew L, Clayton RR, Skinner WF, Colon S. Peer networks and sensation seeking: Some implications for primary socialization theory. Substance Use and Misuse. 1999;34(7):1013–1023. doi: 10.3109/10826089909039393. [DOI] [PubMed] [Google Scholar]
- DuRant R, Rome E, Rich M, Allred E, Emans S, Woods E. Tobacco and alcohol use behaviors protrayed in music videos: A content analysis. America Journal of Public Health. 1997;87(9):1514. doi: 10.2105/ajph.87.7.1131. [DOI] [PMC free article] [PubMed] [Google Scholar]
- Gruber E, Thau H, Hill D, Fisher D, Grube J. Alcohol, tobacco and illicit substances in music videos: A content analysis of prevalence and genre. Journal of Adolescent Health. 2005;37:81–83. doi: 10.1016/j.jadohealth.2004.02.034. [DOI] [PubMed] [Google Scholar]
- Hawthorne G, Elliott P. Imputing cross-sectional missing data: Comparison of common techniques. Australian and New Zealand Journal of Psychiatry. 2005;39:583–590. doi: 10.1080/j.1440-1614.2005.01630.x. [DOI] [PubMed] [Google Scholar]
- Hayes AF. Beyond Baron and Kenny: Statistical mediation analysis in the new millennium. Communication Monographs. 2009;76:408–420. [Google Scholar]
- Kaiser Family Foundation. Teens and sex: The role of popular TV. 2001 Retrieved August 1, 2008, from http://www.kff.org/
- Kelly K, Donohew L. Media and primary socialization theory. Substance Use & Misuse. 1999;34:1033–1045. doi: 10.3109/10826089909039395. [DOI] [PubMed] [Google Scholar]
- Krcmar M, Greene K. Predicting exposure to and uses of television violence. Journal of Communication. 1999;49:24–45. [Google Scholar]
- Little RJA, Rubin DB. Statistical analysis with missing data. 2. Hoboken, NJ: Wiley; 2001. [Google Scholar]
- MacCallum RC, Wegener DT, Uchino BN, Fabrigar LR. The problem of equivalent models in applications of covariance structure analysis. Psychological Bulletin. 1993;114:185–199. doi: 10.1037/0033-2909.114.1.185. [DOI] [PubMed] [Google Scholar]
- Nordholt ES. Imputation: Methods, simulation experiments, and practical examples. International Statistical Review. 1998;66:157–180. [Google Scholar]
- Oetting E, Donnermeyer JF. Primary socialization theory: The etiology of drug use and deviance. Etiology of Substance Use. 1998;33(4):995–1026. doi: 10.3109/10826089809056252. [DOI] [PubMed] [Google Scholar]
- Preacher KJ, Hayes AF. Asymptotic and resampling strategies for assessing and comparing indirect effects in multiple mediator models. Behavior Research Methods. 2008;40:879–891. doi: 10.3758/brm.40.3.879. [DOI] [PubMed] [Google Scholar]
- Preacher KJ, Wichman AL, MacCallum RC, Briggs NE. Latent growth curve modeling. Thousand Oaks, CA: Sage Publications; 2008. [Google Scholar]
- Reilly M. Data analysis using hot deck multiple imputation. The Statistician. 1993;42:307–313. [Google Scholar]
- Roberts DF, Christenson PG, Henrisksen L, Bandy E. Substance use in popular music videos. 2002 Retrieved August 1, 2008, from http://www.mediacampaign.org/pdf/mediascope.pdf.
- Sargent JD, Beach ML, Dalton MA, Ernstoff LT, Gibson JJ, Tickle JJ, et al. Effect of parental R-rated movie restriction on adolescent smoking initiation: A prospective study. Pediatrics. 2004;114(1):149–156. doi: 10.1542/peds.114.1.149. [DOI] [PubMed] [Google Scholar]
- Scheier LM, Grenard J. Influence of a nation-wide social marketing campaign on adolescent drug use. Journal of Health Communication. 15(2) doi: 10.1080/10810731003686580. (In press) [DOI] [PubMed] [Google Scholar]
- Simons-Morton B, Chen R. Latent growth curve analyses of parent influences on drinking progression among early adolescents. Journal of Studies on Alcohol. 2005;66:5–14. doi: 10.15288/jsa.2005.66.5. [DOI] [PubMed] [Google Scholar]
- Simons-Morton B, Chen R, Abroms L, Hayne DL. Latent growth curve analysis of peer and parent influences on smoking progression among early adolescents. Health Psychology. 2004;23:612–621. doi: 10.1037/0278-6133.23.6.612. [DOI] [PubMed] [Google Scholar]
- Slater MD. Reinforcing spirals: The mutual influence of media selectivity and media effects and their impact on individual behavior and social identity. Communication Theory. 2007;17:281–303. [Google Scholar]
- Slater MD. Alienation, aggression, and sensation-seeking as predictors of violent film, computer, and website content. Journal of Communication. 2003;53:105–121. [Google Scholar]
- Smith SL. From Dr. Dre to “Dismissed”: Assessing violence, sex, and substance use on MTV. Critical Studies in Media Communication. 2005;22(1):89–98. [Google Scholar]
- Stephenson MT, Helme DW. Authoritative parenting and sensation-seeking as predictors of adolescent cigarette and marijuana use. Journal of Drug Education. 2006;36:247–270. doi: 10.2190/Y223-2623-7716-2235. [DOI] [PubMed] [Google Scholar]
- Stephenson MT, Hoyle RH, Palmgreen P, Slater MD. Brief sensation-seeking indices and the prevention of youth substance use. Drug and Alcohol Dependence. 2003;72:279–286. doi: 10.1016/j.drugalcdep.2003.08.003. [DOI] [PubMed] [Google Scholar]
- Stetzl I. Changing a causal hypothesis without changing the fit: Some rules for generating equivalent path models. Multivariate Behavioral Research. 1986;21:309–331. doi: 10.1207/s15327906mbr2103_3. [DOI] [PubMed] [Google Scholar]
- Tickle JJ, Sargent JD, Dalton MA, Beach ML, Heatherton TF. Favourite movie stars, their tobacco use in contemporary movies, and its association with adolescent smoking. Tobacco Control. 2001;10(1):16–22. doi: 10.1136/tc.10.1.16. [DOI] [PMC free article] [PubMed] [Google Scholar]
- van der Rijt GA, d’Haenens LSJ, Jansen RHA, de Vos CJ. Young people and music television in the Netherlands. European Journal of Communication. 2000;15(1):79–91. [Google Scholar]
- Willett JB. Measuring change: What individual growth modeling buys you. In: Amsel E, Renninger KA, editors. Change and development: Issues of theory, method, and application. Mahwah, NJ: Lawrence Erlbaum Associates; 1997. pp. 213–243. [Google Scholar]
- Willett JB, Keiley MK. Using covariance structure analysis to model change over time. In: Tinsley HEA, Brown SD, editors. Handbook of applied multivariate statistics and mathematical modeling. San Diego, CA: Academic Press; 2000. pp. 665–694. [Google Scholar]
- Zuckerman M. Sensation seeking: Beyond the optimal level of arousal. Hillsdale, NJ: Lawrence Erlbaum; 1979. [Google Scholar]