Abstract
Myelin oligodendrocyte glycoprotein (MOG) is commonly used as an immunogen to induce an immune response against endogenous myelin, thereby modeling multiple sclerosis in rodents. When MOG is combined with complete Freund's adjuvant (CFA), multifocal, multiphasic disease ensues; whereas when MOG is combined with incomplete Freund's adjuvant (IFA), clinical disease is usually absent. MOG–IFA immunized animals can be induced to have neurological disease after intraspinal injections of cytokines and ethidium bromide (EtBr). In this study, we investigated whether MOG–IFA immunized rats exhibited subclinical injury as defined by somatosensory evoked potential (SEP) recordings. The titration of anti-MOG-125 antibodies showed robust peripheral mounting of immune response against myelin in MOG-immunized rats. However the SEP measures showed no significant change over time. Upon injecting cytokine–EtBr in the spinal cord after MOG sensitization, the SEP recordings showed reduced amplitude and prolonged latency, suggestive of axonal injury and demyelination in the dorsal column, respectively. These findings were later confirmed using T2-weighted MRI and histological hematoxylin–eosin stain of the spinal cord. This report establishes that MOG–IFA immunization alone does not alter neuronal conduction in SEP-related neural-pathways and that longitudinal in-vivo SEP recordings provide a sensitive read-out for focal myelitis (MOG–IFA and intraspinal cytokine–EtBr) in rats.
Keywords: Somatosensory evoked potential (SEP), Myelin oligodendrocyte glycoprotein (MOG), Freund's adjuvant, Sensitization/immunization, Cytokine, Ethidium bromide
1. Introduction
The myelin oligodendrocyte glycoprotein (MOG) is expressed on the external surface of oligodendrocytes and is crucial in the process of myelination of axons [1,2]. It is also a target of the immune system in demyelinating diseases such as multiple sclerosis (MS).
Experimental autoimmune encephalomyelitis (EAE) is a rodent model of an inflammatory demyelinating disease of the central nervous system. In one version of EAE, purified MOG is used as an immunogen in combination with an adjuvant–either CFA or IFA–to induce a cellular and humoral immune response against myelin [3,4]. MOG–CFA induces fulminant encephalomyelitis while MOG–IFA, as it is suggested, leads to only peripheral mounting of immune response and does not induce clinical disease. However, MOG–IFA immunized rats can be induced to have focal spinal cord disease by administering inflammatory factors directly into the spinal cord [5]. This focal EAE model, analogous to the human paralyzing disorder transverse myelitis (TM), is believed to be a valuable model to study the neurologic manifestations of a single inflammatory/demyelinating lesion. For example, using this model, researchers have found extensive axonal degeneration following a single inflammatory lesion [6]. However, at present, it is unclear whether MOG–IFA induces subclinical neural injury elsewhere in the neuraxis and therefore, it is possible that the observed axonal degeneration is a consequence of multiple lesions along individual axons.
To monitor rodent models for possible signs of injury, behavioral tests like the open field Basso–Beattie–Bresnahan (BBB) locomotor test [7] are often employed. In this test, a rat is observed individually for 4 min and then the locomotion is scored from 0 to 21 points. BBB is a well accepted and easily executable technique. However it is also subjective and does not correspond exactly to the entire spectrum of possible sensory and locomotor outcomes [8]. It also does not account for non-willingness of the rat to move.
Here we attempted to use an electrophysiological measure i.e. the somatosensory evoked potential to quantitatively, objectively and reliably monitor the neuronal events after MOG sensitization. A somatosensory evoked potential (SEP) is the electrical response of the nervous system to a sensory stimulus, recorded from the somatosensory cortex in the brain. It was described for the first time in 1947 by Dawson [9]. SEP is commonly used for clinical studies and provides valuable information regarding sensory pathways and thus, the functional integrity of the spinal cord [10,11]. For instance, injury to the spinal cord causes demyelination and manifests itself as a reduction in amplitude or an increase in latency in SEP waveforms [12,13]. Hence, similar techniques may be used to monitor the changes in amplitude/latency of SEP waveforms after MOG immunization in the EAE model.
In the present study, two experiments were conducted. Experiment I investigated the effect of MOG immunization alone, whereas Experiment II involved detailed characterization (SEP, MRI and histology) of focal myelitis due to MOG immunization followed by cytokine–ethidium bromide injection.
2. Materials and methods
2.1. Experimental paradigm
A total of 20 adult female Lewis rats, with an average body weight of 200–220 gm, were used in Experiment I, whereas 6 similar rats were used for Experiment II. Rats were housed individually per cage and had free access to food and water.
In Experiment I, the electrodes for SEP were implanted in all the rats, and baseline SEP recording and behavioral test was performed. Thereafter 17 rats (MOG group) were injected with MOG whereas 3 control rats (no-MOG group) received saline injection. Weekly SEP recordings and behavioral tests were performed on them for 3 weeks with the SEP recording done immediately following the BBB test on the same day. 21 days after MOG immunization, serum from rats was tested for anti-MOG-125 by titration.
In Experiment II, 6 rats were immunized with MOG followed by SEP electrode implantation after 3–4 days. Baseline post-MOG SEP recording was performed. 6 days after MOG immunization, lesion was induced in 3 rats using cytokine–ethidium bromide injection (focal myelitis group), whereas in 3 control rats, the spinal cord was injected with same volume of saline (intraspinal saline control group). Weekly SEP recordings were performed on all animals for 3 weeks. Three days after lesion induction, MRI was performed on a sample rat from each group; and after 21 days of injury, histology was performed on a sample rat from each group.
All experimental procedures were in accordance with the guidance provided in the Rodent Survival Surgery manual and were approved by the Institutional Animal Care and Use Committee at the Johns Hopkins University.
2.2. Anesthesia
For anesthesia, the rat was held in a transparent chamber with 3% isofluorane gas anesthesia and room air flow, and was removed from the chamber at the onset of drowsiness. Its mouth and nose was then placed within an anesthesia mask (with a well-fitting rodent size diaphragm), which was connected to a C-Pram circuit designed to deliver and evacuate the gas through one tube. A mixed flow of 1.5% isofluorane, 80% oxygen and room air was delivered to the mask at the rate of 2 L/min. Rats continued spontaneous breathing and the anesthesia depth level was maintained unchanged throughout the entire experiment. Rats were also placed on a blanket which was connected to heating pump to keep their body temperature at 37.5 °C ± 0.5 °C throughout the entire experiment.
2.3. SEP electrode implantation
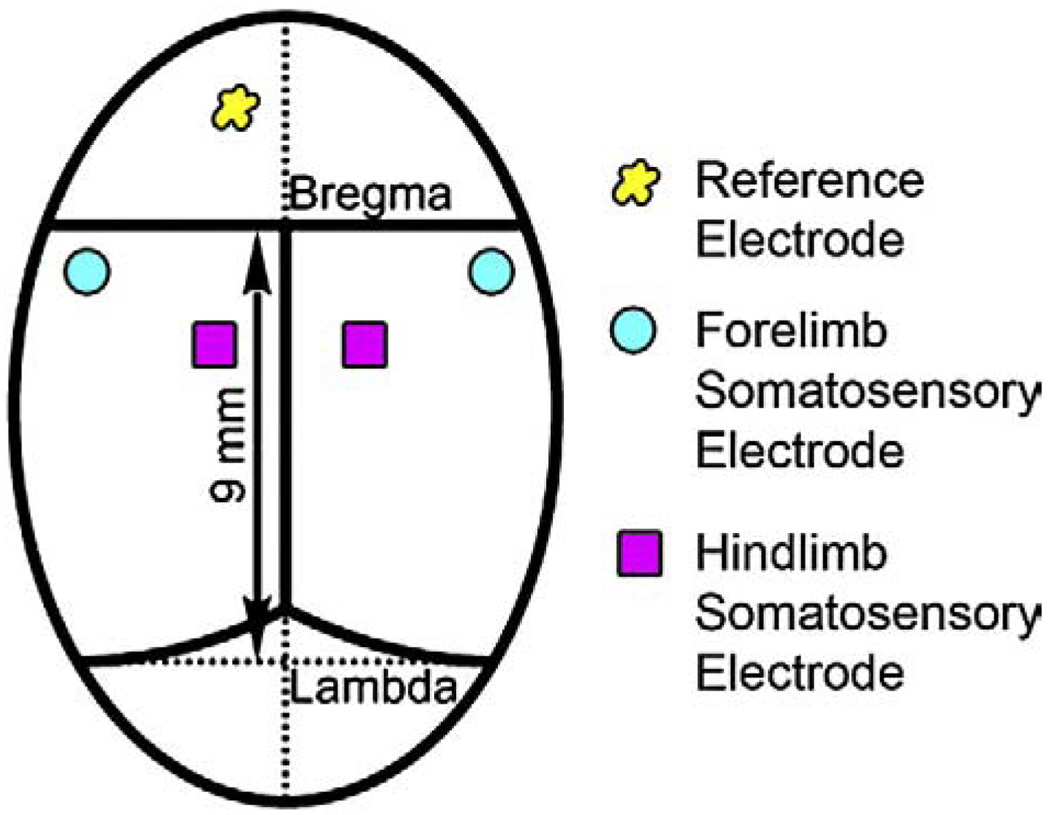
An incision was made on the anesthetized rat's head and the cranium bone was cleaned. Five transcranial screw electrodes (E363/20, Plastics One Inc., Roanoke, VA) were implanted on the somatosensory cortex in each hemisphere receiving input from sensory pathways originating in the hind and forelimbs (shown in Fig. 1). The electrodes made very light contact with the dura mater, but did not compress the dura or brain structures.
Fig. 1.
Position for five recording screw electrodes on the rat skull.
2.4. MOG–IFA injection
Recombinant myelin oligodendrocyte glycoprotein (rMOG) corresponding to the N-terminal sequence of rat MOG (amino acids 1 to 125) was emulsified in incomplete Freund's adjuvant (Sigma-Aldrich) as 1:1 mixture (Imject IFA;Pierce). 100 µl (50 µg per rat diluted in saline) of this emulsified MOG–IFA (from Dr. Sha Mi, Biogen-Idec, Cambridge, MA) was injected subcutaneously near the base of the tail of each rat at 2 contralateral sites (50 µl per area to minimize backflow).
2.5. Cytokine–ethidium bromide injection
The T9 segment of the spinal column of anesthetized rats was stabilized in stereotaxic frame and subjected to laminectomy. A Hamilton needle (31G) was used to bilaterally inject (2×2 µl) cytokines (250 ng of TNF-α, 150 U of INF-γ and 40 ng of IL-6) and ethidium bromide (1 µg) into dorsal white matter.
2.6. Multi-limb SEP recording and analysis
Prior to each SEP recording, rats were anesthetized for about 30 min as described before. Subcutaneous needle electrodes (Safelead F-E3-48, Grass-Telefactor, West Warwick, RI) were used for electrical stimulation of each of the four limbs. A pair of needle electrodes was inserted in each of the hindlimb and forelimb pairs, for the stimulation of the middle tibial and median nerve respectively, without direct contact to the nerve bundle. An isolated constant current stimulator (DS3, Digitimer Ltd., Hertfordshire, England) was used for the electrical stimulation of the limbs. Custom intraoperative neurological monitoring (INM) software (Infinite Biomedical Technologies, Baltimore, MD) was used to set the stimulation parameters and trigger the stimulator. Positive current pulses of 3.5 mA magnitude and 200 µs duration at a frequency of 1 Hz were used for limb stimulation. An advanced demultiplexer circuit was used to sequentially stimulate each of the four limbs at a frequency of 0.25 Hz.
Cortical somatosensory evoked potentials from the transcranial electrodes were amplified by an optically isolated biopotential amplifier (Opti-Amp 8002, Intelligent Hearing Systems, Miami, FL) with a gain of 30,000. The analog signal from each hemisphere was transferred to a personal computer via an optical data acquisition system with four input channels at a sampling rate of 5000 Hz. The SEP signals from each hemisphere, the stimulation pulse signal and the stimulated limb number were recorded on separate channels for (post-operative) data analysis.
Contralateral SEP recordings were used for analysis. The signal to noise ratio (SNR) was improved by ensemble averaging of 100 sweeps, with the averaging window shifting by 20 sweeps each time. To account for baseline differences across animals, each animal's recordings were standardized to baseline. The mean percent change in peak-to-peak amplitude and latency were computed for the two groups. Mean differences in each of these outcomes were examined using a repeated measures analysis of variance (ANOVA) with group (MOG versus no-MOG), extremity (right forelimb, left forelimb, right hindlimb, and left hindlimb), and study time (baseline, week 1, week 2, week 3) as main factors. All statistical analyses were conducted using SAS PC version 9.1.3 Service Pack 4 (SAS Institute, Cary, NC) and p-values of <0.05 were considered statistically significant.
2.7. Behavioral assessment
Motor functions of non-anesthetized rats were assessed using the Basso, Beattie and Bresnahan (BBB) Locomotor Rating Scale, an open-field locomotor test, which is one of the most widely used research tools to measure the outcome, progress, and/or recovery of SCI in rats [7]. It represents combinations of rat joint movements, hindlimb movements, stepping, forelimb and hindlimb coordination, trunk position and stability, paw placement, and tail position on a scale from 0 to 21.
2.8. MRI
In-vivo MR imaging was performed using Bruker 9.4T horizontal bore spectrometer. The anesthetized rats were immobilized in a custom-made probe, equipped with a 35 mm transmitter–receiver surface coil. Images were obtained using T2 weighted spin echo sequence (TR=2000 ms, TE=19 ms, slice thickness=1 mm, 4 averages and in plane resolution = 109 × 125 µm).
2.9. Histology
The rats were transcardially perfused with PBS followed by 4% paraformaldehyde fixation. The spinal cord tissue was then removed, postfixed, cryopreserved with 30% sucrose solution and snap frozen. 20 µm thick axial tissue sections were cut on the cryostat and the slides were processed for hematoxylin/eosin staining.
2.10. Titration for anti-MOG-125
The wells of a 96-well microtiter plate (Immulon 2HB; Thermo Scientific, Milford, MA) were coated overnight at 4 °C with 50 µl of a solution containing 5 µg/ml recombinant MOG1-125 (gift from Dr. Sha Mi, Biogen) diluted in phosphate-buffered saline (i.e. 250 ng/well). Coating solution was discarded and unoccupied binding sites were blocked for 2 h at room temperature with 250 µl of 5% bovine serum albumin ± 0.1% Tween-20 (both from Sigma) in PBS. Solution was discarded and 4- or 5-fold serial dilutions of rat serum (diluted in blocking solution) were added to each well (50 µl); each sample was performed in duplicate. After 2.5 h of incubation at room temperature, wells were washed with PBS ± 0.1% Tween-20 and secondary antibody (biotinylated goat anti-rat; Chemicon) was applied at 1:20,000 (diluted in blocking solution) for 1 h at room temperature. After further washing, streptavidin–HRP was applied for 30 min at room temperature (1:2500 in blocking solution; Biosource) and washed. Immunoreactive complexes were visualized with the substrate 3,3′,5,5′-tetramethylbenzidine (TMB; Sigma). The reaction was halted by adding 25 µl of 1 M H2SO4. The resulting yellow development product was measured at 450 nm. The titer was the dilution in which an optical density 2-fold over background levels (i.e. the OD from wells in which primary antibody was omitted) was recorded.
3. Results
3.1. MOG immunization
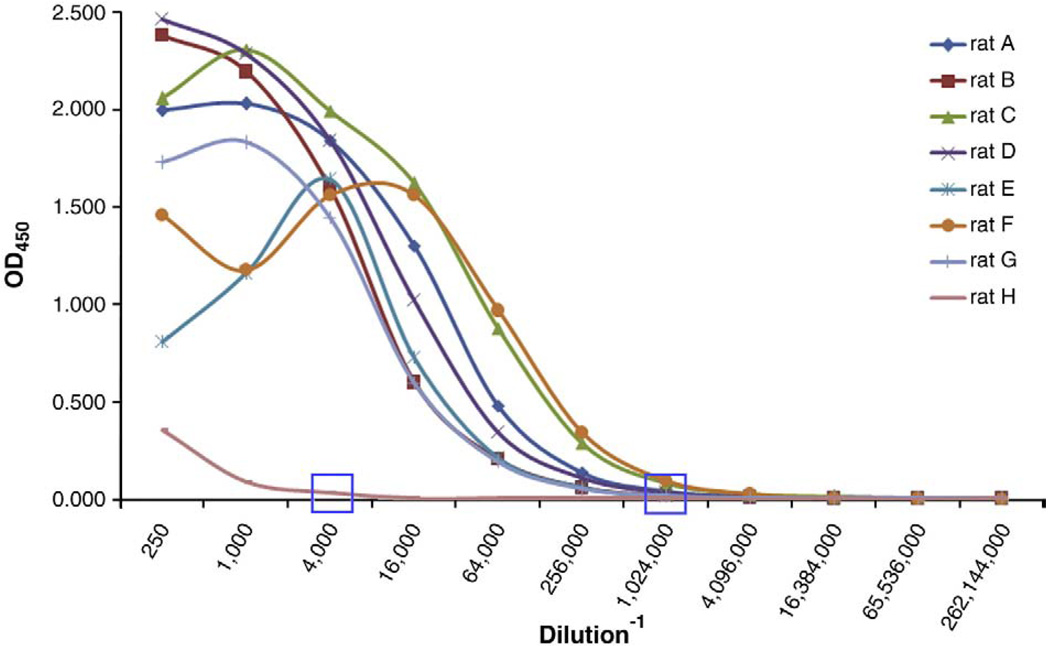
The titration of anti-MOG antibody demonstrated robust peripheral mounting of immune response against myelin in all immunized animals. The titers remained very low in control non-immunized rats (Fig. 2).
Fig. 2.
Titration of rat serum for anti-MOG1-125 (x-axis: dilution factor; y-axis: optical density measured at 450 nm).
3.2. Somatosensory evoked potentials (SEPs)
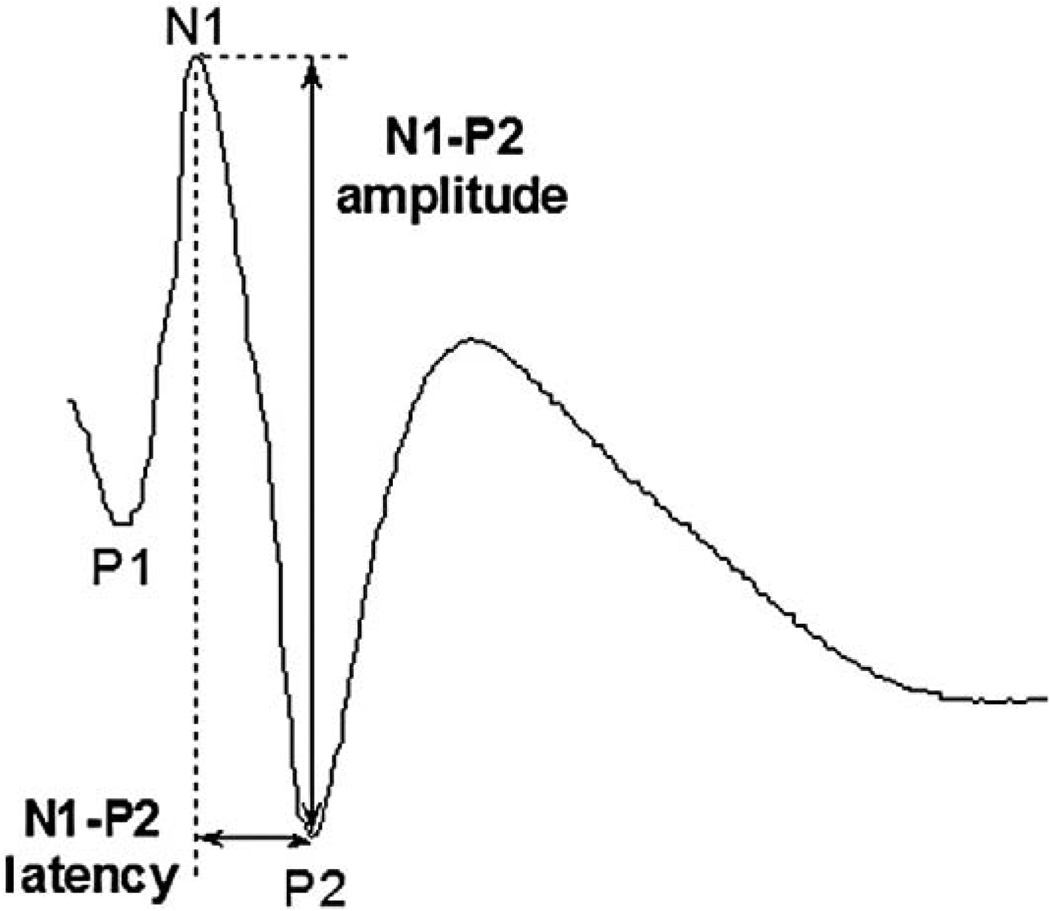
SEP in rats consists of three major identifiable components (Fig. 3), although some inter-animal variability might exist. Since the injury was induced at T9, the SEP signals from forelimbs' non-injured pathways were expected to stay constant at any time during the survival periods. They were used for internal control purposes to ensure the quality of the recordings and the electrodes at each time point. A change in SEP signals from forelimbs would indicate that other variants, apart from the desired injury, affected the SEP recordings.
Fig. 3.
Somatosensory evoked potential of a rat showing the three most prominent peaks.
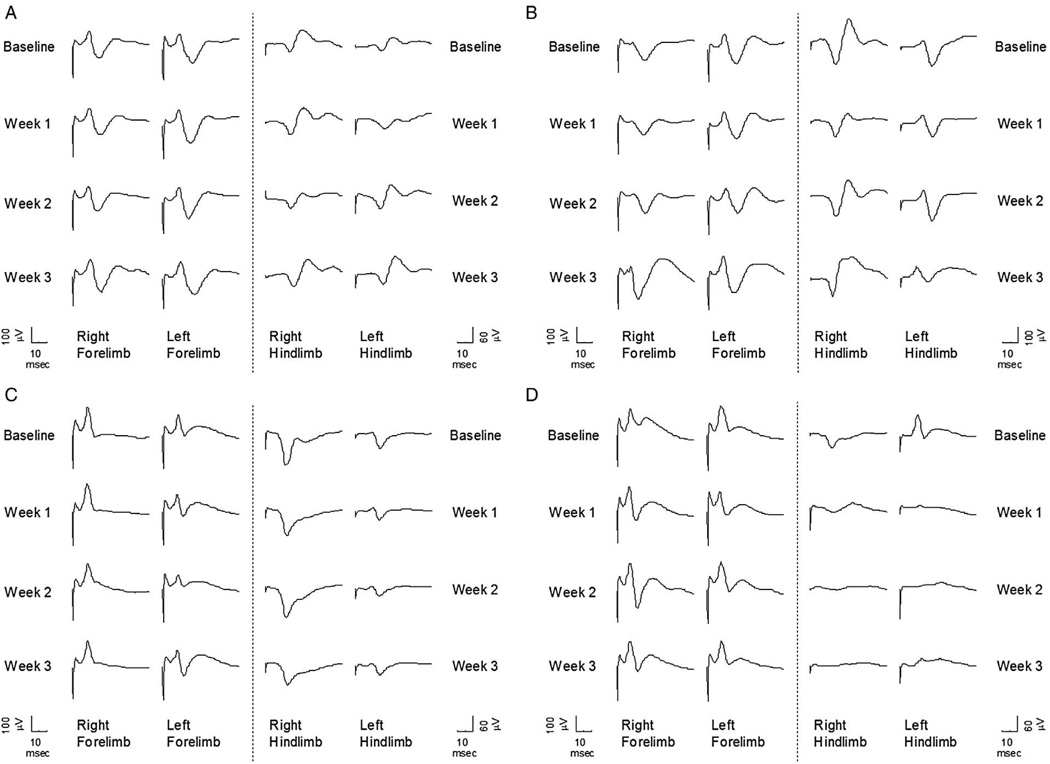
Fig. 4 shows sample rat SEP signals from both Experiment I (no-MOG vs. MOG groups) and Experiment II (focal myelitis vs. intraspinal saline) for all the study times (baseline, week 1, week 2, week 3). As it can be clearly seen, there is no major change in SEP waveforms over time for both the no-MOG and MOG groups. However the hindlimb SEP signals from the focal myelitis group degrade significantly from the baseline signals as opposed to the intraspinal saline group.
Fig. 4.
SEP for different stages for a rat from (A) no-MOG group, (B) MOG group, (C) intraspinal saline group, and (D) focal myelitis group.
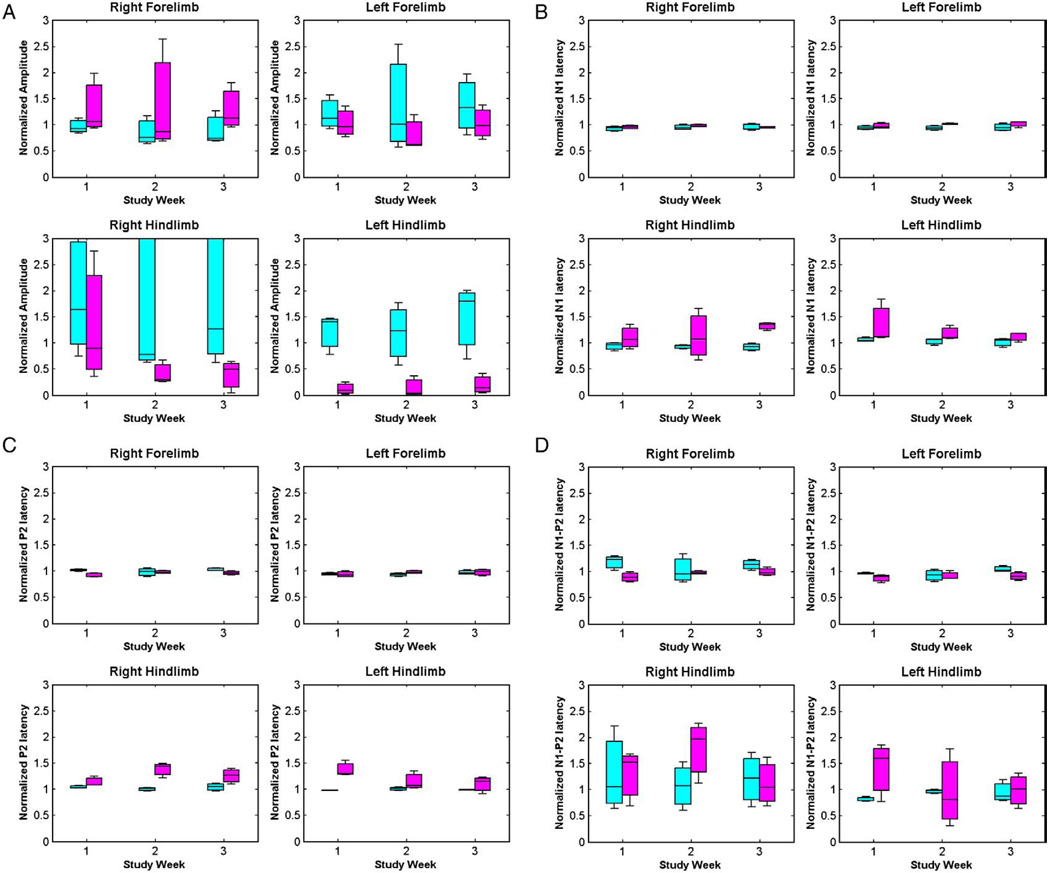
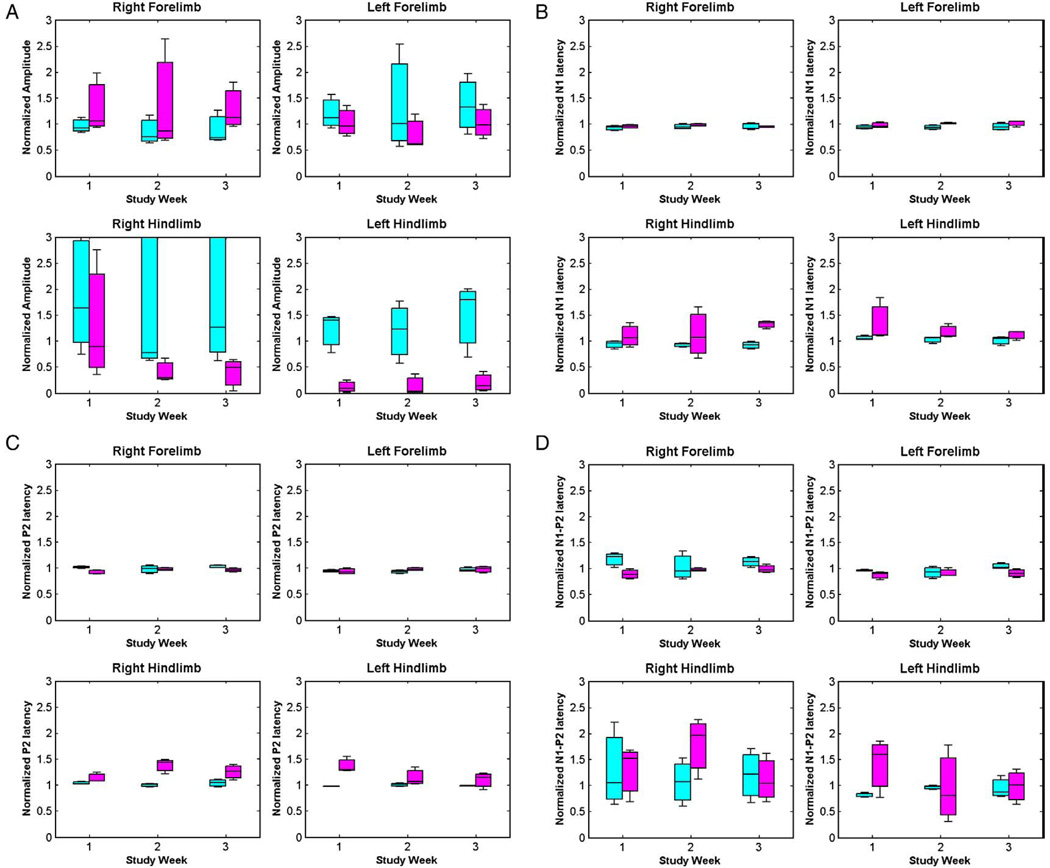
The box plots of standardized amplitudes and latencies for all the rats in both the experiments are plotted in Figs. 5 and 6. The hypothesis testing was done using repeated measures ANOVA to obtain comparisons between no-MOG vs. MOG groups, and focal myelitis vs. intraspinal saline groups. There are no significant mean differences between the no-MOG and MOG groups (all p values >0.01). Comparing the focal myelitis vs. intraspinal saline groups, there is a significant difference between the hindlimb SEP signals [N1 latency right hindlimb (p<0.001), P2 latency right hindlimb (p = 0.001), and N1–P2 amplitude left hindlimb (p = 0.001)] showing the effect of the focal lesion of the spinal cord at T9 on the hindlimb SEP signals.
Fig. 5.
Box plots for (A) amplitude, (B) N1 latency, (C) P2 latency, and (D) N1–P2 latency for no-MOG group (cyan) and MOG group (magenta). (For interpretation of the references to colour in this figure legend, the reader is referred to the web version of this article.)
Fig. 6.
Box plots for (A) amplitude, (B) N1 latency, (C) P2 latency, and (D) N1–P2 latency for intraspinal saline group (cyan) and focal myelitis group (magenta). (For interpretation of the references to colour in this figure legend, the reader is referred to the web version of this article.)
3.3. Behavioral BBB scores
Our results are well supported by the weekly BBB behavior test scores for the no-MOG vs. MOG groups, which remained constant at 21 (out of 21) over the entire duration of the experiment, thus confirming that there was no clinical effect of MOG sensitization on the rats.
3.4. MRI and histology
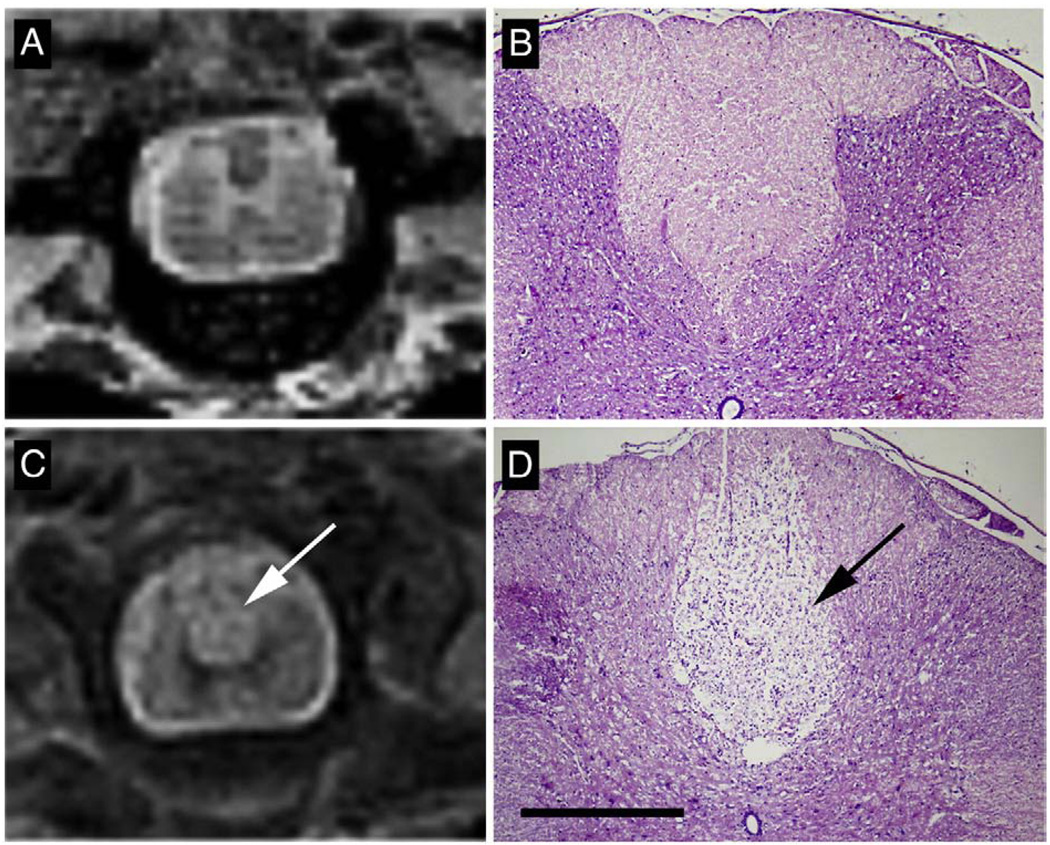
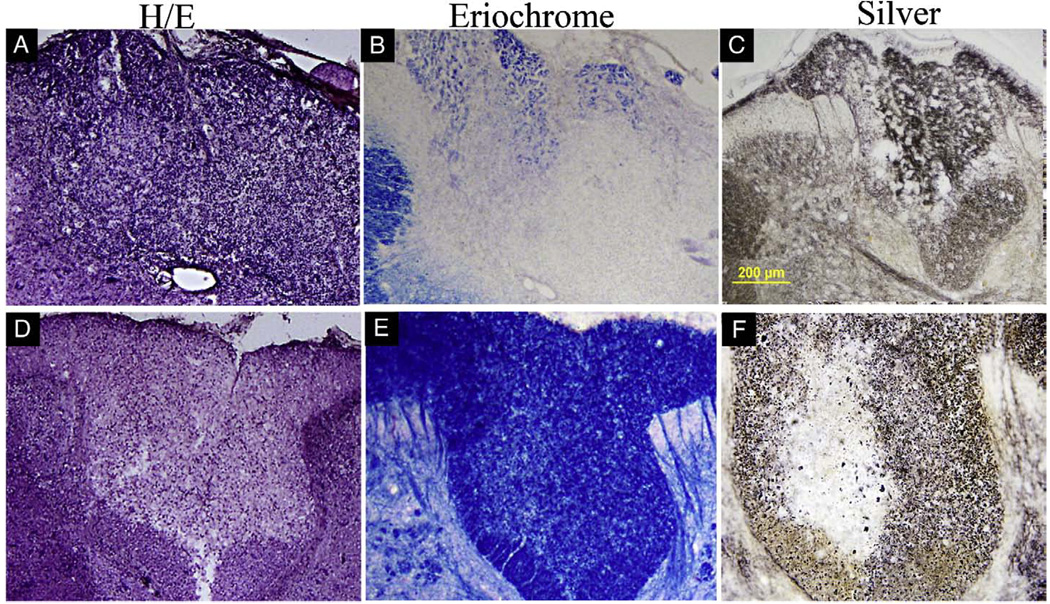
T2-weighted MRI of thoracic spinal cord in MOG-sensitized animals with intraspinal saline injection did not show any signs of demyelination (Fig. 7A). Similarly hematoxylin/eosin stain in this group did not reveal pathological signs (Fig. 7B). In contrast, in MOG-sensitized animals subjected to focal administration of cytokine–ethidium bromide solution, there was an increased T2 signal in the dorsal region of the spinal cord at the T9 region (Fig. 7C) and histology showed pale staining in the dorsal funiculus and in adjacent grey matter (Fig. 7D). Analysis of brain and brainstem slices of MOG alone and focal myelitis did not reveal inflammation, axonal injury or demyelination in any other region of the neuraxis (data not shown). Further histologic examination of the focal myelitis group revealed an inflammatory infiltrate (Fig. 8A), demyelination (Fig. 8B) and axonal damage (Fig. 8C) at the site of the lesion (T9). More rostral sections of the spinal cord showed no evidence of inflammation or demyelination (Fig. 8D–E) but there was some evidence of Wallerian degeneration as defined by pallor within the dorsal column after silver staining.
Fig. 7.
In MOG-immunized rats with intraspinal saline injection, T2-weighted MRI (A) demonstrated normal structure of spinal cord with noticeable delineation of white and gray matter. Similarly histological hematoxylin–eosin stain of spinal cord cross sections in this group (B) showed normal anatomy without leukocyte infiltration. In animals injected with cytokine/ethidium bromide mixture, increased T2 signal was observed in the dorsal part of the spinal cord at T9 (C, arrow). Hematoxylin–eosin stain (D) revealed pallor consistent with tissue injury (arrow). Robust demyelination and leukocyte infiltration was observed in dorsal funiculus and in lesser extent in adjacent grey matter. Scale bar in D = 500 µm.
Fig. 8.
Histologic examination of the neuraxis in focal myelitis. At T9 in the spinal cord (A–C), there was focal inflammation as defined by hematoxylin and eosin (H/E) staining (A), demyelination as defined by loss of blue color on eriochrome staining (B) and axonal injury as defined by abnormal silver staining (C). At more rostral levels (D–F), there was no increased cellularity on H/E staining (D), no demyelination on eriochrome staining (E) but Wallerian degeneration was identified on silver staining as pallor within a region of the dorsal column (F).
4. Conclusion and discussion
In this manuscript, we have utilized SEP recordings to interrogate the function of the nervous system in adult Lewis rats given MOG immunization. Although it has been well reported that adult rats given MOG–IFA do not have clinical disease, there has been no previous report of evoked potentials in MOG–IFA treated rats. We show in this manuscript thatMOG–IFA treated rats generate very high titers of anti-MOG antibodies but that they exhibit no clinical or evoked potential abnormalities. Interestingly, MOG–CFA treated rats develop similar anti-MOG auto-antibodies and yet develop multifocal CNS inflammatory disease [14]. Both CFA and IFA are water-in-oil emulsions that have been shown to increase the immunogenicity of antigens. IFA, unlike CFA, does not contain killed Mycobacterium tuberculosis, and is less able to stimulate cellular autoimmune responses. It is this difference which may underlie the ability of MOG–CFA to induce widespread clinical demyelination in immunized rats as opposed to MOG–IFA.
MOG–IFA has, therefore, been proposed as a strategy to develop an autoimmune diathesis in rats but no clinical disease. Overt clinical disease could then be triggered focally within the CNS by direct injection of inflammatory factors into the spinal cord [5]. In [5], control rats with subcutaneous injection of 100 µl of saline emulsified in IFA, followed by stereotactic injection of cytokines, showed a very low disease incidence of 5.3%, as opposed to 100% incidence in rats with subcutaneous injection of 100 µl of MOG (25 to 50 µg diluted in saline) emulsified in IFA. This showed that the peripheral immune priming against a myelin protein using MOG is necessary to trigger the cortical demyelination. MOG is an important factor for inducing focal EAE. The immunological rationale and further discussion about this focal EAE model can be found in [5].
In our experiments, after cytokine–ethidium bromide injection into the spinal cord at T9, evoked potential shows significant degradation for the hindlimbs. It is presumed that the autoimmune diathesis, combined with direct gliotoxic effect of ethidium bromide and the focal inflammation, results in monofocal demyelination. Thus, evoked potentials provide a sensitive read-out for focal spinal cord injury induced by MOG–IFA followed by intraspinal cytokines–ETBr. Indeed, we have previously shown by imaging and histologic analyses, that there is extensive axonal degeneration rostral to the focal inflammatory lesion in ascending sensory pathways using similar model [6].
There has been no rigorous analyses yet as to whether MOG–IFA induces subclinical lesions or injury. Only behavioral techniques like open field BBB test have been used to assess the possibility of injury, which is a very subjective method. Without a reliable quantitative proof, it has until now remained possible that the axonal and functional effects of MOG–IFA with focal intraspinal injection of inflammatory factors are due to multifocal rather than monofocal demyelination. Our results, using SEP measures, reassure affirmatively that MOG–IFA does not induce demyelination/injury since we used a more sensitive and rigorous methodology than previously used.
We also conclude, based on the cytokine–ethidium bromide injection experiment, that SEP recordings can be used to longitudinally interrogate conduction of CNS neurons in vivo and that this methodology may be an appropriate way to study demyelination, axonal injury and/or remyelination in adult rodents.
Acknowledgment
The study was supported by the Johns Hopkins Project RESTORE fund (Transverse Myelitis Research Project) and the Maryland Stem Cell Research Fund 2007-MSCRFII-0159-00. A part of this study was also supported under the grants RO1 NS045062, NMSS RG 3630 and National Multiple Sclerosis Society Grant (PP1491).
References
- 1.Linington C, Webb M, Woodharns PL. A novel myelin-associated glycoprotein defined by a mouse monoclonal antibody. J Neuroimmnunol. 1984;6:387–396. doi: 10.1016/0165-5728(84)90064-x. [DOI] [PubMed] [Google Scholar]
- 2.Scolding NJ, Frith S, Linington C, Morgan BP, Campbell AK, Compston DAS. Myelin-oligondendrocyte glycoprotein (MOG) is a surface marker of oligodendrocyte maturation. J Neuroimmunol. 1989;22:169–176. doi: 10.1016/0165-5728(89)90014-3. [DOI] [PubMed] [Google Scholar]
- 3.Sun J, Link H, Olsson T, Xiao BG, Andersson G, Ekre HP, et al. T and B cell responses to myelin-oligodendrocyte glycoprotein in multiple sclerosis. J Immunol. 1991;146:1490–1495. [PubMed] [Google Scholar]
- 4.Kerlero de Rosbo N, Milo R, Lees MB, Burger D, Bernard CCA, Ben-Nun A. Reactivity to myelin antigens in multiple sclerosis: peripheral blood lymphyocytes respond predominantly to myelin oligodendrocyte glycoprotein. J Clin Invest. 1993;92:2602–2608. doi: 10.1172/JCI116875. [DOI] [PMC free article] [PubMed] [Google Scholar]
- 5.Kerschensteiner M, Stadelmann C, Buddeberg BS, Merkler D, Bareyre FM, Anthony DC, et al. Targeting experimental autoimmune encephalomyelitis lesions to a predetermined axonal tract system allows for refined behavioral testing in an animal model of multiple sclerosis. Am J Pathol. 2004;164:1455–1469. doi: 10.1016/S0002-9440(10)63232-4. [DOI] [PMC free article] [PubMed] [Google Scholar]
- 6.DeBoy CA, Zhang J, Dike S, Shats I, Jones M, Reich DS, et al. High resolution diffusion tensor imaging of axonal damage in focal inflammatory and demyelinating lesions in rat spinal cord. Brain. 2007;130:2199–2210. doi: 10.1093/brain/awm122. [DOI] [PubMed] [Google Scholar]
- 7.Basso DM, Beattie MS, Bresnahan JC. A sensitive and reliable locomotor rating scale for open field testing in rats. J Neurotrauma. 1995;12:1–21. doi: 10.1089/neu.1995.12.1. [DOI] [PubMed] [Google Scholar]
- 8.Agrawal G, Thakor NV, All AH. Evoked potential versus behavior to detect minor insult to spinal cord in rat model. J Clin Neurosci. 2008 doi: 10.1016/j.jocn.2008.08.009. doi:10.1016/j.jocn.2008.08.009. [DOI] [PubMed] [Google Scholar]
- 9.Dawson GD. Cerebral response to electrical stimulation of peripheral nerve in man. J Neurol Neurosurg Psychiatry. 1947;10:137–140. doi: 10.1136/jnnp.10.3.134. [DOI] [PMC free article] [PubMed] [Google Scholar]
- 10.Grundy BL. Intraoperative monitoring of sensory evoked potentials. In: Nodar RH, Barber C, editors. Evoked Potentials II. Boston: Butterworth; 1984. p. 624. [Google Scholar]
- 11.Nuwer MR. Spinal cord monitoring with somatosensory techniques. J Clin Neurophysiol. 1998;15:183–193. doi: 10.1097/00004691-199805000-00002. [DOI] [PubMed] [Google Scholar]
- 12.Chiappa K. Evoked Potentials in Clinical Medicine. 2nd ed. New York, NY: Raven Press; 1990. [Google Scholar]
- 13.Nuwer MR. Fundamentals of evoked potentials and common clinical applications today. Electroencephalogr Clin Neurophysiol. 1998;106:142–148. doi: 10.1016/s0013-4694(97)00117-x. [DOI] [PubMed] [Google Scholar]
- 14.Stefferl A, Brehm U, Storch M, Washington DL, Bourquin C, Wonigeit K, et al. Myelin oligodendrocyte glycoprotein induces experimental autoimmune encephalomyelitis in the “resistant” brown Norway rat: disease susceptibility is determined by MHC and MHC-linked effects on the B cell response. J Immunol. 1999;163:40–49. [PubMed] [Google Scholar]


