

Abstract
Pathological biomechanical stresses cause cardiac hypertrophy, which is associated with QT prolongation and arrhythmias. Previous studies have demonstrated that repolarizing K+ current densities are decreased in pressure overload-induced left ventricular hypertrophy, resulting in action potential and QT prolongation. Cardiac hypertrophy also occurs with exercise training, but this physiological hypertrophy is not associated with electrical abnormalities or increased arrhythmia risk, suggesting that repolarizing K+ currents are upregulated, in parallel with the increase in myocyte size, to maintain normal cardiac function. To explore this hypothesis directly, electrophysiological recordings were obtained from ventricular myocytes isolated from two mouse models of physiological hypertrophy, one produced by swim-training of wild-type mice and the other by cardiac-specific expression of constitutively active phosphoinositide-3-kinase-p110α (caPI3Kα). Whole-cell voltage-clamp recordings revealed that repolarizing K+ current amplitudes were higher in ventricular myocytes isolated from swim-trained and caPI3Kα, compared with wild-type, animals. The increases in K+ current amplitudes paralleled the observed cellular hypertrophy, resulting in normalized or increased K+ current densities. Electrocardiographic parameters, including QT intervals, as well as ventricular action potential waveforms in swim-trained animals/myocytes were indistinguishable from controls, demonstrating preserved electrical function. Additional experiments revealed that inward Ca2+ current amplitudes/densities were also increased in caPI3Kα, compared with WT, left ventricular myocytes. The expression of transcripts encoding K+, Ca2+ and other ion channel subunits was increased in swim-trained and caPI3Kα ventricles, in parallel with the increase in myocyte size and with the global increases in total cellular RNA expression. In contrast to pathological hypertrophy, therefore, the functional expression of repolarizing K+ (and depolarizing Ca2+) channels is increased with physiological hypertrophy, reflecting upregulation of the underlying ion channel subunit transcripts and resulting in increased current amplitudes and the normalization of current densities and action potential waveforms. Taken together, these results suggest that activation of PI3Kα signalling preserves normal myocardial electrical functioning and could be protective against the increased risk of arrhythmias and sudden death that are prevalent in pathological cardiac hypertrophy.
Introduction
Cardiac hypertrophy, an adaptive response of the myocardium to increased load, occurs in a variety of disease states, including hypertension and myocardial infarction, and is associated with an increased risk of life-threatening ventricular arrhythmias (Haider et al. 1998). Abnormal electrical function in cardiac hypertrophy (Mayet et al. 1996; McIntyre & Fry, 1997) reflects at least in part reductions in repolarizing K+ current densities (Nabauer et al. 1996; Marionneau et al. 2008). Reduced K+ currents can prolong the action potential and increase repolarization dispersion. Both effects are arrhythmogenic and predispose individuals to life-threatening arrhythmias (McIntyre & Fry, 1997; Oikarinen et al. 2004).
Recent studies in a mouse model of pressure overload-induced left ventricular hypertrophy (LVH) produced by transverse aortic constriction (TAC) revealed that the observed reductions in the densities of repolarizing K+ currents are not associated with K+ channel subunit gene/protein downregulation (Marionneau et al. 2008). Rather, in TAC left ventricular myocytes, increased myocyte size is the main factor in determining the reductions in K+ current densities. The observed decreases in functional K+ current densities, therefore, result directly from the failure to upregulate K+ channel subunit expression levels in proportion to the increase in myocyte size (Marionneau et al. 2008). Interestingly, exercise also causes cardiac hypertrophy, especially in trained athletes, although this physiological hypertrophy is not associated with electrical abnormalities or increased arrhythmia risk (Mayet et al. 1999; Biffi et al. 2008). These observations suggest that repolarizing K+ currents are upregulated in parallel with the increase in myocyte size in physiological hypertrophy to maintain normal myocardial function. The studies presented here tested this hypothesis directly.
Initial experiments here were carried out in mice subjected to 4 weeks of exercise (swimming) training (McMullen et al. 2003). QT intervals, a reflection of ventricular depolarization and repolarization, in swim-trained mice were indistinguishable from controls, as determined from surface electrocardiograms. Ventricular action potential waveforms were also not significantly different in swim-trained and control left ventricle (LV) myocytes. In addition, whole-cell voltage-clamp experiments revealed that amplitudes of the repolarizing K+ currents were higher in swim-trained LV myocytes, and that repolarizing K+ current densities were maintained (or increased) in spite of marked increases in LV myocyte size.
Chronic exercise training activates the insulin-like growth factor 1 (IGF-1)- phosphoinositide-3-kinase p110α (PI3Kα) signalling pathway, and PI3Kα is the key signaling molecule mediating exercise training-induced physiological hypertrophy (McMullen et al. 2003). Marked upregulation of repolarizing K+ currents was also evident in a transgenic mouse model (caPI3Kα) of physiological hypertrophy produced by cardiac-specific expression of constitutively active PI3Kα (Shioi et al. 2000).
Molecular and biochemical analyses in both models of physiological hypertrophy revealed increases in the transcript and protein expression levels of the subunits encoding myocardial ion channels, in parallel with the increase in myocyte size and global increases in cellular protein/RNA expression, suggesting that increased myocardial ion channel subunit expression underlies the upregulated ionic currents and the maintenance of normal electrical function in physiological hypertrophy.
Methods
Experimental animals
Animals were handled in accordance with the Guide for the Care and Use of Laboratory Animals (NIH) and the ethical policies and regulations of The Journal of Physiology (Drummond, 2009). All protocols involving animals were approved by the Animal Studies Committee at Washington University Medical School. Initial experiments were performed on adult (8–10 week) male wild-type (WT) FVB/N mice subjected to chronic swim-training (McMullen et al. 2003). Briefly, animals were placed in a small tank (surface area of 225 cm2) filled with water maintained at 30–32°C to avoid thermal stress. Initial swim time was 20 min, increasing by 10 min per day until 90 min sessions were reached. Once attained, the 90 min training schedule was continued twice a day (separated by 4–5 h), 7 days a week, for 4 weeks. A total of 25 WT FVB/N mice were subjected to chronic swim-training. Additional experiments were carried out on adult (8–12 week) male mice with cardiac-specific expression of constitutively active phosphoinositide-3-kinase p110α (caPI3Kα) (n= 25) (Shioi et al. 2000) and WT littermate controls (n= 35).
Electrophysiological recordings
Surface electrocardiograms (ECG) were recorded from anaesthetized (Tribromoethanol, Avertin, 0.25 mg kg−1, i.p.) caPI3Kα and WT littermates, as well as from WT FVB/N mice before and after exercise training, using needle electrodes connected to a dual bioamplifier (PowerLab 26T, ADInstruments, Colorado Springs, CO, USA). The ECG signals were acquired for 2 min; the data were stored and subsequently analysed offline using LabChart 7.1 software (ADInstruments). Lead II recordings were chosen for analyses. In each record, the QT interval was determined as the time interval between the initiation of the QRS complex and the end of the T wave, defined as the time the negative deflection of the T wave returned to the baseline. The measurement is illustrated in Fig. 3A. QT intervals were corrected for heart rate using the formula QTc= QT/(√RR/100) (Mitchell et al. 1998). Body weights, tibia lengths and LV weights were measured and recorded at the time of tissue harvesting. Myocytes were isolated using described procedures (Brunet et al. 2004). Briefly, hearts were removed from anaesthetized animals, mounted on a Langendorf apparatus and perfused retrogradely through the aorta with 25 ml of (0.8 mg ml−1) collagenase-containing (type II, Worthington Biochemical Corp., Lakewood, NJ, USA) solution (Xu et al. 1999a,b;). Following the perfusion, the LV apex was separated using a fine scalpel and iridectomy scissors, mechanically dispersed, plated on laminin-coated coverslips and maintained in a 95% air–5% CO2 incubator. Whole-cell current- and voltage-clamp recordings were obtained from LV apex myocytes within 24 h of isolation at room temperature (22–24°C). All voltage- and current-clamp experiments were performed using an Axopatch 1B patch clamp amplifier (Molecular Devices, Sunnyvale, CA, USA) interfaced to a microcomputer with a Digidata 1332 analog/digital interface and the pCLAMP9 software package (Molecular Devices). Data were filtered at 5 kHz before storage.
Figure 3. ECG and action potential waveforms in swim-trained and control animals are indistinguishable.
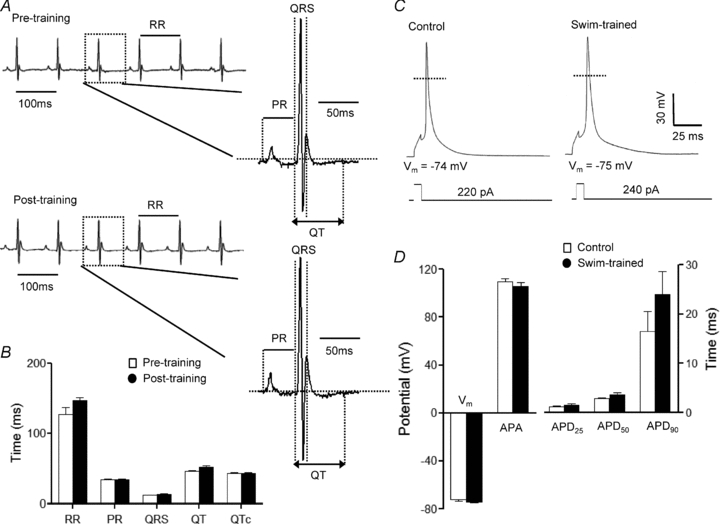
A, representative ECG (lead II) waveforms from an anaesthetized adult WT mouse before and 4 weeks after swim-training are illustrated. B, mean ±s.e.m. RR, PR, QRS, QT and QTc intervals in animals before and after swim-training are not significantly different. C, mean ±s.e.m. action potential amplitudes (APA) and action potential durations at 25% (APD25), 50% (APD50) and 90% (APD90) repolarization in swim-trained and control LV myocytes are not significantly different (D).
For recordings of whole-cell K+ currents, pipettes contained (in mm): KCl 135; EGTA 10; Hepes 10; K2ATP 5; and glucose 5 (pH 7.2; 310 mosmol l−1). The bath solution contained (in mm): NaCl 136; KCl 4; MgCl2 2; CaCl2 1; CoCl2 5; tetrodotoxin (TTX) 0.02; Hepes 10; and glucose 10 (pH 7.4; 300 mosmol l−1). For recordings of whole-cell voltage-gated Ca2+ currents (ICa), the CoCl2 was omitted from the bath and the KCl in the pipette and bath solutions was replaced with CsCl (140 mm) and TEACl (4 mm), respectively. The TTX and the CoCl2 were omitted from the bath solution for current-clamp recordings.
Whole-cell voltage-gated outward K+ (Kv) currents were recorded in response to 4.5 s voltage steps to test potentials between −60 and +40 mV from a holding potential (HP) of −70 mV. Currents (IK1) through inward rectifier K+ (Kir) channels, evoked in response to hyperpolarization to −120 mV from the same HP, were also recorded in each cell. Whole-cell voltage-gated inward Ca2+ currents (ICa), evoked in response to 250 ms voltage steps to test potentials between −30 and +50 mV from a prepulse to −40 mV, presented from the holding potential (−70 mV) to inactivate the voltage-gated Na+ currents; the protocol is illustrated in the legend to Fig. 9. Action potentials were elicited in response to brief (<5 ms) depolarizing current injections of varying amplitudes, delivered at 1 Hz.
Figure 9. Depolarizing Ca2+ (ICa) current amplitudes are increased in LV myocytes from adult caPI3Kα mice.
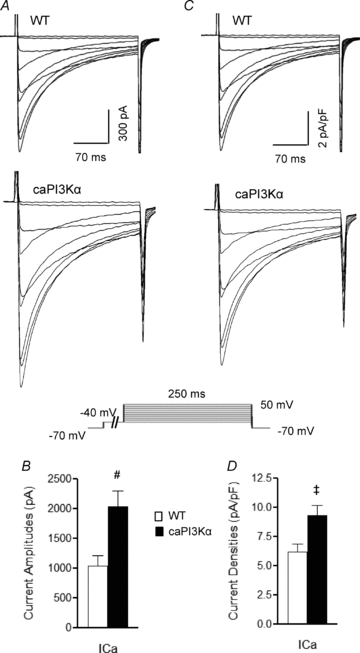
A, representative whole-cell Ca2+ currents recorded from myocytes isolated from the LV apex of WT and caPI3Kα mice. Currents were evoked in response to (250 ms) voltage steps to test potentials between −30 and +50 mV from a prepulse potential of −40 mV (used to inactivate Na+ currents); the protocol is illustrated below the records. Mean ±s.e.m. Ca2+ current amplitudes (at +10 mV) are significantly higher in caPI3Kα, compared with WT, LV myocytes (B). Current amplitudes were normalized for differences in cell size, and representative (C) and mean ±s.e.m. (D) ICa densities are illustrated. Values indicated are significantly (‡P < 0.05, #P < 0.01) different in caPI3Kα and WT LV myocytes.
Voltage-clamp data were compiled and analysed using Clampfit (v. 9.2, Molecular Devices) and Microsoft Excel. Integration of the capacitative transients recorded during brief ±10 mV voltage steps from the holding potential (−70 mV) provided the whole-cell membrane capacitance (Cm). Leak currents were always <100 pA, and were not corrected. Series resistances (<9 MΩ) were routinely compensated electronically (=80%). Voltage errors resulting from the uncompensated series resistance were ≤8 mV and were not corrected. The input resistances of adult mouse wild-type (n= 20), swim-trained (n= 32) and caPI3Kα (n= 25) LV myocytes were indistinguishable, with mean ±s.e.m. values of 290 ± 23 MΩ, 310 ± 38 MΩ and 268 ± 32 MΩ, respectively. Peak Kv current and IK1 amplitudes were measured as the maximal amplitudes of the outward and inward currents, respectively, evoked at each test potential under the recording conditions described above. Peak ICa amplitudes were measured as the differences between the peak inward current and the current at the end of the depolarizing voltage step. Current amplitudes were normalized to whole-cell membrane capacitances (in the same cell) to provide current densities (in pA pF−1). The time constants of inactivation (τdecay) and the amplitudes of the individual Kv current components, Ito,f, IK,slow and Iss, were determined from double exponential fits to the decay phase of the outward K+ currents, as described previously (Brunet et al. 2004). Resting membrane potentials, action potential amplitudes and action potential durations at 25%, 50% and 90% repolarization were also measured.
Histology
Swim-trained and WT mice were anaesthetized with intraperitoneal injection of ketamine (86 mg kg−1) and xylazine (13 mg kg−1) and perfused with 4% paraformaldehyde in 0.1 mol l−1 phosphate buffer. Isolated ventricular tissue was embedded in paraffin, sectioned and stained with Masson trichrome (DeBosch et al. 2006). Ventricular myocyte cross-sectional area was measured using an Axioskop microscope (Carl Zeiss, Inc., Chester, VA, USA) and the Axiovision 4.0 software (Carl Zeiss) (DeBosch et al. 2006).
Transcript analyses
Total RNA from the LV of swim-trained and control animals was isolated and DNase treated using described methods (Marionneau et al. 2005). RNA concentrations were determined by optical density measurements. Using equal amounts of mRNA, transcript analyses of genes encoding ion channel pore-forming (α) and accessory subunits, markers of pathological hypertrophy, as well as of control genes, including glyceraldehyde 3-phosphate dehydrogenase (Gapdh), hypoxanthine guanine phosphoribosyl transferase (Hprt), and the nuclear membrane protein lamin A/C (Lmna) (Table 2), were carried out using SYBR green RT-PCR in a two-step process (Marionneau et al. 2005, 2008). All data were analysed using the threshold cycle (CT) relative quantification method. These data were normalized to the value measured (in the same sample) for Lmna, which encodes the nuclear membrane protein lamin A/C, to reference the transcript expression data to the number of nuclei (i.e. the number of myocytes) in the sample. Because only myocyte size (not number) is increased in cardiac hypertrophy (Hannan et al. 2003), this method provided relative differences in transcript expression levels on a per myocyte basis. For each transcript, these normalized values were then expressed relative to the mean value determined for the control LV samples, and mean ±s.e.m. normalized values are presented. Expression of each channel subunit transcript was also normalized to the total cellular RNA in the same sample, which increases with cardiac hypertrophy (Hannan et al. 2003). This method allows direct comparisons of the observed changes in channel subunit expression levels relative to the overall increase in RNA.
Table 2.
Sequence specific primers used in SYBR Green RT-PCR
| Gene | Forward Primer | Reverse Primer | |
|---|---|---|---|
| Kv4.2 | (Kcnd2) | 5′-TGAATCACGTTTGTGTCATTAGTGA | 5′-TTCAACTTGCGCTCATCTTAGG |
| Kv4.3 | (Kcnd3) | 5′-GCCGCAGCACCTAGTCGTT | 5′-CACCACGTCGATGATACTCATGA |
| KChIP2 | (Kcnip2) | 5′-GGCTGTATCACGAAGGAGGAA | 5′-CCGTCCTTGTTTCTGTCCATC |
| Kvβ1 | (Kcnab1) | 5′-AAATACCCAGAAAGGCAAGTGT | 5′-ATCTAGCATGTGCCGAGGAA |
| Kv1.5 | (Kcna5) | 5′-CCTGCGAAGGTCTCTGTATGC | 5′-TGCCTCGATCTCTCTTTACAAATCT |
| Kv2.1 | (Kcnb1) | 5′-CACACAGCAATAGCGTTCAACTT | 5′-AGGCGTAGACACAGTTCGGC |
| TASK1 | (Kcnk3) | 5′-GCTTCCGCAACGTCTATGC | 5′-GGGATGGAGTACTGCAGCTTCT |
| Kir2.1 | (Kcnj2) | 5′-AAGAGCCACCTTGTGGAAGCT | 5′-CTTCTGAAGTGATCCTAGATTTGAGA |
| Kir2.2 | (Kcnj12) | 5′-AGCACCACCCTGACCACAAT | 5′-CTGAGCAACCCTACCCCAA |
| KvLQT1 | (Kcnq1) | 5′-ACCATCGCCTCCTGTTTCTCT | 5′-CCCGCTGGGAGTGCAA |
| mERG | (Kcnh2) | 5′-CCGGGTGCGGGAGTTTAT | 5′-CGAGGCGCTGGCGTAAT |
| Mink | (Kcne1) | 5′-CCCAATTCCACGACTGTTCTG | 5′-CCGCCCTGTTCAGCTGTCT |
| MiRP2 | (Kcne3) | 5′-TGCTGTGCTGAAGGCTCTGA | 5′-CAGGCCGGCAGAGCAA |
| Nav1.5 | (Scn5a) | 5′-AGTGCCACCAATGCCTTGTAC | 5′-GCGGAGGGTCGTGTTGTG |
| Navβ1 | (Scn1b) | 5′-TGGCAGAGATGGTGTACTGC | 5′-TCCACTGCAGAACTGTGAGG |
| Cav1.2 | (Cacna1c) | 5′-CCCTTCTTGTGCTCTTCGTC | 5′-ACACCCAGGGCAACTCATAG |
| Cavβ2 | (Cacnb2) | 5′-GTACCTTCCATGCGACCAGT | 5′-ATTGTATCCGCGTCAAGGAC |
| Cavα2δ1 | (Cacna2d1) | 5′-CACTGCTGTGGCAAGTGTTT | 5′-TTACATCCTGAGCGTTGCTG |
| ANF | (Nppa) | 5′-CACTGTGGCGTGGTGAACA | 5′-TCGTGATAGATGAAGGCAGGAA |
| Cx43 | (Gja1) | 5′-ACAAGTCCTTCCCCATCTCTCA | 5′-GTGTGGGCACAGACACGAAT |
| Cx40 | (Gja5) | 5′-CCAAACCAGGAGCAGATTCC | 5′-GCGTACTCTGGCTTCTGGCTAT |
| HPRT | (Hprt) | 5′-TGAATCACGTTTGTGTCATTAGTGA | 5′-TTCAACTTGCGCTCATCTTAGG |
| GAPDH | (Gapdh) | 5′-ACTCCACTCACGGCAAATTC | 5′-TCTCCATGGTGGTGAAGACA |
| Lamin A/C | (Lmna) | 5′-GGCTACAGACGCTGAAGGAG | 5′-CTGTTCCACCTGGTCCTCAT |
Biochemical analyses
Protein lysates were prepared from the LV of caPI3Kα, WT, and swim-trained WT animals using described methods (Guo et al. 2005). Protein concentrations were determined using the BCA Protein Assay Kit (Pierce/Thermo Fisher Scientific Inc., Rockford, IL, USA). For Western blot analyses, equal amounts of total proteins prepared from individual control and experimental animals were loaded on SDS-PAGE gels. The following commercially available antibodies were used: rabbit polyclonal anti-Kv4.2, anti-Kir2.2 (Millipore, Billerica, MA, USA); rabbit polyclonal anti-TASK1 (Alomone Labs, Jerusalem, Israel); mouse monoclonal anti-GAPDH (Abcam, Cambridge, MA, USA); rabbit polyclonal anti-phospho-Akt(S473), anti-total Akt, anti-phospho-ribosomal protein S6(S235/236), and anti-phospho-GSK3β(S9) (Cell Signaling Technology, Danvers, MA, USA); and rabbit polyclonal anti-lamin A/C (Santa Cruz Biotechnology, Santa Cruz, CA). The mouse monoclonal anti-KChIP2 and anti-Kv2.1 antibodies were developed by and obtained from the UC Davis/NIH NeuroMab Facility, supported by NIH grant U24NS050606 and maintained by the University of California, Davis. The specificities of the anti-Kv4.2, anti-KChIP2, anti-Kv2.1 and anti-TASK1 antibodies have all been tested on protein extracts from mice in which the genes encoding these subunits have been eliminated by homologous recombination. In each case, no signals corresponding to the targeted channel subunit were detected.
After washing, the membrane strips were incubated for 2 h at room temperature with alkaline phosphatase-conjugated secondary antibody diluted in blocking buffer, and bound antibodies were detected using a chemiluminescent alkaline phosphatase substrate. Protein band intensities were quantified by densitometry (Quantity One Basic Software, Bio-Rad Laboratories, Hercules, CA, USA), and the measured abundances were normalized to the expression of lamin A/C (evident as a doublet at 62 and 69 kDa) in the same sample on the same blot. For each protein, these values were then expressed relative to the mean control LV value; mean ±s.e.m. normalized values are presented. Channel subunit protein expression levels were also normalized to the total cellular protein (in the same sample) to allow direct comparison of observed changes relative to the global increases in cellular protein associated with cardiac hypertrophy (Hannan et al. 2003).
Statistical analyses
All averaged electrophysiological, molecular and biochemical data are presented as means ±s.e.m. The statistical significance of differences between experimental groups was evaluated by one-way analysis of variance (ANOVA), followed by post hoc Tukey's multiple comparison test. In some cases, Student's t test or the Mann–Whitney U test was used to evaluate the differences between groups. A two-tailed P value <0.05 was considered statistically significant.
Results
Exercise-induced ventricular myocyte hypertrophy and K+ current upregulation
As previously reported (McMullen et al. 2003), the experiments here revealed that chronic swim-training in mice results in marked ventricular hypertrophy. The mean ±s.e.m. left ventricular mass to tibia length ratio (LVM/TL), for example, is significantly (P < 0.001) higher (by 27 ± 4%) in swim-trained, compared with untrained (Fig. 1A), animals. Histological measurements in trichrome-stained transverse LV sections revealed that mean ±s.e.m. LV myocyte cross-sectional area is significantly (P < 0.001) larger in swim-trained, compared with control, hearts (Fig. 1B and C). Also consistent with previous reports (Hannan et al. 2003; McMullen et al. 2003), therefore, swim-training induced physiological hypertrophy is associated with increased LV myocyte size without an increase in myocyte number.
Figure 1. Chronic (4 week) swim-training results in LV myocyte hypertrophy and increased phosphorylation of the downstream targets of the PI3Kα, Akt, ribosomal protein S6 and GSK3β.
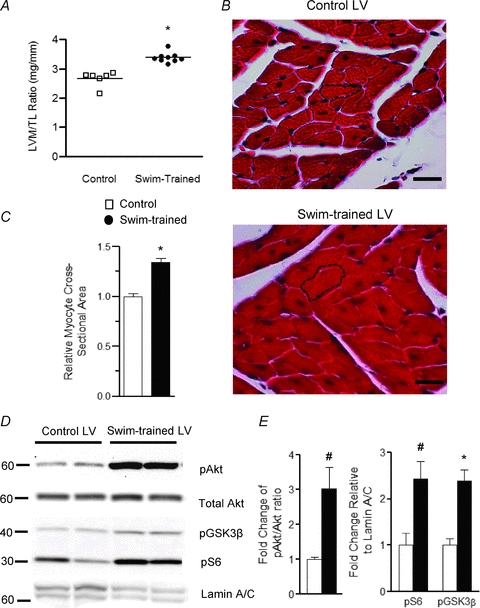
A, LV mass/tibia length (LVM/TL) ratios were determined in control (n= 6) and swim-trained (n= 9) animals; individual and mean ±s.e.m. values are plotted. B, representative transverse LV sections from control and swim-trained animals, stained with Masson Trichrome, are shown. The black dashed lines outline individual myocytes; scale bar = 20 μm. C, mean ±s.e.m. cross-sectioned area of LV myocytes in control (n= 50) and swim-trained (n= 50) LV. Mean values in A and C are significantly different (*P < 0.001). D, representative Western blots of fractionated LV proteins from control (n= 4) and swim-trained (n= 4) animals probed for phospho-Akt (pAkt), total Akt, phospho-GSK3β (pGSK3β), phospho-ribosomal protein S6 (pS6), and the nuclear membrane protein lamin A/C; equal amounts of proteins were loaded in each lane. E, the expression levels of each of these proteins were determined. pAkt levels were normalized to total Akt, whereas pS6 and pGSK3β levels were normalized to lamin A/C in the same sample. The mean ±s.e.m. relative expression levels of pAkt, pS6 and pGSK3β are significantly (#P < 0.01, *P < 0.001) higher in swim-trained, compared with control, LV.
Biochemical experiments were also conducted to examine the extent of phosphorylation of Akt, ribosomal protein S6 and glycogen synthase kinase 3β (GSK3β), previously shown to be increased with swim-training induced hypertrophy (McMullen et al. 2003). As illustrated in Fig. 1D, Western blot analyses revealed increased phosphorylation of Akt, ribosomal protein S6 and GSK3β in swim-trained, compared with control, LV, consistent with the activation of PI3Kα signalling with exercise (McMullen et al. 2003). As also shown in Fig. 1D, however, the relative expression of the nuclear membrane protein lamin A/C was lower in the samples from swim-trained, compared with control, animals. This observation is consistent with the suggestion (see above) that cardiac hypertrophy reflects an increase in myocyte size, but not in the numbers of (nuclei) myocytes (Hannan et al. 2003) and suggests that normalizing protein expression data to lamin A/C (see Methods) will allow comparison of protein expression levels based on the numbers of cells (nuclei) in each sample.
Whole-cell voltage-clamp recordings from LV myocytes isolated from control and swim-trained mice revealed that the amplitudes of the peak outward Kv (IK,peak) and the inwardly rectifying Kir (IK1) currents were significantly (P < 0.01) higher in LV myocytes from the swim-trained animals (Fig. 2A and B). Kinetic analyses of the decay phases of the outward currents (Brunet et al. 2004) provided the amplitudes of the individual components (Ito,f, IK,slow and Iss) of the peak Kv currents, each of which is significantly higher in LV myocytes from swim-trained animals (Fig. 2B). In contrast, there were no measurable differences in the time- (Table 1) or the voltage- (data not shown) dependent properties of the Kv currents in cells from control and swim-trained mice. Consistent with the hypertrophic growth of the LV, however, whole-cell membrane capacitance (Cm) values were significantly (P < 0.01) higher in myocytes from swim-trained, compared with control, animals with mean ±s.e.m.Cm values of 183 ± 4 pF (n= 32) and 156 ± 5 pF (n= 20), respectively (Fig. 2C). The observed increases in current amplitudes (Fig. 2B), however, were sufficient to offset the cellular hypertrophy (Fig. 2C) to maintain repolarizing K+ current densities similar to control levels (Fig. 2D and E). Indeed, Iss and IK1 densities were actually higher in LV myocytes from swim-trained, compared with control, animals (see Discussion).
Figure 2. Repolarizing K+ current amplitudes are increased in ventricular myocytes from swim-trained mice.
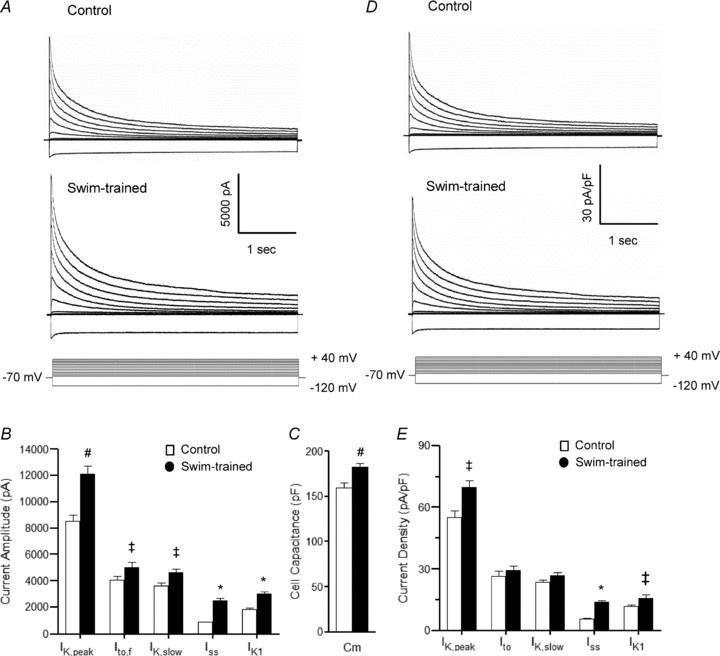
A, representative whole-cell K+ currents recorded from myocytes isolated from the apex of the LV of control and swim-trained mice. Currents were evoked in response to (4.5 s) voltage steps to test potentials between −120 and +40 mV from a holding potential (HP) of −70 mV; the protocol is illustrated below the records. Mean ±s.e.m. K+ current amplitudes in LV myocytes from swim-trained animals are larger than in control LV myocytes (B). Mean ±s.e.m.Cm is also significantly higher in cells from swim-trained animals (C), reflecting the increase in myocyte size. Normalizing current amplitudes for differences in cell size provided K+ current densities (D and E). Mean ±s.e.m. K+ current densities in LV myocytes following swim-training are similar to (or higher than) control LV myocytes (see text). Values indicated are significantly (‡P < 0.05, #P < 0.01, *P < 0.001) different in LV myocytes from control and swim-trained animals.
Table 1.
Kv and Kir currents in WT control, swim-trained and caPI3Kα LV myocytes
| n | WT Control 20 | Swim-trained 32 | caPI3Kα 25 | ANOVA | |
|---|---|---|---|---|---|
| Cm (pF) | 156 ± 5 | 183 ± 4# | 202 ± 7* | P < 0.0001 | |
| Ipeak | td (ms) | – | – | – | |
| Amplitude (pA) | 8535 ± 462 | 11561 ± 519# | 14941 ± 827* | P < 0.0001 | |
| Density (pA pF−1) | 55.0 ± 3.4 | 66.5 ± 3.5‡ | 77.6 ± 5.2# | P < 0.0001 | |
| Ito,f | td (ms) | 88 ± 10 | 93 ± 10 | 90 ± 8 | N.S. |
| Amplitude (pA) | 4042 ± 321 | 5016 ± 384‡ | 6052 ± 597# | P < 0.01 | |
| Density (pA pF−1) | 26.5 ± 2.5 | 27.3 ± 2.4 | 32.1 ± 3.5 | N.S. | |
| IK,slow | td (ms) | 981 ± 40 | 1168 ± 72 | 1093 ± 44 | N.S. |
| Amplitude (pA) | 3615 ± 226 | 4612 ± 288‡ | 7027 ± 512* | P < 0.0001 | |
| Density (pA pF−1) | 23.4 ± 1.4 | 25.4 ± 1.6 | 36.1 ± 2.7* | P < 0.05 | |
| Iss | td (ms) | – | – | – | |
| Amplitude (pA) | 868 ± 35 | 2471 ± 169* | 1862 ± 145* | P < 0.0001 | |
| Density (pA pF−1) | 5.7 ± 0.3 | 13.8 ± 0.8* | 9.4 ± 0.6* | P < 0.0001 | |
| IK1 | td (ms) | – | – | – | |
| Amplitude (pA) | −1811 ± 106 | −2946 ± 156* | −2694 ± 150* | P < 0.0001 | |
| Density (pA pF−1) | −11.7 ± 0.7 | −15.4 ± 1.6‡ | −13.8 ± 0.9‡ | P < 0.05 |
*All values are means ±s.e.m. Kv and Kir current amplitudes/densities were determined at +40 mV and −120 mV, respectively. The ANOVA column refers to the statistical significance of a one-way ANOVA test across each row. Values in caPI3Kα or in swim-trained LV myocytes that were significantly (‡P < 0.05, #P < 0.01, *P < 0.001) different from the values in control WT cells in the post hoc Tukey's multiple comparison test are indicated.
Functional consequences of exercise training-induced physiological hypertrophy
To examine the functional consequences of exercise-induced ventricular hypertrophy, paired surface ECG recordings were obtained from animals before and after the 4 week training protocol. Analyses of these records revealed that the morphologies of the QRS complexes, P and T waves (Fig. 3A), as well as the durations of the RR, PR, QRS and QT (and QTc) intervals (Fig. 3B), measured before and after training, were indistinguishable. In addition, action potential waveforms in control and swim-trained LV myocytes were similar (Fig. 3C), and mean ±s.e.m. action potential durations at 25% (APD25), 50% (APD50) and 90% (APD90) repolarization in control and swim-trained LV myocytes were not significantly different (Fig. 3D).
Molecular basis of K+ current upregulation in swim-trained LV
Physiological hypertrophy has been shown to be associated with global increases in total LV protein and RNA content (Hannan et al. 2003), suggesting that the observed increases in K+ current amplitudes in LV myocytes from swim-trained animals (Fig. 2A) reflect increased expression of the subunits encoding the underlying K+ channels. To explore this hypothesis directly, Western blot analyses, using K+ channel subunit-specific antibodies, were performed on protein lysates prepared from the LV of swim-trained and control animals. Equal amounts of proteins from individual animals were fractionated, probed and quantified. Expression of lamin A/C was also probed (Fig. 4A) and used for normalization (see Methods). Representative blots are presented in Fig. 4A.
Figure 4. Expression of K+ channel subunits is increased in the LV of swim-trained animals in parallel with the increase in total protein.
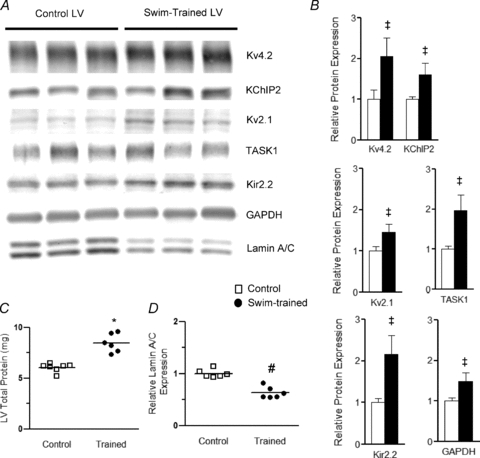
A, representative Western blots of fractionated LV proteins from control (n= 6) and swim-trained (n= 6) animals probed with anti-K+ channel subunit-specific antibodies, as well as anti-GAPDH and anti-nuclear membrane protein lamin A/C antibodies. B, the expression of each protein on each blot was measured and normalized to the expression of lamin A/C (evident as a doublet at 62 and 69 kDa) in the same sample on the same blot. Protein expression data were expressed relative to the mean value of the control LV samples. The mean ±s.e.m. relative expression levels of several K+ channel subunits, as well as GAPDH, are significantly (‡P < 0.05) higher in swim-trained, compared with control, LV. C, individual and mean ±s.e.m. total protein content are significantly (*P < 0.001) higher in swim-trained (n= 8), than in control (n= 6), LV (left). D, the individual and mean ±s.e.m. relative (to total protein) lamin A/C protein expression levels are significantly (#P < 0.01) lower in the LV from swim-trained (n= 6), compared with control (n= 6), animals (see text).
Quantitative analyses of these blots revealed that the mean ±s.e.m. normalized (to lamin A/C) expression levels of each of the K+ channel proteins examined (Fig. 4B) were increased in swim-trained, compared with control, LV. Specifically, the mean ±s.e.m. relative expression levels of Kv4.2, the Kv pore-forming subunit that underlies mouse ventricular Ito,f (Guo et al. 2005), and of the Ito,f channel accessory subunit KChIP2 (Kuo et al. 2001; Guo et al. 2002) were increased significantly (P < 0.05) in swim-trained, compared with control, LV (Fig. 4B). Marked increases in the expression of Kv2.1 (P < 0.05), which underlies one component of IK,slow, IK,slow2 (Xu et al. 1999a), and of the IK1 channel subunit, Kir2.2 (P < 0.01) (Zaritsky et al. 2001), as well as of the two-pore domain subunit (K2P), TASK1 (P < 0.05), suggested to encode ventricular Iss channels (Putzke et al. 2007), were also evident in swim-trained, compared with control, LV (Fig. 4B).
Consistent with previous reports (Hannan et al. 2003), total protein is also increased significantly (P < 0.001) in swim-trained (compared to control) LV (Fig. 4C). Normalization of the individual channel subunit protein expression levels to the total protein measured in the same sample revealed that each of the channel subunit proteins is increased in swim-trained LV in parallel with the overall increase in protein expression (Supplemental Fig. 1A), thereby maintaining relative (compared to total protein) ion channel subunit expression levels similar to WT control levels. In contrast, when compared to total protein, the relative expression level of lamin A/C is lower in swim-trained, compared with control, LV (Fig. 4D). The fact that the expression of lamin A/C is not increased in parallel with the global increase in protein expression is consistent with previous reports demonstrating increased myocyte size, but not myocyte number, in the hypertrophied heart (Hannan et al. 2003) and with the suggestion above that lamin A/C expression can be exploited to normalize protein expression data to cell (nuclei) number.
Further experiments revealed that the expression levels of the transcripts encoding Ito,f channel subunits, Kcnd2 (Kv4.2) and Kcnip2 (KChIP2), normalized to lamin A/C, were also increased (P < 0.01) in swim-trained, compared with control, LV (Fig. 5A), as is Kcnd3 (Kv4.3) (P < 0.01), the primary determinant of Ito,f in large mammals (Kaab et al. 1998; Kong et al. 1998; Wang et al. 1999). The expression level of the Kcnb1 transcript, which encodes the IK,slow2 channel subunit, Kv2.1, but not of Kcna5,which encodes the IK,slow1 channel subunit, Kv1.5 (Xu et al. 1999a; London et al. 2001), is also increased significantly (P < 0.01) with exercise (Fig. 5A). Similarly, expression of the IK1 channel transcripts Kcnj12 (Kir2.2) and Kcnj2 (Kir2.1) (Zaritsky et al. 2001), as well as of the putative Iss encoding, K2P channel subunit, Kcnk3 (TASK1) (Putzke et al. 2007), were higher (P < 0.05) in swim-trained, compared with control, LV (Fig. 5A). Expression of GAPDH is also increased with swim training, whereas atrial natriuretic factor (ANF), considered a marker of pathological hypertrophy (McMullen & Jennings, 2007), is not affected (Fig. 5B). In parallel with the global increase in protein (Fig. 4C), total RNA is also significantly (P < 0.001) higher (1.4-fold on average) in swim-trained, than in control, LV (Fig. 5C). Normalization of channel subunit transcript expression levels to the total cellular RNA measured in the same sample revealed that the increases in channel subunit transcript expression levels in swim-trained LV parallel the global increases in cellular RNA, maintaining relative (compared to total RNA) ion channel subunit expression levels at or near control levels (Supplemental Fig. 1B). The expression levels of transcripts encoding several other ion channel subunits (normalized to lamin A/C) were also increased in the LV of animals following exercise (Fig. 5E). For example, expression of Kcnh2 (mERG) and Kcnq1 (KvLQT1), the subunits which underlie the rapid and slow components of cardiac delayed rectification, IKr and IKs (Sanguinetti et al. 1995, 1996) in large mammals including humans, as well as voltage-gated Na+ and Ca2+ channel and gap junction channel subunit transcripts, were also increased with swim-training (Fig. 5E).
Figure 5. Increased LV expression of channel subunit transcripts with swim-training.
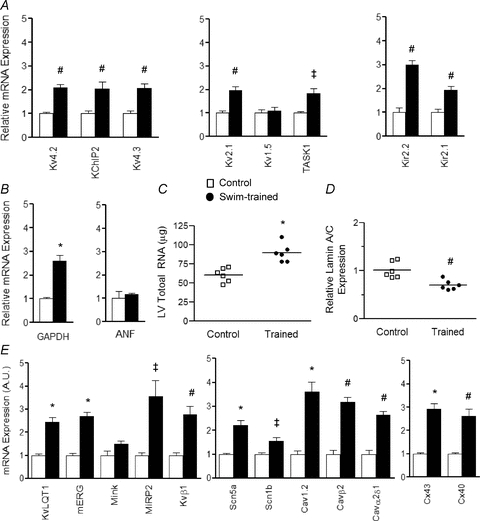
Channel subunit transcript expression levels were measured and normalized to Lmna expression in the same sample, and expressed relative to the mean value of the control LV samples. The mean ±s.e.m. relative expression levels of the transcripts encoding several K+ channel subunits (A) and GAPDH (B) are significantly (‡P < 0.05, #P < 0.01, *P < 0.001) higher in swim-trained LV, whereas expression of ANF (B), a marker of pathological hypertrophy, is similar in LV samples from control and swim-trained animals. C, similar to the protein data (Fig. 4), individual and mean ±s.e.m. total cellular RNA levels are higher in swim-trained (n= 6), compared with control (n= 6), LV, whereas the individual and mean ±s.e.m. relative expression levels of the lamin A/C transcript are significantly (#P < 0.01) lower (D) in the LV from swim-trained animals (see text). E, mean ±s.e.m. relative RNA expression levels of several other K+, Nav, Cav and gap junction channel subunit genes are also significantly (‡P < 0.05, #P < 0.01, *P < 0.001) higher in swim-trained, compared with control, LV.
Activation of cardiac PI3Kα signalling also results in K+ current upregulation
Chronic exercise training results in activation of PI3Kα and downstream signalling targets (Fig. 1), as previously demonstrated (McMullen et al. 2003; DeBosch et al. 2006; O'Neill et al. 2007). It has also been reported that cardiac specific transgenic overexpression of constitutively active PI3Kα (caPI3Kα) produces ventricular hypertrophy with normal cardiac function (Shioi et al. 2000). Subsequent experiments here, therefore, were aimed at determining if increasing cardiac PI3Kα signalling directly also results in the upregulation of repolarizing ventricular K+ currents.
Similar to the results obtained in the experiments conducted on myocytes from animals following chronic swim training (Fig. 2), IK,peak (P < 0.001) and IK1 (P < 0.001) amplitudes were significantly larger in caPI3K, compared with WT, LV myocytes (Fig. 6A and B). Analysis of the currents revealed that the amplitudes of Ito,f, IK,slow and Iss were all significantly (P < 0.01) higher in caPI3Kα, than in WT, LV myocytes (Fig. 6B), whereas the time- and voltage-dependent properties of the currents in caPI3Kα and WT cells were similar (Table 1). Consistent with the hypertrophic growth of caPI3Kα hearts, however, caPI3Kα LV myocytes were larger than WT cells. The mean ±s.e.m.Cm determined for caPI3Kα (202 ± 7 pF, n= 25) LV cells was significantly (P < 0.001) higher than the mean in WT (156 ± 5 pF, n= 20) cells (Fig. 6C). Normalization of the measured K+ current amplitudes (Fig. 6B) for differences in myocyte size (Fig. 6C) revealed that repolarizing K+ current densities in caPI3Kα LV myocytes were similar to, or actually higher than, the densities in WT LV cells (Fig. 6D and E). Additional electrophysiological experiments revealed no significant differences in resting membrane potentials, action potential waveforms, or ECG parameters in WT and caPI3Kα cells/animals (data not illustrated).
Figure 6. Repolarizing K+ currents are also upregulated in ventricular myocytes from adult caPI3Kα mice.
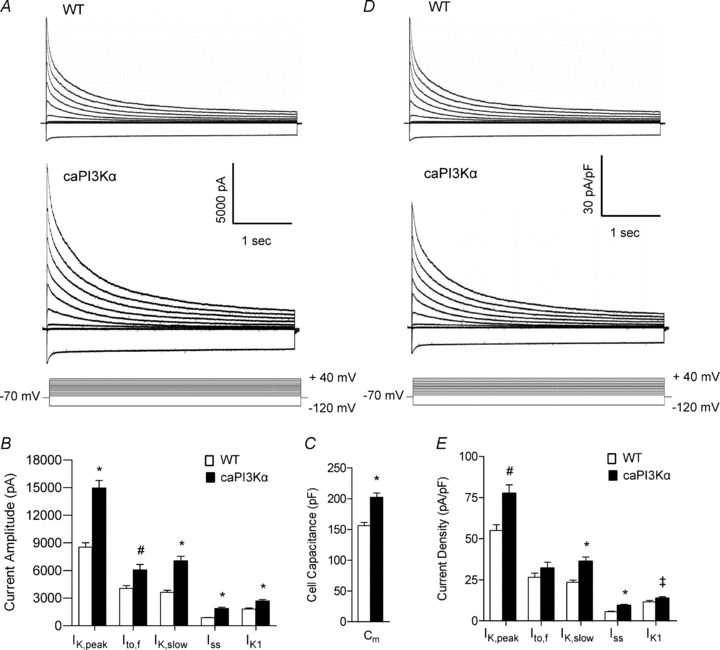
A, whole-cell K+ currents were recorded as described in the legend to Fig. 2 from myocytes isolated from the LV apex of caPI3Kα and WT mice. Mean ±s.e.m. K+ current amplitudes (B) and whole-cell Cm (C) are higher in caPI3Kα, than in WT, LV myocytes. After normalization for differences in cell size, K+ current densities (D and E) in caPI3Kα LV myocytes are similar to, or higher than, the densities in WT cells. Values indicated are significantly (‡P < 0.05, #P < 0.01, and *P < 0.001) higher in caPI3Kα LV myocytes compared with WT myoyctes.
Exploiting the same strategy as used in the analyses of the LV of swim-trained mice, biochemical experiments were conducted to examine K+ channel subunit protein expression levels in the LV of caPI3Kα, compared with WT, mice. As illustrated in Fig. 7, these experiments revealed that the protein expression levels of the Ito,f channel subunits (Kv4.2 and KChIP2), the IK,slow2 channel subunit (Kv2.1), the IK1 channel subunit (Kir2.2), and the putative Iss K2P channel subunit (TASK1) (normalized to lamin A/C) were all increased significantly (P < 0.05) in caPI3Kα, compared with WT, LV (Fig. 7A and B). Consistent with the marked hypertrophy in caPI3Kα hearts, total LV protein content is higher than in control LV (P < 0.001; Fig. 7C). Normalization of the channel subunit protein expression levels to the total protein measured in the same sample revealed that the observed increases in ion channel subunit protein expression were proportional to the global increase in total protein expression in caPI3Kα LV (Supplemental Fig. 2A). Similar to the observations in swim-trained animals, cardiac specific expression of caPI3Kα was also associated with marked increases in the expression levels of the transcripts encoding repolarizing K+ (as well as a number of other ion) channel subunits (Fig. 8A and E) and in total RNA (Fig. 8C), whereas ANF expression was unaffected in the caPI3Kα LV (Fig. 8B). The observed increases in channel subunit transcript expression levels in caPI3Kα LV also paralleled the increase in total cellular RNA (Supplemental Fig. 2B).
Figure 7. Expression levels of K+ channel subunit proteins are also increased in caPI3Kα LV, in parallel with the increase in total protein.
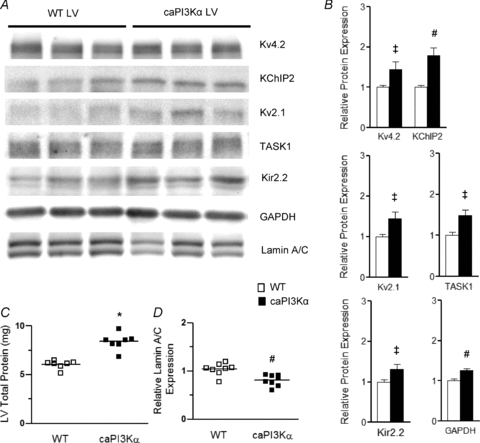
A, representative Western blots of fractionated ventricular proteins probed with anti-K+ channel subunit-specific antibodies, as well as with anti-GAPDH and anti-lamin A/C antibodies. B, mean ±s.e.m. (n= 8) K+ channel subunit (and GAPDH) expression levels are significantly (‡P < 0.05, #P < 0.01) higher in caPI3Kα, than in WT, LV. C, individual and mean ±s.e.m. (*P < 0.001) protein expression levels are higher in caPI3Kα (n= 8), than in WT (n= 8), LV. D, in contrast, the individual and mean ±s.e.m. relative (to total protein) expression levels of lamin A/C in caPI3Kα (n= 8) LV are significantly (#P < 0.01) lower than in WT (n= 8) LV (see text).
Figure 8. Expression levels of transcripts encoding channel subunits are also increased in caPI3Kα LV.
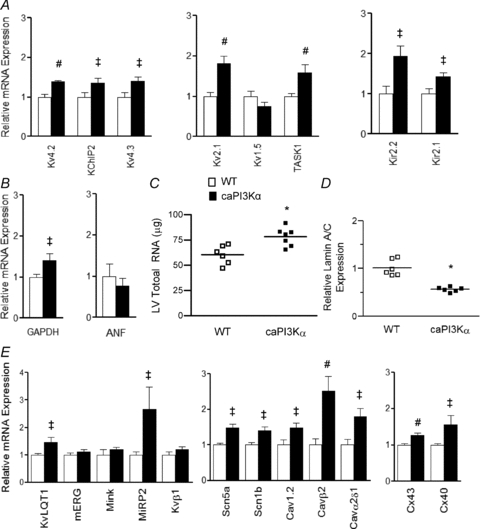
A, expression levels of several K+ channel subunits are significantly (‡P < 0.05, #P < 0.01) higher in caPI3Kα, compared with WT, LV. B, the mean ±s.e.m. relative transcript expression level of GAPDH, but not ANF, is higher in caPI3Kα than in WT LV. C, individual and mean ±s.e.m. (*P < 0.001) total RNA levels are higher in caPI3Kα (n= 6), compared with WT (n= 6), LV. D, similar to swim-trained animals, the individual and mean ±s.e.m. relative lamin A/C transcript expression levels are significantly (#P < 0.01) lower in caPI3Kα (n= 6), than in WT (n= 6), LV. E, the transcript expression levels of several other voltage-gated and gap junction channel subunit genes are also significantly (‡P < 0.05, #P < 0.01) increased in caPI3Kα, compared with control, LV.
Voltage-gated Ca2+ currents were also upregulated with physiological hypertrophy
The observation that the expression of repolarizing K+ currents is upregulated in physiological hypertrophy without altering action potential waveform and ECG parameters suggests that the amplitudes of (depolarizing) inward currents are likely to be also upregulated to maintain ventricular myocyte excitability. As noted above, RT-PCR analysis revealed that the transcripts encoding voltage-gated Na+ and Ca2+ channel pore-forming and accessory subunits were increased in caPI3Kα (Fig. 8D), as well as in swim-trained LV (Fig. 5E). Additional voltage-clamp experiments revealed that the peak voltage-gated inward Ca2+ current (ICa) amplitudes were significantly (P < 0.01) higher in caPI3Kα, than in WT, LV myocytes (Fig. 9A and B). Normalization of ICa amplitudes to myocyte size (Cm) revealed that inward Ca2+ current densities were also significantly (P < 0.05) increased in caPI3Kα, compared with WT, LV myocytes (Fig. 9C and D).
Discussion
Aerobic exercise training helps to preserve cardiac function, reducing detrimental ventricular remodelling and improving survival in animal models of heart failure (McMullen et al. 2007) and pressure/volume overload-induced LV hypertrophy (McMullen et al. 2003; Lachance et al. 2009). Several mechanisms have been proposed to account for the beneficial effects of exercise, including increased myocardial perfusion (Hambrecht et al. 2000), balanced autonomic nervous input (Coats et al. 1992), improved myocardial energy metabolism (O'Neill et al. 2007), reduced myocardial fibrosis (McMullen et al. 2003), and/or calcium handling (Medeiros et al. 2008). The results here demonstrate that exercise training also maintains normal electrical function through the transcriptional upregulation of ion channels in proportion to the increase in myocyte size.
Physiological ventricular hypertrophy in swim-trained and caPI3Kα mice
Ventricular hypertrophy is clearly evident in swim-trained and in caPI3Kα mice. Consistent with the increase in left ventricular mass, membrane capacitance measurements demonstrated that LV myocytes from swim-trained and caPI3Kα animals are significantly (P < 0.001) larger than control LV myocytes. Direct histological examination revealed increased LV myocyte cross-sectional area in swim-trained, compared with control, animals without interstitial fibrosis (Fig. 1B). The expression of ANF, a molecular marker of pathological hypertrophy (McMullen & Jennings, 2007), is not increased in swim-trained or caPI3Kα LV. Consistent with previous reports (McMullen et al. 2003, 2007), therefore, swim-training and cardiac-specific activation of PI3Kα signalling result in physiological hypertrophy.
Upregulation of ionic currents in swim-trained and caPI3Kα LV myocytes
The amplitudes of the repolarizing Kv (Ito,f, IK,slow and Iss) and Kir (IK1) currents are markedly increased in LV myocytes from both swim-trained and caPI3Kα mice. The results here clearly suggest that the observed upregulation of K+ currents with exercise training is directly related to the activation of PI3Kα signalling pathways. Establishment of this direct link warrants further investigation and could facilitate the development of therapeutic strategies aimed at normalizing/increasing K+ channel expression in pathological hypertrophy.
Importantly, the time- and voltage-dependent properties of the currents are indistinguishable from control LV myocytes, suggesting that the higher amplitudes of the K+ currents in swim-trained and caPI3Kα LV myocytes reflect increases in the numbers of functional K+ channels, rather than changes in channel properties. In the experiments here, IK1 amplitudes/densities were measured at −120 mV. Although this test potential is well outside the physiological range of membrane potentials, we assume, based on the observation that only current amplitudes (not properties) are affected, that IK1 amplitudes at more physiologically relevant membrane potentials will be increased proportionately. It is certainly possible, however, that the relative increase in IK1 at physiological voltages will be different from that measured at −120 mV. Additional experiments would be needed to address this point directly. The increases in K+ current amplitudes are sufficient to compensate for the cellular hypertrophy, normalizing K+ current densities in swim-trained and caPI3Kα myocytes to levels similar to controls. In fact, Iss and IK1 densities are actually higher in LV myocytes from both swim-trained and caPI3Kα animals. In caPI3Kα LV myocytes, IK,slow densities are also higher than in WT cells.
Although increased outward K+ current densities can lead to abbreviated myocardial action potential durations and shortened QT intervals (Brugada et al. 2004; Priori et al. 2005), no differences in action potential durations or QT intervals were observed in swim-trained or caPI3Kα, compared with control myocytes/animals. The normalization of action potential waveform and QT intervals is likely to reflect the fact that inward Ca2+ current densities are also increased in physiological hypertrophy, in parallel with the increases in repolarizing K+ currents.
Molecular mechanisms underlying the homeostatic regulation of myocardial excitability
The results presented here demonstrate that the observed increases in myocardial membrane currents in physiological hypertrophy primarily reflect increased expression of the transcripts/proteins encoding the underlying ion channel subunits. In addition, as clearly illustrated in Supplemental Figs 1 and 2, myocardial ion channel subunit (protein/transcript) expression levels in swim-trained and caPI3Kα LV are increased in parallel with the global increases in cellular protein/RNA expression, maintaining relative (to total protein and to cell size) ion channel subunit expression levels (i.e. densities) similar to WT controls. This is in striking contrast to pathological hypertrophy, in which ion channel subunit expression levels do not increase in parallel with the increases in cell size and total protein/RNA synthesis, resulting in decreased K+ current densities and impaired repolarization (Marionneau et al. 2008).
One exception to this generality of increased channel subunit expression with physiological hypertrophy is Kcna5, which encodes Kv1.5, and underlies mouse ventricular IK,slow1 (London et al. 2001); Kcna5 transcript expression was not measurably increased in swim-trained or caPI3Kα LV. It is possible that increased expression of Kv2.1, which underlies IK,slow2 (Xu et al. 1999a), alone is sufficient to account for the increase in IK,slow amplitudes in swim-trained and caPI3Kα LV myocytes. It is also possible that Kv1.5 protein expression is increased by post-transcriptional mechanisms and contributes to the observed increases in IK,slow amplitudes. The lack of a reliable anti-Kv1.5 specific antibody precludes a direct test of this hypothesis. Finally, additional post-transcriptional as well as post-translational mechanisms may contribute to the observed increases in functional channel expression (i.e. increases in current amplitudes and densities) with physiological hypertrophy.
Conclusions
Taken together, the results presented here demonstrate that physiological cardiac hypertrophy, induced by exercise training or transgenic activation of PI3Kα (a critical regulator of exercise-induced heart growth) signalling, is associated with increased expression of myocardial ion channel subunits in proportion to increased myocyte size and to the global increases in total RNA and protein expression. The upregulation of channel subunit expression levels translates directly into increased current amplitudes and to the normalization of current densities. No measurable differences in action potential waveforms or ECG parameters were observed in caPI3Kα, swim-trained or WT myocytes/animals. The resulting homeostatic regulation of myocardial electrical excitability clearly distinguishes physiological from pathological cardiac hypertrophy, which is associated with marked reductions in the densities of repolarizing K+ currents, action potential prolongation and increased risk of arrhythmias (McIntyre & Fry, 1997; Haider et al. 1998; Marionneau et al. 2008). These observations suggest that activating PI3Kα signalling pathways might be a useful therapeutic strategy to normalize the expression of K+ currents in pathological cardiac hypertrophy and in other cardiac diseases associated with reduced K+ current densities and impaired repolarization, thereby reducing the risk of life-threatening arrhythmias. Additional studies are needed to explore directly the hypothesis that activation of PI3Kα signalling pathways will impact the incidence of arrhythmias and the risk of sudden cardiac death in pathological hypertrophy.
Acknowledgments
These studies were supported by the National Heart, Lung and Blood Institute of the National Institutes of Health (HL-034161 and HL-066388 to J.M.N.) and the Midwest Affiliate of the American Heart Association (Predoctoral and Postdoctoral Fellowships to K.C.Y. and C.M., respectively). P.Y.J. is a Scholar of the Child Health Research Centre of Excellence in Developmental Biology (NIH K12-HD001487) at Washington University School of Medicine and N.C.F. was supported on an institutional training grant (T32-HL007275) from the National Heart, Lung and Blood Institute. There are no relationships with industry. The authors thank the Washington University Digestive Disease Research Core Centre for tissue sectioning and staining, and Dr Sharon Etzion for assistance with the histological analyses.
Glossary
Abbreviations
- ANF
atrial natriuretic factor
- APD
action potential duration
- Cav
voltage-gated Ca2+ channel
- caPI3Kα
constitutively active phosphoinositide-3-kinase p110α
- GAPDH
glyceraldehyde 3-phosphate dehydrogenase
- GSK3β
glycogen synthase kinase 3β
- IK1
inwardly rectifying K+ current
- IK,slow
slow-inactivating outward K+ current
- Iss
non-inactivating steady state outward K+ current
- Ito,f
fast transient outward K+ current
- K2P
two-pore domain K+ channel
- Kir
inward rectifier K+ channel
- Kv
voltage-gated K+ channel
- LV
left ventricle
- LVH
left ventricular hypertrophy
- Nav
voltage-gated Na+ channel
- PI3Kα
phosphoinositide-3-kinase p110α
- TAC
transverse aortic constriction
Author contributions
The conception and design of this study was by K.C.Y., N.C.F. and J.M.N. Experiments were carried out by K.C.Y., N.C.F. and C.M.. The data were analysed and interpreted by K.C.Y., N.C.F., C.M. and J.M.N. All authors contributed to writing the manuscript.
Supplemental material
Supplemental Figure 1
Supplemental Figure 2
As a service to our authors and readers, this journal provides supporting information supplied by the authors. Such materials are peer-reviewed and may be re-organized for online delivery, but are not copy-edited or typeset. Technical support issues arising from supporting information (other than missing files) should be addressed to the authors
References
- Biffi A, Maron BJ, Di Giacinto B, Porcacchia P, Verdile L, Fernando F, Spataro A, Culasso F, Casasco M, Pelliccia A. Relation between training-induced left ventricular hypertrophy and risk for ventricular tachyarrhythmias in elite athletes. Am J Cardiol. 2008;101:1792–1795. doi: 10.1016/j.amjcard.2008.02.081. [DOI] [PubMed] [Google Scholar]
- Brugada R, Hong K, Dumaine R, Cordeiro J, Gaita F, Borggrefe M, Menendez TM, Brugada J, Pollevick GD, Wolpert C, Burashnikov E, Matsuo K, Wu YS, Guerchicoff A, Bianchi F, Giustetto C, Schimpf R, Brugada P, Antzelevitch C. Sudden death associated with short-QT syndrome linked to mutations in HERG. Circulation. 2004;109:30–35. doi: 10.1161/01.CIR.0000109482.92774.3A. [DOI] [PubMed] [Google Scholar]
- Brunet S, Aimond F, Li H, Guo W, Eldstrom J, Fedida D, Yamada KA, Nerbonne JM. Heterogeneous expression of repolarizing, voltage-gated K+ currents in adult mouse ventricles. J Physiol. 2004;559:103–120. doi: 10.1113/jphysiol.2004.063347. [DOI] [PMC free article] [PubMed] [Google Scholar]
- Coats AJ, Adamopoulos S, Radaelli A, McCance A, Meyer TE, Bernardi L, Solda PL, Davey P, Ormerod O, Forfar C, et al. Controlled trial of physical training in chronic heart failure. Exercise performance, hemodynamics, ventilation, and autonomic function. Circulation. 1992;85:2119–2131. doi: 10.1161/01.cir.85.6.2119. [DOI] [PubMed] [Google Scholar]
- DeBosch B, Treskov I, Lupu TS, Weinheimer C, Kovacs A, Courtois M, Muslin AJ. Akt1 is required for physiological cardiac growth. Circulation. 2006;113:2097–2104. doi: 10.1161/CIRCULATIONAHA.105.595231. [DOI] [PubMed] [Google Scholar]
- Drummond GB. Reporting ethical matters in The Journal of Physiology: standards and advice. J Physiol. 2009;587:713–719. doi: 10.1113/jphysiol.2008.167387. [DOI] [PMC free article] [PubMed] [Google Scholar]
- Guo W, Jung WE, Marionneau C, Aimond F, Xu H, Yamada KA, Schwarz TL, Demolombe S, Nerbonne JM. Targeted deletion of Kv4.2 eliminates Ito,f and results in electrical and molecular remodeling, with no evidence of ventricular hypertrophy or myocardial dysfunction. Circ Res. 2005;97:1342–1350. doi: 10.1161/01.RES.0000196559.63223.aa. [DOI] [PubMed] [Google Scholar]
- Guo W, Li H, Aimond F, Johns DC, Rhodes KJ, Trimmer JS, Nerbonne JM. Role of heteromultimers in the generation of myocardial transient outward K+ currents. Circ Res. 2002;90:586–593. doi: 10.1161/01.res.0000012664.05949.e0. [DOI] [PubMed] [Google Scholar]
- Haider AW, Larson MG, Benjamin EJ, Levy D. Increased left ventricular mass and hypertrophy are associated with increased risk for sudden death. J Am Coll Cardiol. 1998;32:1454–1459. doi: 10.1016/s0735-1097(98)00407-0. [DOI] [PubMed] [Google Scholar]
- Hambrecht R, Wolf A, Gielen S, Linke A, Hofer J, Erbs S, Schoene N, Schuler G. Effect of exercise on coronary endothelial function in patients with coronary artery disease. N Engl J Med. 2000;342:454–460. doi: 10.1056/NEJM200002173420702. [DOI] [PubMed] [Google Scholar]
- Hannan RD, Jenkins A, Jenkins AK, Brandenburger Y. Cardiac hypertrophy: a matter of translation. Clin Exp Pharmacol Physiol. 2003;30:517–527. doi: 10.1046/j.1440-1681.2003.03873.x. [DOI] [PubMed] [Google Scholar]
- Kaab S, Dixon J, Duc J, Ashen D, Nabauer M, Beuckelmann DJ, Steinbeck G, McKinnon D, Tomaselli GF. Molecular basis of transient outward potassium current downregulation in human heart failure: a decrease in Kv4.3 mRNA correlates with a reduction in current density. Circulation. 1998;98:1383–1393. doi: 10.1161/01.cir.98.14.1383. [DOI] [PubMed] [Google Scholar]
- Kong W, Po S, Yamagishi T, Ashen MD, Stetten G, Tomaselli GF. Isolation and characterization of the human gene encoding Ito: further diversity by alternative mRNA splicing. Am J Physiol Heart Circ Physiol. 1998;275:H1963–1970. doi: 10.1152/ajpheart.1998.275.6.H1963. [DOI] [PubMed] [Google Scholar]
- Kuo HC, Cheng CF, Clark RB, Lin JJ, Lin JL, Hoshijima M, Nguyen-Tran VT, Gu Y, Ikeda Y, Chu PH, Ross J, Giles WR, Chien KR. A defect in the Kv channel-interacting protein 2 (KChIP2) gene leads to a complete loss of Ito and confers susceptibility to ventricular tachycardia. Cell. 2001;107:801–813. doi: 10.1016/s0092-8674(01)00588-8. [DOI] [PubMed] [Google Scholar]
- Lachance D, Plante E, Bouchard-Thomassin AA, Champetier S, Roussel E, Drolet MC, Arsenault M, Couet J. Moderate exercise training improves survival and ventricular remodeling in an animal model of left ventricular volume overload. Circ Heart Fail. 2009;2:437–445. doi: 10.1161/CIRCHEARTFAILURE.108.845487. [DOI] [PubMed] [Google Scholar]
- London B, Guo W, Pan X, Lee JS, Shusterman V, Rocco CJ, Logothetis DA, Nerbonne JM, Hill JA. Targeted replacement of Kv1.5 in the mouse leads to loss of the 4-aminopyridine-sensitive component of IK,slow and resistance to drug-induced QT prolongation. Circ Res. 2001;88:940–946. doi: 10.1161/hh0901.090929. [DOI] [PubMed] [Google Scholar]
- Marionneau C, Brunet S, Flagg TP, Pilgram TK, Demolombe S, Nerbonne JM. Distinct cellular and molecular mechanisms underlie functional remodeling of repolarizing K+ currents with left ventricular hypertrophy. Circ Res. 2008;102:1406–1415. doi: 10.1161/CIRCRESAHA.107.170050. [DOI] [PMC free article] [PubMed] [Google Scholar]
- Marionneau C, Couette B, Liu J, Li H, Mangoni ME, Nargeot J, Lei M, Escande D, Demolombe S. Specific pattern of ionic channel gene expression associated with pacemaker activity in the mouse heart. J Physiol. 2005;562:223–234. doi: 10.1113/jphysiol.2004.074047. [DOI] [PMC free article] [PubMed] [Google Scholar]
- Mayet J, Kanagaratnam P, Shahi M, Senior R, Doherty M, Poulter NR, Sever PS, Handler CE, Thom SA, Foale RA. QT dispersion in athletic left ventricular hypertrophy. Am Heart J. 1999;137:678–681. doi: 10.1016/s0002-8703(99)70222-x. [DOI] [PubMed] [Google Scholar]
- Mayet J, Shahi M, McGrath K, Poulter NR, Sever PS, Foale RA, Thom SA. Left ventricular hypertrophy and QT dispersion in hypertension. Hypertension. 1996;28:791–796. doi: 10.1161/01.hyp.28.5.791. [DOI] [PubMed] [Google Scholar]
- McIntyre H, Fry CH. Abnormal action potential conduction in isolated human hypertrophied left ventricular myocardium. J Cardiovasc Electrophysiol. 1997;8:887–894. doi: 10.1111/j.1540-8167.1997.tb00850.x. [DOI] [PubMed] [Google Scholar]
- McMullen JR, Amirahmadi F, Woodcock EA, Schinke-Braun M, Bouwman RD, Hewitt KA, Mollica JP, Zhang L, Zhang Y, Shioi T, Buerger A, Izumo S, Jay PY, Jennings GL. Protective effects of exercise and phosphoinositide 3-kinase(p110α) signaling in dilated and hypertrophic cardiomyopathy. Proc Natl Acad Sci U S A. 2007;104:612–617. doi: 10.1073/pnas.0606663104. [DOI] [PMC free article] [PubMed] [Google Scholar]
- McMullen JR, Jennings GL. Differences between pathological and physiological cardiac hypertrophy: novel therapeutic strategies to treat heart failure. Clin Exp Pharmacol Physiol. 2007;34:255–262. doi: 10.1111/j.1440-1681.2007.04585.x. [DOI] [PubMed] [Google Scholar]
- McMullen JR, Shioi T, Zhang L, Tarnavski O, Sherwood MC, Kang PM, Izumo S. Phosphoinositide 3-kinase(p110α) plays a critical role for the induction of physiological, but not pathological, cardiac hypertrophy. Proc Natl Acad Sci U S A. 2003;100:12355–12360. doi: 10.1073/pnas.1934654100. [DOI] [PMC free article] [PubMed] [Google Scholar]
- Medeiros A, Rolim NP, Oliveira RS, Rosa KT, Mattos KC, Casarini DE, Irigoyen MC, Krieger EM, Krieger JE, Negrao CE, Brum PC. Exercise training delays cardiac dysfunction and prevents calcium handling abnormalities in sympathetic hyperactivity-induced heart failure mice. J Appl Physiol. 2008;104:103–109. doi: 10.1152/japplphysiol.00493.2007. [DOI] [PubMed] [Google Scholar]
- Mitchell GF, Jeron A, Koren G. Measurement of heart rate and Q-T interval in the conscious mouse. Am J Physiol Heart Circ Physiol. 1998;274:H747–751. doi: 10.1152/ajpheart.1998.274.3.H747. [DOI] [PubMed] [Google Scholar]
- Nabauer M, Beuckelmann DJ, Uberfuhr P, Steinbeck G. Regional differences in current density and rate-dependent properties of the transient outward current in subepicardial and subendocardial myocytes of human left ventricle. Circulation. 1996;93:168–177. doi: 10.1161/01.cir.93.1.168. [DOI] [PubMed] [Google Scholar]
- O'Neill BT, Kim J, Wende AR, Theobald HA, Tuinei J, Buchanan J, Guo A, Zaha VG, Davis DK, Schell JC, Boudina S, Wayment B, Litwin SE, Shioi T, Izumo S, Birnbaum MJ, Abel ED. A conserved role for phosphatidylinositol 3-kinase but not Akt signaling in mitochondrial adaptations that accompany physiological cardiac hypertrophy. Cell Metab. 2007;6:294–306. doi: 10.1016/j.cmet.2007.09.001. [DOI] [PMC free article] [PubMed] [Google Scholar]
- Oikarinen L, Nieminen MS, Viitasalo M, Toivonen L, Jern S, Dahlof B, Devereux RB, Okin PM. QRS duration and QT interval predict mortality in hypertensive patients with left ventricular hypertrophy: the Losartan Intervention for Endpoint Reduction in Hypertension Study. Hypertension. 2004;43:1029–1034. doi: 10.1161/01.HYP.0000125230.46080.c6. [DOI] [PubMed] [Google Scholar]
- Priori SG, Pandit SV, Rivolta I, Berenfeld O, Ronchetti E, Dhamoon A, Napolitano C, Anumonwo J, di Barletta MR, Gudapakkam S, Bosi G, Stramba-Badiale M, Jalife J. A novel form of short QT syndrome (SQT3) is caused by a mutation in the KCNJ2 gene. Circ Res. 2005;96:800–807. doi: 10.1161/01.RES.0000162101.76263.8c. [DOI] [PubMed] [Google Scholar]
- Putzke C, Wemhoner K, Sachse FB, Rinne S, Schlichthorl G, Li XT, Jae L, Eckhardt I, Wischmeyer E, Wulf H, Preisig-Muller R, Daut J, Decher N. The acid-sensitive potassium channel TASK-1 in rat cardiac muscle. Cardiovasc Res. 2007;75:59–68. doi: 10.1016/j.cardiores.2007.02.025. [DOI] [PubMed] [Google Scholar]
- Sanguinetti MC, Curran ME, Zou A, Shen J, Spector PS, Atkinson DL, Keating MT. Coassembly of KVLQT1 and minK (IsK) proteins to form cardiac IKs potassium channel. Nature. 1996;384:80–83. doi: 10.1038/384080a0. [DOI] [PubMed] [Google Scholar]
- Sanguinetti MC, Jiang C, Curran ME, Keating MT. A mechanistic link between an inherited and an acquired cardiac arrhythmia: HERG encodes the IKr potassium channel. Cell. 1995;81:299–307. doi: 10.1016/0092-8674(95)90340-2. [DOI] [PubMed] [Google Scholar]
- Shioi T, Kang PM, Douglas PS, Hampe J, Yballe CM, Lawitts J, Cantley LC, Izumo S. The conserved phosphoinositide 3-kinase pathway determines heart size in mice. EMBO J. 2000;19:2537–2548. doi: 10.1093/emboj/19.11.2537. [DOI] [PMC free article] [PubMed] [Google Scholar]
- Wang Z, Feng J, Shi H, Pond A, Nerbonne JM, Nattel S. Potential molecular basis of different physiological properties of the transient outward K+ current in rabbit and human atrial myocytes. Circ Res. 1999;84:551–561. doi: 10.1161/01.res.84.5.551. [DOI] [PubMed] [Google Scholar]
- Xu H, Barry DM, Li H, Brunet S, Guo W, Nerbonne JM. Attenuation of the slow component of delayed rectification, action potential prolongation, and triggered activity in mice expressing a dominant-negative Kv2 α subunit. Circ Res. 1999a;85:623–633. doi: 10.1161/01.res.85.7.623. [DOI] [PubMed] [Google Scholar]
- Xu H, Guo W, Nerbonne JM. Four kinetically distinct depolarization-activated K+ currents in adult mouse ventricular myocytes. J Gen Physiol. 1999b;113:661–678. doi: 10.1085/jgp.113.5.661. [DOI] [PMC free article] [PubMed] [Google Scholar]
- Zaritsky JJ, Redell JB, Tempel BL, Schwarz TL. The consequences of disrupting cardiac inwardly rectifying K+ current (IK1) as revealed by the targeted deletion of the murine Kir2.1 and Kir2.2 genes. J Physiol. 2001;533:697–710. doi: 10.1111/j.1469-7793.2001.t01-1-00697.x. [DOI] [PMC free article] [PubMed] [Google Scholar]
Associated Data
This section collects any data citations, data availability statements, or supplementary materials included in this article.