Abstract
Objective
The purpose of this study was to compare Tanita tetrapolar foot-to-foot bioelectrical impedance analysis (Model TBF-310, Tanita Corporation of America, Inc, Arlington Heights, IL; Tanita-BIA) and fan beam dual-energy X-ray absorptiometry (Hologic Discovery A v12.6, Waltham, MA; DXA) in diabetic patients.
Methods
Seventy Hispanic diabetic participants (23 male, 47 female; mean age: 53.03 ± 10.32 yrs; mean weight: 81.45 ± 17.65 kg; and mean body mass index: 31.40 ± 6.80 kg/m2) were selected from the Loma Linda University En Balance culturally-sensitive Spanish diabetes education program using the baseline data.
Results
DXA vs Tanita-BIA fat mass (FM), percent fat mass (%FM), and fat-free mass (FFM) were compared using Pearson’s (FM: 0.96, %FM: 0.91, and FFM: 0.95), and Spearman’s rank (FM: 0.94, %FM: 0.91, and FFM: 0.93) correlation coefficients. Bland-Altman analyses were also used to compare the difference (DXA – BIA) vs average of DXA and BIA results and showed general agreement between the two methods. When Tanita-BIA was regressed onto DXA, the adjusted R2 was: FM=0.91; %FM=0.83; FFM=0.90. Gender combined concordance correlations with 95% confidence intervals were calculated using a bootstrap re-sampling of the data and found high associations [FM: 0.93 (95% CI: 0.89, 0.96)], [%FM: 0.86 (95% CI: 0.79, 0.90)], and [FFM: 0.93 (95% CI: 0.89, 0.96)].
Conclusion
Tanita-BIA may provide valid measures of fat, percent body fat and fat-free mass in Hispanic diabetics, and could be a convenient and practical approach for assessment in community-based research.
Keywords: Hispanic, diabetes, Tanita, BIA, DXA
Introduction
Comparisons of nutritional status between populations as they relate to health and well-being often rely on measures of body composition such as fat and lean mass and their distribution within the body. Two common methods of measuring body composition include bioelectrical impedance analysis (BIA) and dual-energy X-ray absorptiometry (DXA). BIA is a significantly more cost-effective method of measuring body composition than is DXA, computed topography (CT), or magnetic resonance imaging (MRI). It is also portable, and is easier to use than other technologies [1].
Comparisons of the two methods above have been made in several populations with varying results. According to Bolanowski and Nilsson [2], Salamone et al. [3], and Sun et al. [4] BIA and fan-beam DXA measurements were comparable in their accuracy of measuring fat mass; however, Sun et al. [4] reported discrepancies in percent body fat measurements among lean and obese participants whereby percent body fat was respectively over- and under-estimated. Neovius et al. [5] found this discrepancy to exist in eight-electrode BIA measurements when compared to fan-beam DXA, and concluded this discrepancy would increase with increasing adiposity. Newton et al.[6] compared several generalized BIA equations and found only two, the Lukaski [7] and Kushner [8] equations, would provide consistent estimates when compared with fan-beam DXA, while others would underestimate percent body fat as it increased among obese African-American women.
The Tanita tetrapolar foot-to-foot bioelectrical impedance analyzer (Model TGF-310, Tanita-BIA) is one method of BIA analysis that has yet to be tested in some populations. Jebb et al. [9] evaluated the agreement of Tanita-BIA to conventional tetrapolar impedance, skinfold-thickness tests, and body mass index (BMI)-based formulas among 104 male and 101 female subjects. Ritchie et al. [10] also tested the agreement of Tanita-BIA to a more traditional hand-to-foot BIA method among a cognitively impaired elderly population. Their findings both suggested that the Tanita-BIA system provided valid measures of percent body fat amongst older adults.
Different BIA and DXA methodologies have not been evaluated among all populations. Going et al. explored the importance of race/ethnicity as a covariate in body composition analysis by BIA among adolescent girls and concluded that race/ethnicity influences measurement results [11]. Though similar comparisons have been made in several populations [2, 6, 12–16], to our knowledge, no study has specifically compared these two methods within a Hispanic diabetic population. The purpose of this study is to validate the Tanita-BIA system (Model TBF-310, Tanita Corporation of America, Inc, Arlington Heights, IL) against fan beam DXA (Hologic Discovery A v12.6) in a population of Hispanic diabetics.
Methods
En Balance program
We used data from the En Balance health education program that was designed to assess changes in dietary intake, blood-glucose control, and body composition resulting from a comprehensive, culturally sensitive diabetes education program among Hispanic diabetics over a three-month course period. Details of the program design are explained in detail elsewhere [17]. This education program was administered to 73 type-II diabetic individuals living in the County of San Bernardino, California from 2006 through 2008. All participants were given written informed consent to participate in the study whose protocol was approved by the Institutional Review Board of Loma Linda University.
Body composition
Of the 73 participants, 70 had complete data on fan beam DXA (Hologic Discovery A v12.6) and Tanita-BIA (Model TBF-310, Tanita Corporation of America, Inc, Arlington Heights, IL) measurements available for comparison; one participant could not receive valid measurements because of a cast and two other participants were lost to follow up. The BIA equation for body fat percent (BF%) used by this model of Tanita was developed by Brožek [18, p.137]: BF% = (4.57/body density − 4.142) * 100. Each participant was asked to come to our clinic to receive DXA measurements. At their visit, trained professionals took DXA weight and DXA whole body composition measurements. Each whole body DXA scan was made over 3 minutes with a radiation exposure of 5 microsieverts. Furthermore, participants lay supine during their measurement and wore only hospital gowns and undergarments with any metal items removed. Participants also received Tanita-BIA measurements by trained graduate students. The mean, standard deviation and coefficient of variation % (respectively) for the impedance measurements were as follows: BIA fat mass % (32.3, 13.0, 40.0); BIA percent fat (38.4, 9.28, 24.2); BIA fat-free mass (49.5, 9.19, 18.6). Each measurement was taken twice and the values averaged for a final measurement value. The data were then entered separately by two data entry personnel and compared later for accuracy.
Statistical analysis
Univariate analyses were conducted on the demographic characteristics and the measures of body composition to assess normality and to test the assumptions of the parametric and nonparametric statistical tests. Taken into account were gender, age, weight in kilograms, height in centimeters, BMI, and fat mass in kilograms, percent fat mass, and fat-free mass as measured by both Tanita-BIA and DXA. Because males and females tend to differ by height, weight, BMI and body composition, some results are presented gender-specific.
Pearson’s product moment correlation, and concordance correlation coefficients were calculated to assess the comparability and agreement of the two methods of measuring body composition. We also evaluated the assumptions upon which the tests are based. To obtain asymmetric confidence intervals, bootstrap methods were used with the concordance correlation analysis. Bland-Altman plots were created to further test the agreement of the two methods.
All analyses were performed using SAS version 9.2 (SAS Institute Inc, Cary, North Carolina) and S-PLUS 8.04 for Windows (S-PLUS, Insightful Corp, Seattle, Wash). For all of the correlation and Bland-Altman analyses, the actual interval scale measurements were used for the analysis. To compare the individual demographic characteristics of interest, we computed the chi-square P-value to determine whether or not the specific distributions were significantly different on that characteristic.
Results
Demographic characteristics of the 70 participants at baseline of the study are summarized in Table 1 which shows the categorical distribution of the participant’s age, weight in kilograms, height in centimeters, and body mass index. The demographic characteristics are presented both categorically [17] as well as the traditional mean and SD in Table 1 to give the reader a better appreciation for the differences in gender-specific distributions which simple means and standard deviations by themselves do not provide. However, in order to avoid loss of power, all subsequent analyses were all done using the original interval scales. The mean and standard deviation for the 70 participants’ descriptive characteristics are as follow: age of 53.03 ± 10.32 years, weight of 81.45 ± 17.65 kg, height of 159.58 ± 8.25 cm, and BMI of 31.40 ± 6.80 kg/m2.
Table 1.
Study participant characteristics by gender.
| Variable | Females (n=47) | Males (n=23) | Combined (n=70) |
|---|---|---|---|
| Age (Years) | % | % | % |
| 25–34 | 4.17 | 0.00 | 2.74 |
| 35–44 | 14.58 | 16.00 | 15.07 |
| 45–54 | 41.67 | 44.00 | 42.47 |
| 55–64 | 25.00 | 16.00 | 21.92 |
| 65+ | 14.58 | 24.00 | 17.81 |
| Mean Age ± SD. | 52.94 ± 10.75 | 53.2 ± 9.67 | 53.03 ± 10.32 |
| Weight (kg) | % | % | % |
| 50–64 | 18.60 | 9.52 | 15.63 |
| 65–79 | 27.91 | 42.86 | 32.81 |
| 80–94 | 30.23 | 28.57 | 29.69 |
| 95–110 | 11.63 | 14.29 | 12.50 |
| 110+ | 11.63 | 4.76 | 9.38 |
| Mean Weight ± Sd | 81.14 ± 19.12 | 82.03 ± 14.86 | 81.45 ± 17.65 |
| Height (cm) * | % | % | % |
| 145–154 | 53.19 | 0.00 | 34.72 |
| 155–164 | 40.43 | 32.00 | 37.50 |
| 165–174 | 6.38 | 56.00 | 23.61 |
| 175+ | 0.00 | 12.00 | 4.17 |
| Mean Height ± SD | 155.29 ± 5.81 | 167.66 ± 5.70 | 159.58 ± 8.25 |
| BMI (kg/m2)# | % | % | % |
| 18.5–24.9 | 12.77 | 16.00 | 13.89 |
| 25.0–29.9 | 27.66 | 52.00 | 36.11 |
| 30.0–39.9 | 36.17 | 28.00 | 33.33 |
| 40.0+ | 23.40 | 4.00 | 16.67 |
| BMI ± SD | 32.89 ± 7.18 | 28.60 ± 5.06 | 31.40 ± 6.80 |
P < 0.05 based on chi-square
P < 0.10 based on chi-square
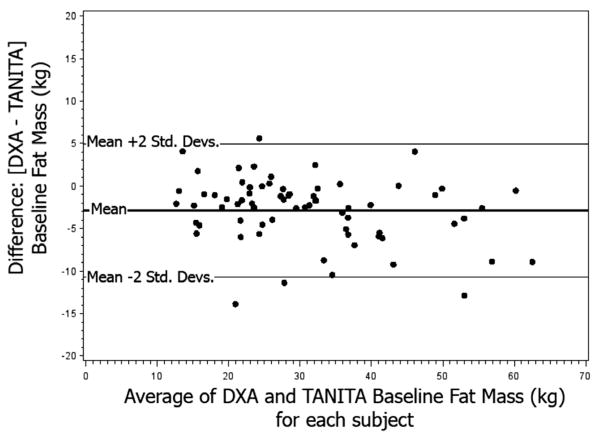
Pearson’s product moment correlations for DXA and Tanita-BIA are shown in Table 2. Significant Pearson correlations between the two methods in measuring fat mass in kg (FM), percent fat mass (%FM), and fat free mass in kg (FFM) were 0.96, 0.91, and 0.95 (P<0.01) respectively. To further test the agreement between the two methods, Bland-Altman plots were analyzed. Figure 1 shows an agreement for both DXA FM, and Tanita-BIA FM. Figure 2 shows agreement between DXA %FM and Tanita-BIA %FM and Figure 3 shows an agreement between DXA FFM and Tanita-BIA FFM. The differences between these two methods for the participants were generally within 2 standard deviations (Std. Dev.) of the mean difference; however, figure 3 shows that, as the average fat free mass increases, the variation in the difference between Tanita-BIA and DXA increases.
Table 2.
Pearson correlation coefficients between baseline DXA and Tanita-BIA measures of body composition by gender.
| Pearson’s product Moment correlation | Concordance with 95% Confidence interval | ||
|---|---|---|---|
| Females (n=47) | |||
| Fat mass | 0.97 | ** | 0.95 (0.91, 0.97) |
| Percent fat | 0.86 | ** | 0.75 (0.65, 0.86) |
| Fat-free mass | 0.95 | ** | 0.90 (0.85, 0.94) |
| Males (n=23) | |||
| Fat mass | 0.84 | ** | 0.78 (0.59, 0.93) |
| Percent fat | 0.69 | ** | 0.58 (0.36, 0.76) |
| Fat-free mass | 0.87 | ** | 0.85 (0.65, 092) |
| Combined (n=70) | |||
| Fat mass | 0.96 | ** | 0.93 (0.89, 0.96) |
| Percent fat | 0.91 | ** | 0.86 (0.79, 0.90) |
| Fat-free mass | 0.95 | ** | 0.93 (0.89, 0.96) |
P <0.01
Figure 1.
Bland-Altman plot of baseline fat mass.
Figure 2.
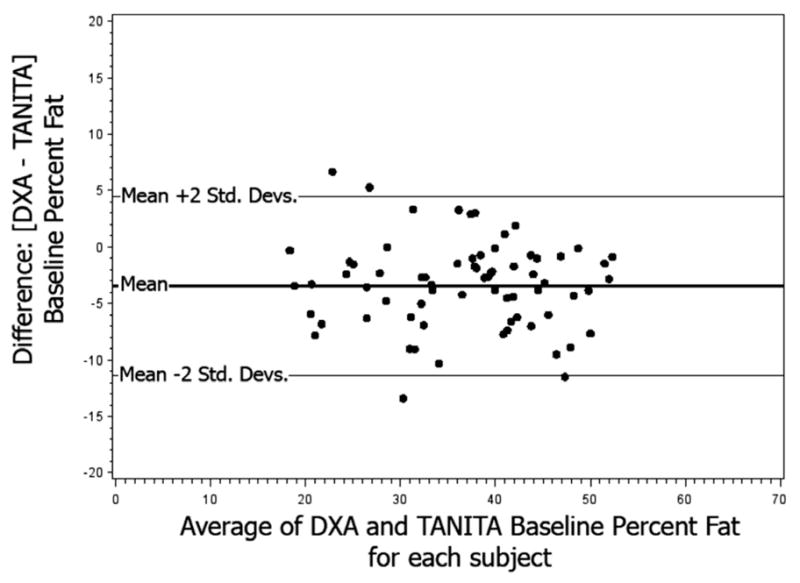
Bland-Altman plot of baseline percent fat.
Figure 3.
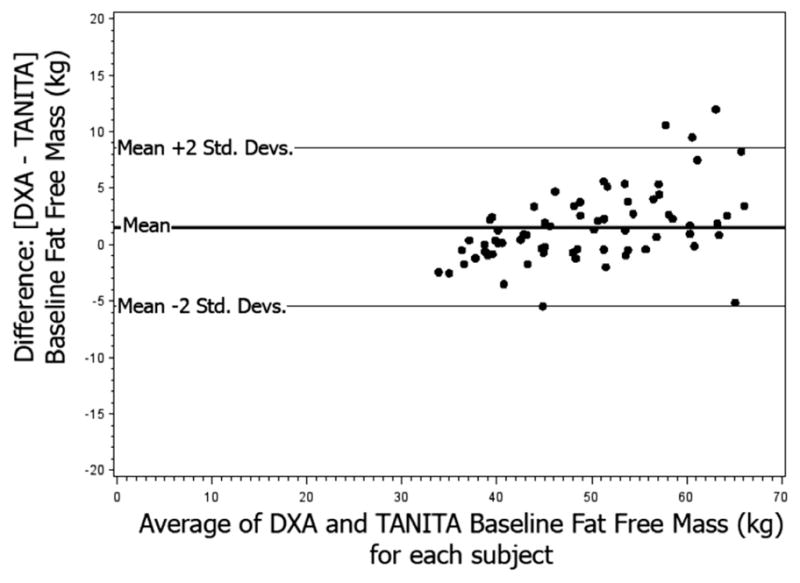
Bland-Altman plot of baseline fat free mass.
Due to the nature of this analysis, concordance correlation coefficients were determined to be the more objective measure of absolute agreement between DXA and Tanita-BIA. However, due to the moderate sample size of our study (n=70), asymmetric confidence intervals were produced using bootstrapping techniques. By sampling with replacement 10,000 times, the concordance correlation values were determined for FM [0.93 (95% CI: 0.89, 0.96)], %FM [0.86 (95% CI: 0.79, 0.90)], and FFM [0.93 (95% CI: 0.89, 0.96)]. The measure of accuracy for each of these estimates was 0.97, 0.94, and 0.98 respectively, suggesting that the concordance correlation estimates were very similar to the Pearson’s correlation values. Stratifying by gender lowered the concordance correlation estimates for all measures except fat mass amongst females, which slightly increased, FM: [0.95 (95% CI: 0.91, 0.97)].
In addition to the above analyses, scatter plots were created and fitted with regression lines that followed a general model of: DXA measurement = β0+ β1 (Tanita-BIA measurement). A further means of assessing the agreement of the two tests, the percentage of variance (Adj-R2) of the DXA measurement as explained by the Tanita-BIA measurement was examined to see how closely the two measures were similar. If Adj-R2 values approached 1.0 (100% of the variation explained), the two measures were nearly identical. Figure 4 displays this information for FM (Adj-R2 = 0.91), as does Figure 5 for %FM (Adj-R2 = 0.83), and Figure 6 for FFM (Adj-R2 = 0.90). As is demonstrated by the several different tests of agreement, the two methods were mostly similar in measuring body composition.
Figure 4.
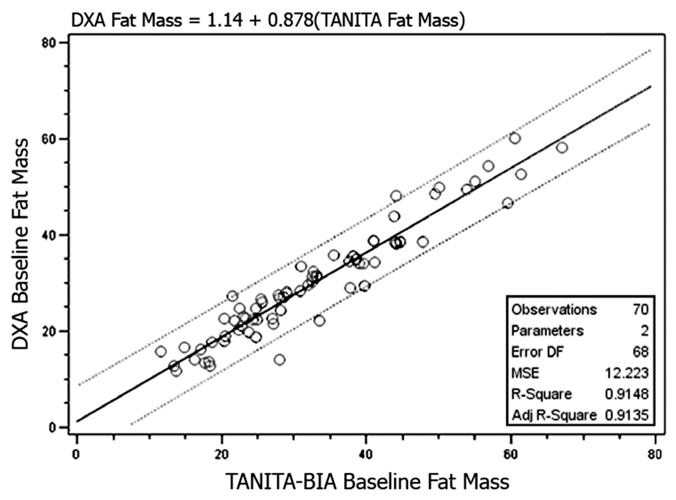
Regression analysis of baseline fat mass.
Dotted lines represent 95% confidence interval limits.
Figure 5.
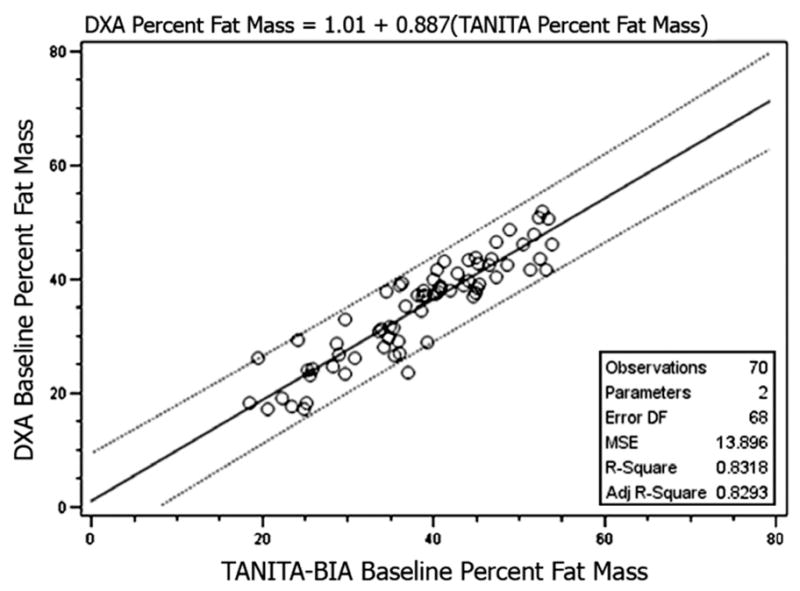
Regression analysis of baseline percent fat mass.
Dotted lines represent 95% confidence interval limits.
Figure 6.
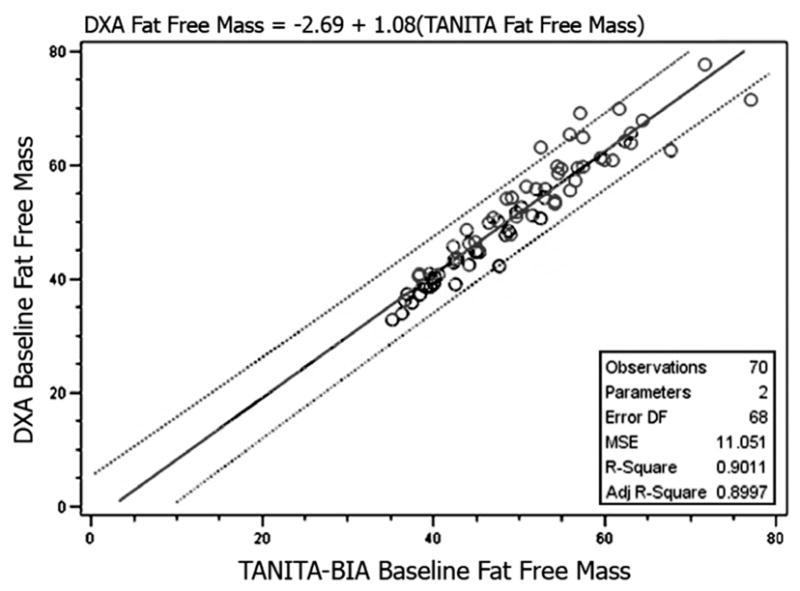
Regression analysis of baseline fat free mass.
Dotted lines represent 95% confidence interval limits.
Discussion
The Hispanic diabetic participants of the En Balance study composed a unique population upon which to compare two methods of assessing body composition: Tanita foot-to-foot bioelectrical impedance analysis (Model TBF-310, Tanita Corporation of America, Inc, Arlington Heights, IL) and fan beam dual-energy X-ray absorptiometry (Hologic Discovery A v12.6).
Significantly high correlation coefficients for the overall sample were observed for measures of fat mass, percent fat mass, and fat free mass using a variety of statistical methods. The high correlations observed are comparable to previous studies which show high correlations between DXA and BIA in overweight and obese populations [4, 19–21]. High correlation coefficients indicate good relative agreement between the two methods, but cannot distinguish the degree of coincidence among the models [22–23].
Differences in adiposity have generally been shown to bias the accuracy of estimates made by BIA compared to DXA [4]. Biases in FM, %FM and FFM were observed with differences in adiposity. In particular, our findings revealed that FM tended to be underestimated at low levels of adiposity and the variance between Tanita-BIA and DXA measurements tended to increase at these levels. This latter finding was also observed with FFM whereby Tanita-BIA and DXA diverged in their absolute level of agreement with increasing fat free mass. These findings are generally in accordance with other findings that show the agreement of Tanita-BIA and DXA to be fairly stable among overweight and obese groups with reductions in accuracy as fat mass increases [9, 19, 23]. The relative stability of the two methodologies in measuring FM, %FM and FFM among the overweight and obese combined with the high correlations observed in our analysis indicate that Tanita-BIA is a reliable method for assessing FM, %FM and FFM in community-based research of Hispanic diabetics.
In our bivariate plots of DXA versus BIA we observed that the least squares line summarizing the data had a slope slightly less than 1.0 for both FM (Figure 4) and %FM (Figure 5) indicating that BIA tended to slightly overestimate the respective body composition compared to DXA. This was not so for the bivariate plot of DXA versus BIA for FFM (Figure 6) where the slope of the least squares line was close to unity.
We observed that when the analysis was stratified by gender, that the correlations between DXA and BIA were higher in females compared to males for FM and %FM. This is consistent with what Bolanowski and Nilsson [2] observed. Their DXA:BIA correlations for FM were 0.98 for females and 0.89 for males. Similarly, their correlations for %FM were 0.92 for females and 0.80 for males. Sun et al. [4] also demonstrated a mean difference in %FM that was smaller (−1.77±4.00%) for females compared to a larger difference (−2.16±4.56%) for males. Their correlation between DXA and BIA for %FM was 0.85 for females and 0.78 for males. However, Sun et al. [4] cautioned that BIA tends to overestimate %FM in lean subjects whereas BIA tends to underestimate %FM in overweight or obese subjects.
A strength of this study includes the comparison of BIA to DXA among both men and women in a specifically defined population of Hispanic diabetics. Gender differences were not seen for measures of %FM and FFM, and a small albeit non-significant improvement in measuring FM was observed for females. More studies comparing men and women in other specifically defined populations may help to illuminate the potential differences in validity of BIA to DXA that may exist between men and women. Furthermore, the assessment of a specific population of Hispanic diabetics demands that these findings not be generalized to other populations. Replicating this study in other specifically defined populations may help provide greater validity in other populations.
The use of DXA as a method of assessing body composition has gained widespread acceptance in the clinical setting because it is less expensive, less demanding on participants, and is more convenient to administer than the typical reference method of hydrodensitometry [24–29]. Other studies comparing BIA to DXA have also used DXA body composition measures as the reference measure [4, 20, 30] despite the existence of more accurate measurement systems, such as hydrodensitometry. For example, a study by Johansson et al. [31] reported that FM measures by DXA were consistently lower than with hydrodensitometry, skin-fold measures and even BIA. Schoeller et al. also found that DXA underestimated fat mass compared to other criterion methods in a cohort study of 1,195 adults [32].
In conclusion, Tanita-BIA provided good agreement with DXA for measures of fat mass, percent fat mass and fat-free mass. Some concerns exist in our findings for fat-free mass and further research may help to fully reveal the agreement between methods in this measure of body composition. Overall, these findings indicate that Tanita-BIA may be useful for community-based research on measures of body composition in a Hispanic population.
Acknowledgments
The data collection for this study was supported by grants 03-00335 from Centers for Medicare and Medicaid Services and 5P20MD001632 from the National Institutes of Health.
References
- 1.Heitmann BL. Impedance: a valid method in assessment of body composition? Eur J Clin Nutr. 1994;48:228–40. [PubMed] [Google Scholar]
- 2.Bolanowski M, Nilsson BE. Assessment of human body composition using dual-energy x-ray absorptiometry and bioelectrical impedance analysis. Med Sci Monit. 2001;7:1029–33. [PubMed] [Google Scholar]
- 3.Salamone LM, et al. Measurement of fat mass using DEXA: a validation study in elderly adults. J Appl Physiol. 2000;89:345–52. doi: 10.1152/jappl.2000.89.1.345. [DOI] [PubMed] [Google Scholar]
- 4.Sun G, et al. Comparison of multifrequency bioelectrical impedance analysis with dual-energy X-ray absorptiometry for assessment of percentage body fat in a large, healthy population. Am J Clin Nutr. 2005;81:74–8. doi: 10.1093/ajcn/81.1.74. [DOI] [PubMed] [Google Scholar]
- 5.Neovius M, et al. Bioelectrical impedance underestimates total and truncal fatness in abdominally obese women. Obesity. 2006;14:1731–8. doi: 10.1038/oby.2006.199. [DOI] [PubMed] [Google Scholar]
- 6.Newton RL, Jr, et al. Comparison of body composition methods in obese African-American women. Obesity. 2006;14:415–22. doi: 10.1038/oby.2006.55. [DOI] [PubMed] [Google Scholar]
- 7.Lukaski HC, et al. Validation of tetrapolar bioelectrical impedance method to assess human body composition. J Appl Physiol. 1986;60:1327–32. doi: 10.1152/jappl.1986.60.4.1327. [DOI] [PubMed] [Google Scholar]
- 8.Kushner RF, et al. Is the impedance index (ht2/R) significant in predicting total body water? Am J Clin Nutr. 1992;56:835–9. doi: 10.1093/ajcn/56.5.835. [DOI] [PubMed] [Google Scholar]
- 9.Jebb SA, et al. Evaluation of the novel Tanita body-fat analyser to measure body composition by comparison with a four-compartment model. Br J Nutr. 2000;83:115–22. doi: 10.1017/s0007114500000155. [DOI] [PubMed] [Google Scholar]
- 10.Ritchie JD, Miller CK, Smiciklas-Wright H. Tanita foot-to-foot bioelectrical impedance analysis system validated in older adults. J Am Diet Assoc. 2005;105:1617–9. doi: 10.1016/j.jada.2005.07.011. [DOI] [PubMed] [Google Scholar]
- 11.Going S, et al. Validation of bioelectrical impedance analysis (BIA) for estimation of body composition in Black, White and Hispanic adolescent girls. Int J Body Comp Res. 2006;4:161–167. [PMC free article] [PubMed] [Google Scholar]
- 12.Baumgartner RN. Body composition in elderly persons: a critical review of needs and methods. Prog Food Nutr Sci. 1993;17:223–60. [PubMed] [Google Scholar]
- 13.Bracco D, et al. Segmental body composition assessed by bioelectrical impedance analysis and DEXA in humans. J Appl Physiol. 1996;81:2580–7. doi: 10.1152/jappl.1996.81.6.2580. [DOI] [PubMed] [Google Scholar]
- 14.Cordero-MacIntyre ZR, et al. Reproducibility of DXA in obese women. J Clin Densitom. 2002;5:35–44. doi: 10.1385/jcd:5:1:035. [DOI] [PubMed] [Google Scholar]
- 15.Eisenkolbl J, Kartasurya M, Widhalm K. Underestimation of percentage fat mass measured by bioelectrical impedance analysis compared to dual energy X-ray absorptiometry method in obese children. Eur J Clin Nutr. 2001;55:423–9. doi: 10.1038/sj.ejcn.1601184. [DOI] [PubMed] [Google Scholar]
- 16.Jakicic JM, Wing RR, Lang W. Bioelectrical impedance analysis to assess body composition in obese adult women: the effect of ethnicity. Int J Obes Relat Metab Disord. 1998;22:243–9. doi: 10.1038/sj.ijo.0800576. [DOI] [PubMed] [Google Scholar]
- 17.Metghalchi S, et al. Improved clinical outcomes using a culturally sensitive diabetes education program in a Hispanic population. Diabetes Educ. 2008;34:698–706. doi: 10.1177/0145721708320913. [DOI] [PMC free article] [PubMed] [Google Scholar]
- 18.Brozek J, et al. Densitometric Analysis of Body Composition: Revision of Some Quantitative Assumptions. Ann N Y Acad Sci. 1963;110:113–40. doi: 10.1111/j.1749-6632.1963.tb17079.x. [DOI] [PubMed] [Google Scholar]
- 19.Andreoli A, et al. Bioelectrical impedance measures in different position and vs dual-energy X-ray absorptiometry (DXA) J Sports Med Phys Fitness. 2002;42:186–9. [PubMed] [Google Scholar]
- 20.Frisard MI, Greenway FL, Delany JP. Comparison of methods to assess body composition changes during a period of weight loss. Obes Res. 2005;13:845–54. doi: 10.1038/oby.2005.97. [DOI] [PubMed] [Google Scholar]
- 21.Kyle UG, et al. Bioelectrical impedance analysis-part II: utilization in clinical practice. Clin Nutr. 2004;23:1430–53. doi: 10.1016/j.clnu.2004.09.012. [DOI] [PubMed] [Google Scholar]
- 22.Bland JM, Altman DG. Statistical methods for assessing agreement between two methods of clinical measurement. Lancet. 1986;1(8476):307–10. [PubMed] [Google Scholar]
- 23.Pateyjohns IR, et al. Comparison of three bioelectrical impedance methods with DXA in overweight and obese men. Obesity. 2006;14:2064–70. doi: 10.1038/oby.2006.241. [DOI] [PubMed] [Google Scholar]
- 24.Jensen MD, et al. Assessment of body composition with use of dual-energy x-ray absorptiometry: evaluation and comparison with other methods. Mayo Clin Proc. 1993;68:867–73. doi: 10.1016/s0025-6196(12)60695-8. [DOI] [PubMed] [Google Scholar]
- 25.Kohrt WM. Preliminary evidence that DEXA provides an accurate assessment of body composition. J Appl Physiol. 1998;84:372–7. doi: 10.1152/jappl.1998.84.1.372. [DOI] [PubMed] [Google Scholar]
- 26.Mazess RB, et al. Dual-energy x-ray absorptiometry for total-body and regional bone-mineral and soft-tissue composition. Am J Clin Nutr. 1990;51:1106–12. doi: 10.1093/ajcn/51.6.1106. [DOI] [PubMed] [Google Scholar]
- 27.Pritchard JE, et al. Evaluation of dual energy X-ray absorptiometry as a method of measurement of body fat. Eur J Clin Nutr. 1993;47:216–28. [PubMed] [Google Scholar]
- 28.Wellens R, et al. Body composition in white adults by dual-energy x-ray absorptiometry, densitometry, and total body water. Am J Clin Nutr. 1994;59:547–55. doi: 10.1093/ajcn/59.3.547. [DOI] [PubMed] [Google Scholar]
- 29.Withers RT, et al. A comparison of four methods of estimating the body composition of male endurance athletes. Eur J Clin Nutr. 1992;46:773–84. [PubMed] [Google Scholar]
- 30.Fakhrawi DH, et al. Comparison of body composition by bioelectrical impedance and dual-energy x-ray absorptiometry in overweight/obese postmenopausal women. J Clin Densitom. 2009;12:238–44. doi: 10.1016/j.jocd.2009.01.004. [DOI] [PubMed] [Google Scholar]
- 31.Johansson AG, et al. Determination of body composition – a comparison of dual-energy x-ray absorptiometry and hydrodensitometry. Am J Clin Nutr. 1993;57:323–6. doi: 10.1093/ajcn/57.3.323. [DOI] [PubMed] [Google Scholar]
- 32.Schoeller DA, et al. QDR 4500A dual-energy X-ray absorptiometer underestimates fat mass in comparison with criterion methods in adults. Am J Clin Nutr. 2005;81:1018–25. doi: 10.1093/ajcn/81.5.1018. [DOI] [PubMed] [Google Scholar]


