

Abstract
Objective
To assess the effects of a language-sensitive diabetes education program on dietary changes and plasma lipid profiles.
Method
Hispanic participants (n=13 males and 18 females, mean age = 54.00 + 10.68 years) participated in a 3-month health education study. Spearman correlation coefficients were used to evaluate correlations between dietary intake and laboratory measurements.
Results
There were significant decreases in serum total cholesterol (−16.07 mg/dl, P= 0.035), HDL cholesterol (−3.23 mg/dl, P = 0.01), LDL cholesterol (−11.71 mg/dl, P = 0.013) and dietary cholesterol (−79.22 mg, P = 0.03). No significant mean change was observed in triglyceride and total cholesterol/HDL ratio. There was also a reduction in body mass index (BMI) (−0.15 kg/m2, P = 0.40), fasting glucose (−3.90 mg/dl, P = 0.43) and dual energy X-ray absorptiometry (DXA) total fat (−0.50, P = 0.97). Although not statistically significant, saturated fatty acids (−4.90 g, P = 0.19), polyunsaturated fatty acids (−3.31g, P = 0.11), and carbohydrate (−44.82 g, P = 0.22), decreased after three months.
Conclusion
There were significant improvements in dietary intake and serum lipids after a three-month culture-specific diabetes education program.
Keywords: diabetes education, Hispanics, language-sensitive, lipids, body composition
Introduction
Since the mid 20th century, diabetes prevalence has continually increased in the United States[1]. Diabetes, the seventh leading cause of death in the United States, also increases the risk of health complications from other diseases [2]. Considering its economic burden in 2007, diabetes accounted for $174 billion including $27 billion in diabetes care, $58 billion in chronic diabetes-related complications, $31 billion in other medical costs, and $58 billion in indirect costs [3].
Diabetes management is an equivocal task in most populations. More importantly, it is particularly burdensome in the Hispanic population. Hispanics, the fastest growing and largest minority group in the United States, comprise 15% of the total population of the United States [4]. The life-time risk of developing diabetes is highest in Hispanics compared to non-Hispanic Blacks and non-Hispanic Whites [5]. Significant disparities in diabetes prevalence, access to healthcare services and treatment outcomes have been documented in health studies of Hispanic populations [6].
In addition to its economic and medical implications, the increasing trend in diabetes prevalence and healthcare disparities in Hispanics calls to attention the requirement of language and culturally suitable community health workers in the provision of low-cost healthcare services, including diabetes education. Studies have reported improved health outcomes in diabetic patients following diabetes education programs, including significant improvement in BMI and weight among Mexican Americans [7] and serum lipids among Hispanics and African-Americans [8]. Additional studies have also demonstrated the importance of a language and culture-sensitive education in the improvement of diabetic-related chronic conditions [9], Hemoglobin A1c and lipid profile [10, 11].
The effectiveness of diabetes education programs in the improvement of dietary behaviors has also been documented. According to a meta-analysis of several intervention studies, 10 out of 14 programs reported significant reductions in dietary fat intake and 7 out of 10 programs reported significant reductions in saturated fat intake [12]. Another intervention program by Sargrad et al. (2005), reported significant reductions in dietary cholesterol, monounsaturated fat, polyunsaturated fat, and saturated fat [13].
Very few studies, however, have evaluated possible associations between improvements in dietary behaviors and lipid profile following a diabetes education program. The purpose of this study was to evaluate the association between changes in dietary habits and subsequent changes in lipid profile parameters after a culture-specific diabetes education program in Hispanics with diabetes.
Methods
Thirty-nine Hispanic participants (16 males and 23 females) with average BMI of 31.67 kg/m2, participated in this pilot study. All thirty-nine participants, whose primary language was Spanish, were non-randomly recruited from surrounding San Bernardino and Riverside counties in Southern California via Spanish radio stations and newspaper announcements; flyers were also distributed around markets and ambulatory care clinics within the Hispanic community. Physical activity, medical and diet histories of participants were obtained via personal and telephone interviews. This diabetes education program was conducted in two phases. Twenty-six participants were recruited in the first phase and thirteen participants in the second phase. All study participants gave informed consent and the study protocol was approved by the Loma Linda University Institutional Review Board.
Exclusion and inclusion criteria
Study participants were excluded if they had any of the following conditions: a history of alcohol or drug abuse; were pregnant or lactating; had an impaired mental state; were on steroid therapy; had any neurologic, endocrine, hepatic or other systemic diseases; had a pacemaker; or had a history of heart disease.
Statistical analyses
Statistical analyses were conducted using the Statistical Analysis System (SAS) software version 9.1.3. Non-normal data were log-transformed and means and standard deviations of outcome measures were calculated. Paired t-tests were used to analyze changes between baseline and three-month variables; non-parametric tests (signed rank) were also conducted. Pearson’s correlation was used to evaluate the bivariate relationship between serum lipids and dietary intake variables. Following sensitivity analyses, eight of the thirty-nine participants were excluded due to systematic errors in food frequency data entry.
Sample size
A predicted reduction of 13% in serum fasting blood glucose (FBS) was used to estimate sample size calculations. Forty-four participants were required to detect a 13% reduction in serum FBS with 80% power and alpha error of 5%. However, with an analysis involving 31 participants, the power was reduced to 75% to detect a 13% reduction in serum FBS.
Diabetes education
Study participants, who met inclusion criteria, attended diabetes education classes at the Loma Linda University School of Public Health, Loma Linda, California. Classes were offered weekly for a period of three months. We employed the expertise of Hispanic physicians, registered dieticians, and nutrition students whose primary language was Spanish. Study participants received free glucose monitors to self-monitor their glucose levels. Hispanic health professionals taught a variety of topics that emphasized diabetes management and glycemic control. Topics covered during the hands on EnBalance program include: what is diabetes?, blood glucose control, complications of diabetes, hyperglycemia, hypoglycemia, how to use the glucose monitor, taking care of your feet, the role of nutrition in diabetes care, what to do when you get sick, how to choose healthier foods, nutrition labeling, principles of exercise and weight control, food portions control, and food pyramid. We conducted monthly follow-up sessions among participants and application of education principles was reinforced by providing participants with logs to monitor their blood glucose levels daily.
Outcome measures
Glucose, insulin, and hemoglobin A1c
We determined serum glucose of participants by reaction of patient serum with glucose oxidase, converting glucose to gluconolactone [14]. We measured serum insulin using radioimmunoassay methods (Quest Diagnostics, Teterboro, New Jersey, and Nichols Institute Diagnostics, California). We measured patient Hemoglobin A1c levels via a measure of percent glycated hemoglobin using a boronate affinity binding assay [14].
Dietary intake
Participants completed the validated [15] Southwestern Food Frequency questionnaire at baseline and at three months. Dietary intake records were analyzed using the Metabolize Nutrient Analysis System, Version 2.5, at the University of Arizona, Arizona Cancer Center, Tucson, Arizona.
Body composition
Body composition measurements were obtained using the Fan Beam DXA Discovery A, software V 12.6. Waltham, MA. Total and regional body composition measurements were obtained with participant in the supine position. For each assessment, scan time was about 3 minutes at a radiation exposure of 1.5 mrem. These scans were read and signed by a qualified radiologist at baseline and three months. Assessments were conducted according to standard procedures [16].
Serum lipids
Serum cholesterol and triglyceride values were analyzed using the Beckman CX7 (Beckman Coulter, Fullerton, California) instrument. Serum high-density lipoprotein (HDL) cholesterol and low-density lipoprotein (LDL) cholesterol were analyzed using the Beckman CX4CE instrument. Each measurement was obtained according to standard procedures [17]. Serum lipid measurements were done at the Loma Linda University Medical Center clinical laboratory, California.
Results
Demographics and baseline descriptive characteristics of the participants (n=31) are shown in Table 1 and 2, respectively. The average age of study participants for both genders was 54 years, ranging from 29 to 75 years. There were 13 males and 18 females. Mean weight for both genders was 81.62 kg, (range: 55.5 to 124.8 kg), and mean BMI was 31.67 kg/m2, (range: 22.0 to 44.7 kg/m2). Approximately 86.6% of study participants had a BMI over 25 kg/m2.
Table 1.
Demographics of study participants.
| Variable | n | Percent (%) |
|---|---|---|
| Sex | ||
| male | 13 | 41.9 |
| female | 18 | 58.1 |
| Primary language | ||
| Spanish | 28 | 90.3 |
| English | 3 | 9.7 |
| Country of birth | ||
| USA | 2 | 6.5 |
| Mexico | 27 | 87.1 |
| Puerto Rico | 1 | 3.2 |
| Dominican Republic | 1 | 3.2 |
| Education level | ||
| no formal education | 2 | 6.5 |
| some primary/finished primary | 12 | 38.7 |
| some junior high/finished junior high | 3 | 9.7 |
| some high school/finished high school | 7 | 22.6 |
| some college/finished college | 5 | 16.1 |
| some master’s/finished master’s | 1 | 3.2 |
| missing data | 1 | 3.2 |
Table 2.
Baseline characteristics of study participants.
| Variable | Total (%) | Males (%) | Females (%) | P - value |
|---|---|---|---|---|
| Age (years) | ||||
| 4 | 3.23 | 0.00 | 3.23 | 0.41 |
| 35 – 44 | 6.45 | 6.46 | 0.00 | |
| 45 –54 | 51.61 | 19.35 | 32.26 | |
| 55 –64 | 19.35 | 6.45 | 12.90 | |
| >64 | 19.35 | 9.68 | 9.68 | |
| Mean age ± SD | 53.95 ± 11.21 | 52.62 ± 9.91 | 54.87 ± 12.16 | |
| Weight (kg) | ||||
| 50.0 – 64.5 | 16.67 | 6.67 | 10.00 | 0.41 |
| 64.6 – 80.5 | 33.33 | 20.00 | 13.33 | |
| 80.6 – 94.5 | 30.00 | 13.33 | 16.67 | |
| >94.5 | 20.00 | 3.33 | 16.67 | |
| Mean Weight ± SD | 81.62 ± 17.66 | 78.26 ± 12.52 | 84.08 ± 20.56 | |
| Height (cm) | ||||
| 145.0 – 154.5 | 26.67 | 0.00 | 26.67 | 0.00007** |
| 154.6 – 164.5 | 30.00 | 6.67 | 23.33 | |
| 164.6 – 174.5 | 33.33 | 26.67 | 6.76 | |
| >174.6 | 10.00 | 10.08 | 0.00 | |
| Mean Height ± SD | 160.7 ± 8.92 | 168.0 ± 6.53 | 155.3 ± 6.23 | |
| BMI (kg/m2) | ||||
| < 18.5 | 0 | 0.00 | 0.00 | 0.031* |
| 18.5 – 24.9 | 16.67 | 13.33 | 3.33 | |
| 25.0 – 29.9 | 33.33 | 20.00 | 13.33 | |
| 30.0 – 39.9 | 30.00 | 10.00 | 20.00 | |
| >40.0 | 20.00 | 0.00 | 20.00 | |
| Mean BMI ± SD | 31.67 ± 6.73 | 27.64 ± 3.39 | 34.61 ± 6.91 | |
SD = Standard deviation;
P ≤1; P ≤ 0.05
Table 3 summarizes the baseline, three-month, and changes in plasma lipid parameters, Hemoglobin A1c, and fasting glucose. There was a significant decrease in serum total cholesterol (−16.07 mg/dl, P = 0.035), LDL cholesterol (−11.71 mg/dl, P = 0.013), and HDL Cholesterol (−3.23 mg/dl, P = 0.01). No significant mean change was observed in triglyceride and total cholesterol/HDL ratio. There was a significant reduction in hemoglobin A1c (−0.55 %, P = 0.019), and a reduction in fasting glucose (−3.9 mg/dl, P = 0.43).
Table 3.
Changes in serum lipids, hemoglobin A1c, and fasting glucose after a three-month Spanish diabetes education program, both genders.
| Variable | Baseline | Three months | Difference | P-value |
|---|---|---|---|---|
| Serum total cholesterol (mgdl) | 191.29 ± 32.27 | 175.22 ± 36.42 | −16.07 | 0.035* |
| LDL cholesterol (mg/dl) | 120.10 ± 31.45 | 108.38 ± 31.50 | −11.72 | 0.013* |
| HDL cholesterol (mg/dl) | 50.10 ± 10.71 | 46.87 ± 10.46 | −3.23 | 0.01* |
| Triglycerides (mg/dl) | 169.06 ± 89.51 | 169.10 ± 89.50 | 0.04 | 0.74 |
| Cholesterol/HDL ratio | 3.97 ± 1.06 | 3.89 ± 1.02 | −0.08 | 0.36 |
| Hemoglobin A1c (%) | 8.28 ± 2.31 | 7.71 ± 1.85 | −0.57 | 0.10 |
| Fasting glucose (mg/dl) | 164.00 ± 81.12 | 160.00 ± 75.77 | −4.00 | 0.095 |
P ≤ 0.05
Table 4 shows differences in baseline and three-month anthropometric and body composition values. There was a reduction in BMI (−0.15 kg/m2, P = 0.40), DXA trunk percent fat (−0.61 %, P = 0.63), DXA total fat (−0.26, P = 0.06); a significant reduction in DXA total percent fat (−0.47 %, P = 0.007), DXA trunk fat (−0.32 %, P = 0.03), waist circumference (−2.04 cm, P = 0.02), and hip circumference (−1.67 cm, P = 0.02).
Table 4.
Change in BMI and body composition after a three-month Spanish diabetes education program, both genders.
| Variable | Baseline | Three months | Difference | P-value |
|---|---|---|---|---|
| Weight (kg) | 83.72 ± 18.91 | 83.31 ± 18.11 | −0.41 | 0.730 |
| Height (cm) | 160.7 ± 8.92 | 160.7 ± 8.92 | 0.00 | 0.870 |
| BMI (kg/m2) | 31.95 ± 7.27 | 31.80 ± 7.21 | −0.15 | 0.400# |
| DXA trunk percent fat (%) | 33.79 ± 10.61 | 33.18 ± 10.62 | −0.61 | 0.030*a |
| DXA total percent fat (%) | 33.35 ± 10.69 | 32.88 ± 10.81 | −0.47 | 0.007*a |
| DXA trunk fat (kg) | 14.90 ± 7.07 | 14.57 ± 7.05 | −0.32 | 0.03*a |
| DXA total fat (kg) | 29.05 ± 13.94 | 28.55 ± 13.91 | −0.59 | 0.97a |
| Waist circumference (cm) | 101.35 ± 12.66 | 99.31 ± 13.76 | −2.04 | 0.020a |
| Hip circumference (cm) | 108.64 ± 14.82 | 107.56 ± 14.23 | −1.08 | 0.020*a |
| Waist/hip circumference ratio | 0.92 ± 0.06 | 0.091 ± 0.05 | −0.0006 | 0.710a |
P ≤ 0.05;
Signed Rank test, otherwise, paired t-test.
Table 5 summarizes the changes in dietary intake among all participants after a three-month diabetes education program. A significant reduction in dietary cholesterol (−79.22 mg, P = 0.03), was observed. Although not statistically significant, total lipid fat (−16.21g, P = 0.25), saturated fatty acids (−4.91g, P = 0.19), monounsaturated fatty acids (−6.41g, P = 0.14), polyunsaturated fatty acids (−3.32 g, P = 0.11), and carbohydrate by difference (−44.82 kg, P = 0.22), decreased after three months.
Table 5.
Changes in dietary intake, both genders.
| Variable | Baseline | Three months | Difference | P-valuea |
|---|---|---|---|---|
| Carbohydrate (%) | 53.39 ± 7.94 | 54.1 ± 8.13 | 0.71 | 0.23 |
| MUFA (%) | 12.13 ± 2.81 | 11.91 ± 1.82 | −0.22 | 0.14 |
| Protein (%) | 17.31 ± 2.89 | 17.60 ± 3.27 | 0.29 | 0.56 |
| PUFA (%) | 6.33 ± 1.28 | 5.74 ± 1.06 | −0.59 | 0.11 |
| Total fat (%) | 31.48 ± 5.72 | 30.90 ± 4.46 | −0.58 | 0.97 |
| Saturated fatty acids (%) | 10.00 ± 2.35 | 10.10 ± 2.09 | 0.10 | 0.74 |
| Total lipid fat (g) | 87.27 ± 44.42 | 71.07 ± 26.47 | −16.20 | 0.12 |
| Saturated fatty acids(g) | 28.00 ± 15.45 | 23.10 ± 9.13 | −4.90 | 0.19 |
| MUFA (g) | 33.80 ± 17.90 | 27.38 ± 10.26 | −6.42 | 0.14 |
| PUFA (g) | 17.27 ± 8.26 | 13.96 ± 5.88 | −3.31 | 0.11 |
| Carbohydrate, by difference (g) | 331.11 ± 160.42 | 286.29 ± 119.66 | −44.82 | 0.22 |
| Dietary cholesterol (mg) | 338.64 ± 217.50 | 259.42 ± 163.22 | −79.22 | 0.03* |
| Protein (g) | 105.38 ± 45.75 | 89.32 ± 30.60 | −16.06 | 0.15 |
| Supp. chromium (μg) | 2.42 ± 6.35 | 2.50 ± 6.47 | 0.08 | 0.84 |
| Energy (kcal) | 2478.89 ± 1140.4 | 2084.97 ± 741.49 | −393.9 | 0.21 |
| Energy (kJ) | 9725.78 ± 4574.97 | 8270.94 ± 3015.56 | −1454.84 | 0.27 |
P ≤ 0.05;
Signed rank; PUFA = polyunsaturated fatty acids; MUFA = monounsaturated fatty acids.
Table 6 shows Pearson’s correlations after a three-month diabetes education program. A reduction in BMI was significantly associated with a reduction in trunk percent fat (r=0.464, P =0.0098) and trunk fat (r=0.755, P =<0.0001). Decrease in serum fasting glucose was significantly associated with decrease in waist circumference (r=0.451, P =0.01).
Table 6.
Pearson’s correlations (P-values), both genders.
| Variable | Δ Trunk Percent fat | Δ Trunk fat | Δ BMI | Δ Glucose | Δ Waist circumference |
|---|---|---|---|---|---|
| Δ Trunk % fat | 1.000 | 0.788 (<0.0001)** | 0.464 (0.0098)** | 0.036 (0.84) | 0.064 (0.73) |
| Δ Trunk fat | 1.000 | 0.755 (<0.0001)** | 0.079 (0.67) | 0.030 (0.871) | |
| Δ BMI | 1.000 | 0.036 (0.84) | −0.077 (0.68) | ||
| Δ Glucose | 1.000 | 0.451 (0.01)* | |||
| Δ Waist Circumference | 1.000 |
Δ = 3 months - Baseline;
P ≤ 0.001;
P ≤ 0.01
Figure 1 shows changes in glucose and serum lipids for both genders after a three-month diabetes education program. Figures 2, 3 and 4 show changes in dietary intake for both genders after a three-month diabetes education program.
Figure 1.
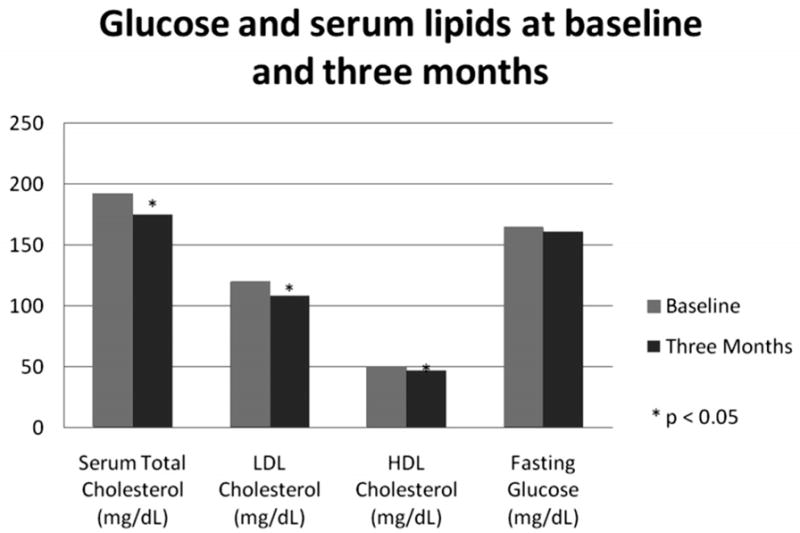
Change in glucose and serum lipids after a three-month Spanish diabetes education program, both genders.
Figure 2.
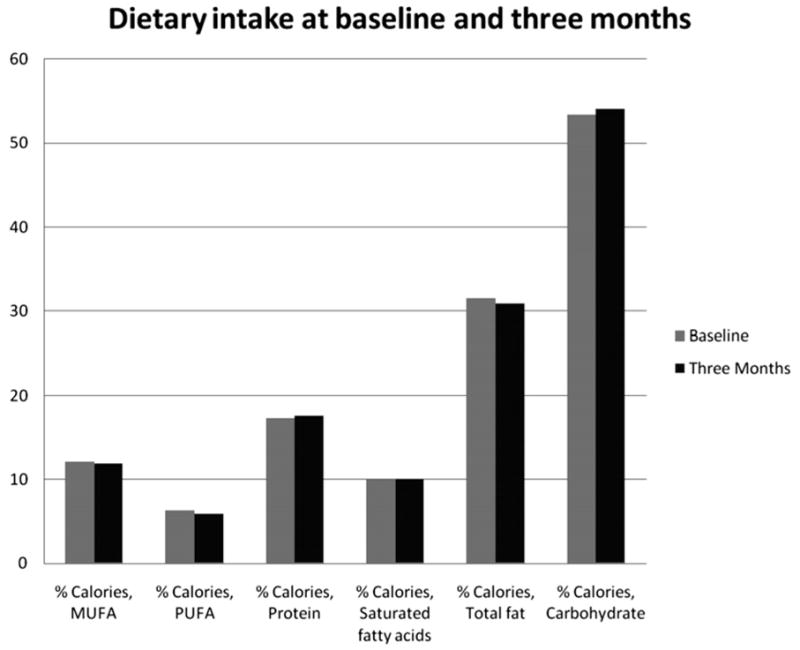
Change in dietary intake after a three-month Spanish diabetes education program, both genders.
Figure 3.
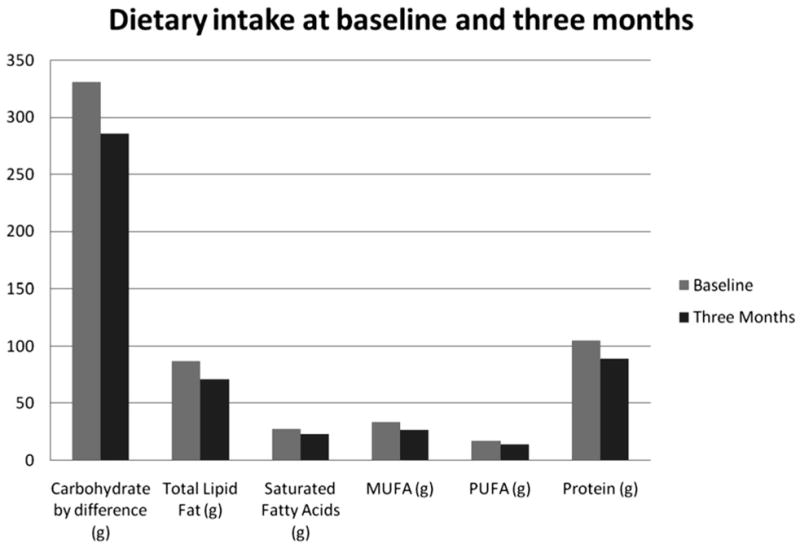
Change in dietary intake (cont’d) after a three-month Spanish diabetes education program, both genders.
Figure 4.
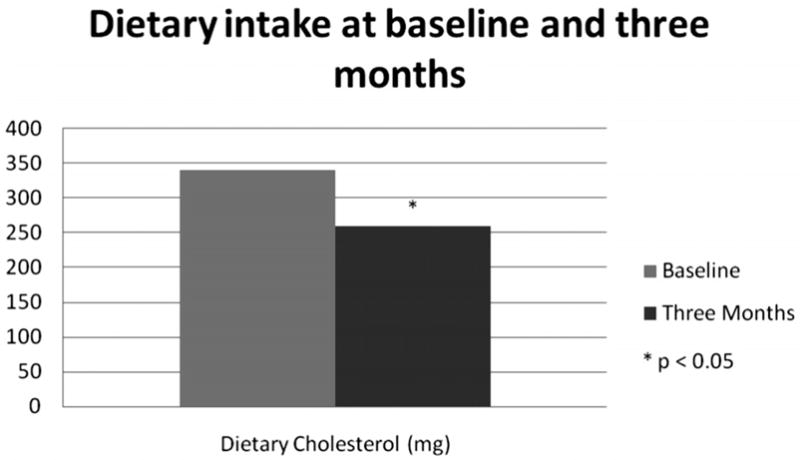
Change in dietary intake (cont’d) after a three-month Spanish diabetes education program, both genders.
Discussion
Serum lipids
After a 3-month culturally tailored diabetes education program, we observed improvements in some lipid profile parameters. We observed significant reductions in serum LDL cholesterol, total cholesterol, and HDL cholesterol (albeit the HDL reduction was relatively small). In a similar study by Brown et al. (2002), an improvement in diabetes knowledge among 256 Mexican-Americans was reported after a 12-month culturally competent diabetes education program [18]. The increase in diabetes knowledge among participants may have fostered adherence to nutritional advice which in turn may contribute to improvement in serum lipids. This was demonstrated by Philis-Tsimikas et al. (2004), wherein they observed significant improvements in total cholesterol (P <0.0001), LDL cholesterol (P <0.0001), and Hemoglobin A1c (P <0.0001) after 1 year of language-sensitive diabetes education in 153 patients with diabetes [19]. They concluded that improvement in clinical outcomes was due, in part, to overcoming language barriers that could have resulted in poor communication of nutritional advice towards diabetic patients.
According to Howard (2002), a reduction in any kind of fat in the diet results in a lowering of HDL cholesterol in people with diabetes [20]. Thus, in agreement with previous studies [21, 22], the observed decrease in HDL cholesterol in our study may have resulted from the decrease in dietary cholesterol, mono- and poly- unsaturated fatty acids and saturated fatty acids. The significant reduction in serum total cholesterol may have also contributed to the observed reduction in HDL cholesterol. Although our study had a small sample size (n=31) and short intervention period (3 months), we observed significant improvements compared to one-year studies.
Dietary intake
Improvements in dietary intake of participants in our study are consistent with results obtained in previous studies showing beneficial effects of intervention programs, including culture-specific education, on dietary intake [23, 24]. In another randomized study on 12 patients with type 2 diabetes, there was a decrease in mono- and poly-unsaturated fatty acids and saturated fatty acids after an eight-week education program [25]. We also demonstrated a significant reduction in dietary cholesterol consumption after a three-month diabetes education program. In studies that have demonstrated the effects of dietary cholesterol on blood cholesterol [26, 27], it was suggested that the increase in dietary cholesterol intake influences hepatic cholesterol metabolism, thus, raising serum cholesterol levels. The significance of these findings lies in the fact that improvements in dietary intake may predict improvements in serum lipids [28, 29].
According to the Diabetes Exchange System, a serving of white bread (or flour tortilla) is equivalent to 15 grams of carbohydrate which yields 80 calories [30]. This partially explains a clinically important finding in our study. We observed a decrease in total average energy intake by 393.9 kcal; we also observed a decrease in carbohydrate by 45 grams, equivalent to a reduction in three flour tortilla portions. There was a decrease in total lipid fat by 16 grams, equivalent to a reduction by three fat portions. We suggest that the EnBalance education program has positively influenced the improvement in energy, carbohydrate and fat intake. According to Volek et al. (2004), an energy restricted diet was associated with decreased trunk fat [31]. Thus, the observed decrease in energy in our study may have resulted in decreased trunk fat, which, according to Teixeria et al. (2001) may have decreased serum lipids [32] in the study participants.
In a study done by Snijder et al. (2004), trunk fat, determined by DXA, was positively associated with BMI and fasting glucose. They also found an association between larger waist circumference and poorer glucose tolerance status [33]. In our study, we obtained similar results. We observed that a decrease in BMI was significantly associated with a decrease in trunk fat and trunk percent fat. We also obtained a significant positive association between fasting glucose reduction and waist circumference reduction. This association may be explained by the role of free fatty acids (FFAs) in glucose metabolism. According to Seidell et al. (2001), changes in waist circumference are strongly associated with changes in visceral fat [34], which influences FFA metabolism. An increase in trunk fat results in increased rate of lipolysis within visceral adipose tissue [35] leading to increased circulating FFAs, which impair muscle uptake of glucose [35]. This results in higher serum glucose concentrations. Thus, a lowering of total energy (of which dietary fat is a component) in the diet, as observed in our study, may have contributed to the lowering of trunk fat, trunk percent fat, and waist circumference, which may have resulted in the lowering of fasting glucose.
Conclusion
We have demonstrated the effectiveness of a culturally suitable diabetes education program in the improvement of dietary intake and serum lipid profile among Hispanics with type 2 diabetes. Further studies are needed to evaluate possible associations between improvements in lipid profile and dietary intake.
Acknowledgments
This study was funded by: Grants CMS 03-00335 Health Services Research and NIH award 5P20MD001632
References
- 1.Mokdad AH, Ford ES, Bowman BA, Dietz WH, Vinicor F, Bales BS, Marks JS. Prevalence of obesity, diabetes, and obesity-related health risk factors. JAMA. 2003;289(1):76–9. doi: 10.1001/jama.289.1.76. [DOI] [PubMed] [Google Scholar]
- 2.Centers for Disease Control and Prevention. National Diabetes Fact Sheet. 2007 Retrieved March, 18, 2009 from www.cdc.gov/diabetes/pubs/pdf/ndfs_2007.pdf.
- 3.American Diabetes Association. Direct and indirect costs of diabetes in the United States. Retrieved April 3, 2009, from http://www.diabetes.org/utils/printthis-page.jsp?PageID=STATISTICS_233194.
- 4.Office of minority health. Hispanic/Latino profile. Retrieved March 19, 2009 from http://www.omhrc.gov/templates/browse.aspx?lvl=2&lvlID=54.
- 5.Narayan KM, Boyle JP, Thompson TJ, Sorensen SW, Williamson DF. Lifetime risk for diabetes mellitus in the United States. JAMA. 2003;290(14):1884–90. doi: 10.1001/jama.290.14.1884. [DOI] [PubMed] [Google Scholar]
- 6.McBean AM, Li S, Gilbertson DT, Collins A. Differences in diabetes prevalence, incidence, and mortality among the elderly of four racial/ethnic groups: Whites, Blacks, Hispanics, and Asians. Diabetes Care. 2004;27(10):2317–24. doi: 10.2337/diacare.27.10.2317. [DOI] [PubMed] [Google Scholar]
- 7.Vincent D, Pasvogel A, Barrera L. A feasibility study of a culturally tailored diabetes intervention for Mexican Americans. Biol Res Nurs. 2007;9(2):130–41. doi: 10.1177/1099800407304980. [DOI] [PubMed] [Google Scholar]
- 8.Davidson MB. Effect of nurse-directed diabetes care in a minority population. Diabetes Care. 2003;26(8):2281–7. doi: 10.2337/diacare.26.8.2281. [DOI] [PubMed] [Google Scholar]
- 9.Gary TL, Genkinger JM, Guallar E, Peyrot M, Brancati FL. Meta-analysis of randomized educational and behavioral interventions in type 2 diabetes. Diabetes Educ. 2003;29(3):488–501. doi: 10.1177/014572170302900313. [DOI] [PubMed] [Google Scholar]
- 10.Mauldon M, Melkus GD, Cagganello M. Tomando Control: a culturally appropriate diabetes education program for Spanish-speaking individuals with type 2 diabetes mellitus--evaluation of a pilot project. Diabetes Educ. 2006;32(5):751–60. doi: 10.1177/0145721706291999. [DOI] [PubMed] [Google Scholar]
- 11.Leeman J, Skelly AH, Burns D, Carlson J, Soward A. Tailoring a diabetes self-care intervention for use with older, rural African American women. Diabetes Educ. 2008;34(2):310–7. doi: 10.1177/0145721708316623. [DOI] [PubMed] [Google Scholar]
- 12.Povey RC, Clark-Carter D. Diabetes and healthy eating: a systematic review of the literature. Diabetes Educ. 2007;33(6):931–59. doi: 10.1177/0145721707308408. discussion 960–1. [DOI] [PubMed] [Google Scholar]
- 13.Sargrad KR, Homko C, Mozzoli M, Boden G. Effect of high protein vs high carbohydrate intake on insulin sensitivity, body weight, hemoglobin A1c, and blood pressure in patients with type 2 diabetes mellitus. J Am Diet Assoc. 2005;105(4):573–80. doi: 10.1016/j.jada.2005.01.009. [DOI] [PubMed] [Google Scholar]
- 14.Reljic R, Ries M, Ani N, Ries B. New chromogen for assay of glucose in serum. Clin Chem. 1992;38(4):522–5. [PubMed] [Google Scholar]
- 15.Taren D, de Tobar M, Ritenbaugh C, Graver E, Whitacre R, Aickin M. Evaluation of the southwest food frequency questionnaire. Ecol Food Nutr. 2000;38(6):515–547. [Google Scholar]
- 16.Going SB, Massett MP, Hall MC, Bare LA, Root PA, Williams DP, Lohman TG. Detection of small changes in body composition by dual-energy x-ray absorptiometry. Am J Clin Nutr. 1993;57(6):845–50. doi: 10.1093/ajcn/57.6.845. [DOI] [PubMed] [Google Scholar]
- 17.Rifai N, Warnick GR, Dominiczak MH, editors. Handbook of Lipoprotein Testing. 2. Washington, DC: AACC Press; 2000. p. 630. [Google Scholar]
- 18.Brown SA, Garcia AA, Kouzekanani K, Kouzekanani K, Hanis CL. Culturally competent diabetes self-management education for Mexican Americans: the Starr County border health initiative. Diabetes Care. 2002;25(2):259–68. doi: 10.2337/diacare.25.2.259. [DOI] [PMC free article] [PubMed] [Google Scholar]
- 19.Philis-Tsimikas A, Walker C, Rivard L, Talavera G, Reimann JOF, Salmon M, Araujo R. Improvement in diabetes care of underinsured patients enrolled in project dulce: a community-based, culturally appropriate, nurse case management and peer education diabetes care model. Diabetes Care. 2004;27(1):110–5. doi: 10.2337/diacare.27.1.110. [DOI] [PubMed] [Google Scholar]
- 20.Howard BV. Dietary fat and diabetes: a consensus view. Am J Med. 2002;113(Suppl 9B):38S–40S. doi: 10.1016/s0002-9343(01)00990-1. [DOI] [PubMed] [Google Scholar]
- 21.Clifton PM, Noakes M, Keogh JB. Very low-fat (12%) and high monounsaturated fat (35%) diets do not differentially affect abdominal fat loss in overweight, non-diabetic women. J Nutr. 2004;134(7):1741–5. doi: 10.1093/jn/134.7.1741. [DOI] [PubMed] [Google Scholar]
- 22.Lichtenstein AH, Ausmana LM, Jalberta SM, Vilella-Bach M, Jauhiainen M, McGladdery S, Erkkilä AT, Ehnholm C, Frohlich J, Schaefer EJ. Efficacy of a Therapeutic Lifestyle Change/Step 2 diet in moderately hypercholesterolemic middle-aged and elderly female and male subjects. J Lipid Res. 2002;43(2):264–73. [PubMed] [Google Scholar]
- 23.Klug C, Toobert DJ, Fogerty M. Healthy Changes for living with diabetes: an evidence-based community diabetes self-management program. Diabetes Educ. 2008;34(6):1053–61. doi: 10.1177/0145721708325886. [DOI] [PMC free article] [PubMed] [Google Scholar]
- 24.Pérez-Escamilla R, Hromi-Fiedler A, Vega-López S, Bermúdez-Millán A, Segura-Pérez S. Impact of peer nutrition education on dietary behaviors and health outcomes among Latinos: a systematic literature review. J Nutr Educ Behav. 2008;40(4):208–25. doi: 10.1016/j.jneb.2008.03.011. [DOI] [PMC free article] [PubMed] [Google Scholar]
- 25.Keyserling TC, Samuel-Hodge TC, Ammerman AS, Ainsworth BE, Henríquez-Roldán CF, Elasy TA, Skelly AH, Johnston LF, Bangdiwala SI. A randomized trial of an intervention to improve self-care behaviors of African-American women with type 2 diabetes: impact on physical activity. Diabetes Care. 2002;25(9):1576–83. doi: 10.2337/diacare.25.9.1576. [DOI] [PubMed] [Google Scholar]
- 26.Connor WE, Stone DB, Hodges RE. The Interrelated Effects of Dietary Cholesterol and Fat upon Human Serum Lipid Levels. J Clin Invest. 1964;43:1691–6. doi: 10.1172/JCI105044. [DOI] [PMC free article] [PubMed] [Google Scholar]
- 27.Stucchi AF, Nicholosi RJ, Karge WH, Ausman LM, Ordovas JM. Dietary cholesterol affects serum lipids, lipoproteins and LDL metabolism in cynomolgus monkeys in a dose-dependent manner. J Nutr. 1998;128(7):1104–13. doi: 10.1093/jn/128.7.1104. [DOI] [PubMed] [Google Scholar]
- 28.Ginsberg HN, Karmally W, Siddiqui M, Holleran S, Tall AR, Blaner WS, Ramakrishnan R. Increases in dietary cholesterol are associated with modest increases in both LDL and HDL cholesterol in healthy young women. Arterioscler Thromb Vasc Biol. 1995;15(2):169–78. doi: 10.1161/01.atv.15.2.169. [DOI] [PMC free article] [PubMed] [Google Scholar]
- 29.Ma Y, Li Y, Chiriboga DE, Olendzki BC, Hebert JR, Li W, Leung K, Hafner AR, Ockene IS. Association between carbohydrate intake and serum lipids. J Am Coll Nutr. 2006;25(2):155–63. doi: 10.1080/07315724.2006.10719527. [DOI] [PMC free article] [PubMed] [Google Scholar]
- 30.Thompson J, Manore M, Vaughan L, editors. The Science of Nutrition. Benjamin Cummings; 1301 San Francisco, CA: 2008. p. 74. [Google Scholar]
- 31.Volek J, Sharman M, Gomez D, Judelson DA, Rubin MR, Watson G, Sokmen B, Silvestre R, French DN, Kraemer WJ. Comparison of energy-restricted very low-carbohydrate and low-fat diets on weight loss and body composition in overweight men and women. Nutr Metab. 2004;1:13. doi: 10.1186/1743-7075-1-13. [DOI] [PMC free article] [PubMed] [Google Scholar]
- 32.Teixeira P, Saradinha L, Going SB, Lohman TG. Total and regional fat and serum cardiovascular disease risk factors in lean and obese children and adolescents. Obes Res. 2001;9(8):432–42. doi: 10.1038/oby.2001.57. [DOI] [PubMed] [Google Scholar]
- 33.Snijdser MB, Dekker JM, Visser M, Bouter LM, Stehouwer CD, Yudkin JS, Heine RJ, Nijpels G, Seidell JC. Trunk fat and leg fat have independent and opposite associations with fasting and postload glucose levels: The Hoon Study. Diabetes Care. 2004;27(2):372–377. doi: 10.2337/diacare.27.2.372. [DOI] [PubMed] [Google Scholar]
- 34.Seidell JC, Perusse L, Després J, Bouchard C. Waist and hip circumferences have independent and opposite effects on cardiovascualr disease risk factors: the Quebec family study. Am J Clin Nutr. 2001;74(3):315–321. doi: 10.1093/ajcn/74.3.315. [DOI] [PubMed] [Google Scholar]
- 35.Arner P. Insulin resistance in type 2 diabetes: role of fatty acids. Diabetes Metab Res Rev. 2002;18(2):S5–9. doi: 10.1002/dmrr.254. [DOI] [PubMed] [Google Scholar]