Abstract
Transport phenomena of platelets and white blood cells (WBCs) are fundamental to the processes of vascular disease and thrombosis. Unfortunately, the dilute volume occupied by these cells is not amenable to fluid-continuum modeling, and yet the cell count is large enough that modeling each individual cell is impractical for most applications. The most feasible option is to treat them as dilute species governed by convection and diffusion; however, this is further complicated by the role of the red blood cell (RBC) phase on the transport of these cells. We therefore propose an extended convection–diffusion (ECD) model based on the diffusive balance of a fictitious field potential, Ψ, that accounts for the gradients of both the dilute phase and the local hematocrit. The ECD model was applied to the flow of blood in a tube and between parallel plates in which a profile for the RBC concentration field was imposed and the resulting platelet concentration field predicted. Compared to prevailing enhanced-diffusion models that dispersed the platelet concentration field, the ECD model was able to simulate a near-wall platelet excess, as observed experimentally. The extension of the ECD model depends only on the ability to prescribe the hematocrit distribution, and therefore may be applied to a wide variety of geometries to investigate platelet-mediated vascular disease and device-related thrombosis.
1. Introduction
The simulation of transport of WBCs and platelets is important in various areas of biomedical engineering. Both cells play a vital role in wound healing and are important in the remodeling of bioscaffolds. Platelets are also involved in atherosclerosis (Ross 1999) and thrombosis. The interaction of WBCs with the vessel wall in adverse flow conditions leads to the formation of neointimal hyperplasia and atherogenesis (Chervu and Moore 1990, Ross 1999). Platelets and leukocytes can also interact during the inflammation response through traditional chemical pathways and binding receptors to form platelet-neutrophil clusters (Mickelson et al 1996). Platelet deposition in medical devices can induce thrombosis and formation of emboli, leading causes of hemodynamic-related complications. Therefore, an accurate, predictive model of cell transport would be valuable for a wide range of applications.
It is well known that blood flowing in a tube or vessel is characterized by a near-wall excess of platelets (Aarts et al 1988, Eckstein et al 1989). The phenomenon is valuable for the body’s response to injury. Several theories have been proposed for why this layer forms, but the most consistent with experimental findings is that the red blood cells (RBCs) exclude the platelets from the core, either through collision or volume displacement. The RBC motion to the core excludes the smaller, less dense platelets to the wall. The exact reason for why RBCs are preferred in the core as opposed to platelets is not fully understood since platelets and WBC also migrate away from the wall in the absence of RBCs (Goldsmith and Spain 1984, Aarts et al 1988). The most likely reason is that this is the lowest energy state for the system as a whole.
There are three methods used for mathematically modeling platelet and WBC transport: discrete models, fluid-continuum models and dilute phase models. Discrete models explicitly represent the microstructure of the blood, by either considering the dynamics of individual cells or the dynamics of representative particles on a mesocopic scale. The cells may be treated as particles or deformable capsules, depending on the scale of the domain with respect to the size of the cells. Fogelson et al (Fogelson and Guy 2004, Guy and Fogelson 2002, Kuharsky and Fogelson 2001) for example simulate blood flow of deformable cells in capillaries and arterioles in which tractions are imposed on the cells by both the surrounding fluid and collisions and adhesions between other cells. These models, done on the micro-scale, tend to be computationally intensive and hence are prohibitively expensive in large flow domains. For example, medical devices and large blood vessels may transport trillions of platelets and billions of white blood cells (WBCs) per second. Consequently, simulations of flow domains involving cell counts greater than the low hundreds are typically modeled by a disperse subset of the cells. For example, Kleinstreuer and colleagues (Hyun et al 2004, Longest and Kleinstreuer 2000, 2003b, 2003a, Longest et al 2000, 2003a, 2003b, 2005) simulate transport of platelets and WBCs in arterial anastomoses by studying the probability distributions of random particles. This technique provides consideration of the cell trajectories, shear history and surface interactions, but does not guarantee that they represent the entire population of cells normally present in the flow domain. A third variation in this class of models uses the lattice-Boltzmann method (Nguyen and Ladd 2002, Sun et al 2003, Sun and Munn 2005, Boyd et al 2005, Dupin et al 2006, Bernsdorf et al 2006), originally developed for rarified gases, which represents the cell population using probability densities of infinitesimally small particles. This approach has seen many recent advances (Gabbanelli et al 2005, Harting et al 2005, Premnath and Abraham 2005), but is not fully developed (Guo et al 2004, Hazi 2003, Latt et al 2008, Siebert et al 2008, Kim and Pitsch 2008, Rohde et al 2008, Kao and Yang 2008, Caiazzo and Junk 2008).
Fluid-continuum models assume that the cells comprise a distinct continuum ‘mixed’ with a continuum for plasma (Jung and Hassanein 2008, Jung et al 2006a, 2006b). The treatment of the cellular phase as a continuum is however questionable for WBCs and platelets, which are too dilute for the classical definition in continuum mechanics: that the medium is indeed ‘continuous not containing gaps or empty spaces’ (Malvern 1969) (see the appendix). In other words, these cells cannot contribute to the macroscopic dynamics of the flow (Sequeira and Janela 2007).
Dilute phase models for the transport of suspensions with low volume fraction are typically governed by the convection–diffusion transport theory. Platelets have been modeled using this approach for decades (Adams and Feuerstein 1983, Hubbell and McIntire 1986, Karner and Perktold 1998, Leonard et al 1972, Richardson 1981, Sorensen et al 1999a, Wootton et al 2001, Buchanan and Kleinstreuer 1998). Some of the more recent implementations by Sorensen et al (2002) and Jordan et al (2004) were used to predict platelet deposition in disturbed flow. Although the models performed well in predicting deposition between parallel plates, they were unable to accurately predict the deposition downstream of the reattachment point downstream of a backward step. Both groups theorize that this was due to the failure to include the active influence of RBCs that drive platelets toward the wall.
Several methods have been proposed to improve platelet transport to reactive walls. The early attempts used an enhanced diffusivity, as was also employed by Sorensen and Jordan (Sorensen, Jordan et al). These models have been effective to enhance platelet flux to the wall thereby predicting deposition at expected rates in parallel plates. But due to the isotropy of diffusion and the use of passive transport instead of an active method, these models do not establish or maintain a near-wall excess of cells. Consequently, they fail to predict the longitudinal deposition downstream of a backward step. Other approaches have been proposed using drift fluxes that force the platelet concentration to adopt a desired profile, but these require a priori knowledge of the final profile and are valid only in tube flow (Eckstein and Belgacem 1991, Hofer and Perktold 1997). Kao (2000) further proposed the use of a platelet flux contrary to the flux of RBCs. However, this assumption is only valid as the RBC concentration profile is developing, yet experiments show that the lateral platelet flux continues after the RBC profile is established.
In light of the numerous difficulties in accurately modeling the transport of platelet and WBCs, a more general approach is clearly needed that accounts for the various phenomena governing the interactions between multiple species such as permeability, volume exclusion, electrostatic repulsion, collisions, hydrodynamic interactions and hydration layer. An extended convection–diffusion (ECD) model is introduced here that employs a fictitious concentration function that lumps these key factors. The ECD model presumes that the RBC profile is prescribed based on experimental data or a complimentary multi-phase simulation such as that of Jung et al (Jung and Hassanein 2008, Jung et al 2006a, Jung et al 2006b) or Massoudi and Antaki (2008).
2. Extended convection-diffusion model
The ECD model presented below represents blood as a single continuum, in which the platelets and WBCs are modeled as dilute species. The concentration profile of RBCs interacts with either platelets or WBCs, obeying a conservation of mass principal similar to diffusion through membranes. Without loss of generality, the model is initially described for platelets and expanded to WBCs later. Considering a finite volume of blood, the overall mass flux of platelets is governed by the generalized transport equation:
| (1) |
where [P] is the concentration of platelets, and the vector J represents the flux of platelets, limited in this study to convection and diffusion:
| (2) |
where u is the velocity field of the fluid, D is the diffusivity of the platelets and Ψ is a field potential that incorporates the various factors that cause migration of cells. There are two physical conditions that Ψ must obey: (1) the flux must reduce to that of only platelets when the hematocrit is zero and (2) all fluxes in the platelet equation must vanish in the absence of platelets. The most general form that satisfies these two constraints is
| (3) |
where H is the hematocrit, ψ is a polynomial expansion of hematocrit about zero, N is the order of the polynomial expansion and ψi is the polynomial coefficient. Equation (3) implies an inverse relationship between [P] and H; therefore, a regional increase in RBC concentration causes a reduction (exclusion) of platelets. It is also assumed that the platelets are too dilute to affect the concentration of RBCs.
The 1 in the ψ term is for normal Brownian diffusion and the summation term represents the RBC-induced transport. Another physical representation of the model parameters can be illustrated by expanding the diffusive flux for Ψ:
| (4) |
The first term is the diffusive flux of platelets away from regions of high RBC content, such as the core of pipe flow, where there is a greater likelihood of interaction. The second term represents the RBC-enhanced diffusion of platelets along the gradient of platelet concentration. Therefore, the flux of platelets toward the wall is eventually balanced by the flux of platelets down the concentration gradient.
3. Methods
The model was evaluated in two geometries: parallel plates, commonly used to study the deposition of platelets on artificial surfaces (see figure 1), and a cylindrical tube, also used experimentally to observe distribution of both platelets and WBCs.
Figure 1.
Simulation domain representative of the standard parallel plate experiment. B represents the half-height (0.01 cm) and L is the channel length (1.6 cm).
The simulations performed in parallel plates adopted dimensions to approximate those of Slack and Turitto (1994) having a half-height, B, of 100 µm. The length and width of the experimental channel were much larger than B allowing the end effects to be neglected. A non-slip condition was applied to the walls with respect to the fluid flow. The walls were also treated as non-reactive with respect to the deposition of cells (platelets and WBCs.) The wall shear rate was set to 1000 s−1 to match experimental and simulation data of Wagner and Hubbell (1990) and Sorensen et al (1999a), respectively. The flow was assumed to be steady state and Newtonian due to the high shear rate, yielding the velocity field throughout the domain as
| (5) |
where u is the component of the velocity vector in the x-direction and
| (6) |
where v is the component of the velocity vector in the y-direction. Umax is calculated from the wall shear rate from
| (7) |
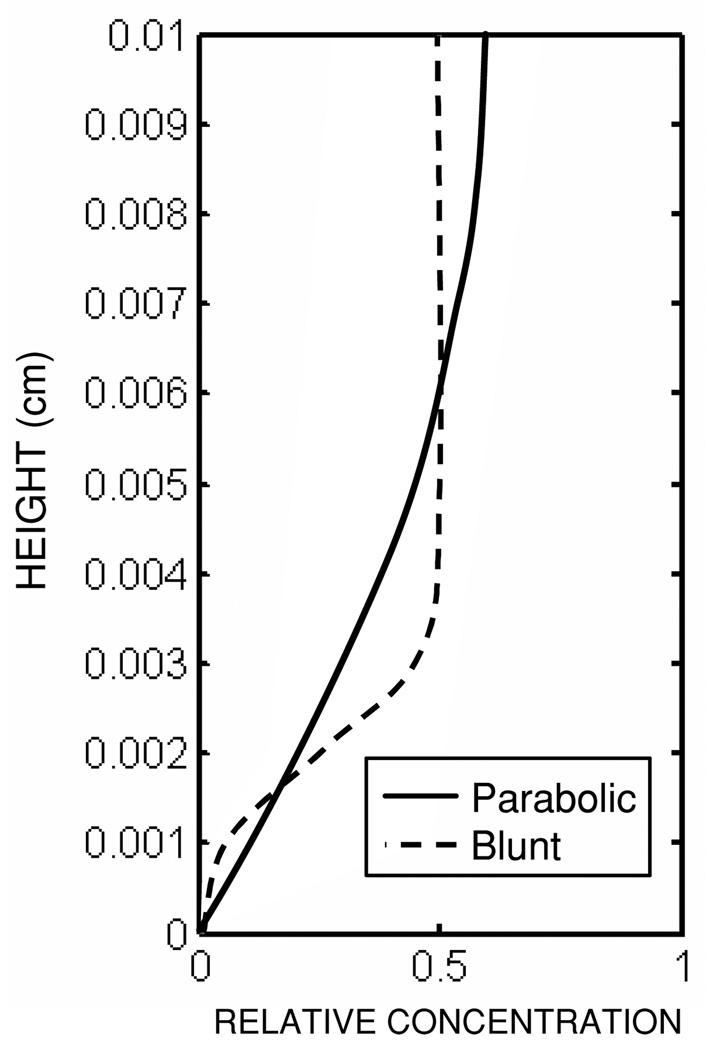
Two different hematocrit profiles were specified for use in equation (3), one parabolic, Hp, and one blunt, Hb, shown in figure 2. The functional forms of these profiles are given below:
| (8) |
| (9) |
where H̄ is the bulk hematocrit (40% in this study), and H̃ is a constant specified to achieve a bulk hematocrit of 40%. Hp aimed to approximate the profile determined by previous numerical simulations (Massoudi and Antaki 2008), while Hb approximated the distribution of blood cells observed experimentally (Aarts et al 1988).
Figure 2.
Prescribed hematocrit profiles for the parallel plate simulations.
The model was calibrated using fully developed flow, which reduced the dependence of the problem to a single dimension, y. The transport equations (3)–(5) were integrated to yield the steady-state platelet concentration profile:
| (10) |
The constant c was calculated from
| (11) |
assuming constant flux, where Co is the bulk platelet concentration. Sensitivity analysis was run for ψ1 setting N = 1, and for N setting ψi to 10. Then, the unknown values, ψi and N, were optimized to best match an empirical fit to experimental data of Hubbell, presented by Wagner (1991) and later Sorensen et al (1999a):
| (12) |
where δ is 35% of H, and A is an empirical constant, 5.6. Several criteria were used to determine the best fit. The first was the R2-value:
| (13) |
The 95% confidence intervals for the model parameters were calculated using Monte Carlo simulations (Motulsky and Christopoulos 2004). ANOVA was applied as per Motulsky and Christopoulos (2004) to determine significant difference between models of different orders. These models were also compared using the Akaike’s information criterion (Motulsky and Christopoulos 2004).
The model was then implemented in a two-dimensional simulation of blood flow between parallel plates to evaluate the development of the concentration profile from inlet to outlet. Three sub-cases were considered: (case 1.1) steady state, using the empirical platelet concentration profile (equation (12)) as the inlet boundary condition to test the stability of the steady-state solution; (case 1.2) unsteady, using an initially uniform concentration of platelets throughout the domain to evaluate the development of the profile over time; and (case 1.3) unsteady, using an initially zero concentration over the domain and the empirical profile at the inlet to evaluate the development of the profile in both time and space. The simulated profiles were compared at different lengths along the flow domain. The total mass inflow was compared to the outflow to ensure that mass conservation was upheld.
For case 1.1, various enhanced diffusivity models commonly used to predict deposition of platelets along parallel plates were investigated:
| (14) |
proposed by Keller (1971),
| (15) |
used by Zydney and Colton (1988), and
| (16) |
introduced by Sorensen et al (1999a, 1999b), where De is the enhanced diffusivity, Dplt is the Brownian diffusivity of platelets (1.58 × 10⁻⁹ cm2−s−1), drbc is the diameter of the RBC (5 µm), and k and n are empirical constants 0.0375 and 0.8, respectively. In addition, we proposed an anisotropic diffusion tensor with the form
| (17) |
where Drbc is the RBC-enhanced isotropic diffusivity and Dmig is the cross-stream diffusivity. Drbc is caused by the rotational motion of RBC, similar to small-scale eddies in turbulent flow, and the random interaction of the RBCs. Drbc has the form
| (18) |
and Dmig caused by inward migration of cells has the form
| (19) |
The coefficients in the anisotropic model were determined using the same method used by Sorensen et al (1999a). The above models typically yield diffusivities of platelets several orders of magnitude greater than the Brownian diffusivity. Additional studies combined the various enhanced diffusion models with the ECD model to better understand the influence of diffusivity on the ECD.
Case 1.2 employed periodic boundary conditions at the inlet and outlet to simulate an infinitely long domain. The flow was simulated for 300 s which allowed a steady-state profile to be reached. In case 1.3, the domain was initially devoid of platelets and the duration of the simulated flow was limited to 75 s to correspond with the results of Sorensen et al (1999a, 1999b).
Case 2 entailed simulations in a cylindrical geometry to approximate the observations of Plt and RBC distributions by Aarts et al (1988), and RBC and WBC distributions by Goldsmith and Marlow (1979) and Goldsmith and Spain (1984). The tube diameter and length was 3 mm, respectively, for the Aarts simulation, and 180 µm and 5 cm for Goldsmith simulation. The wall shear rate used by Aarts et al was 800 s−1. The corresponding average velocity used by Goldsmith was 1.38 mm s−1 and the velocity field was again assumed fully developed and Newtonian:
| (20) |
and
| (21) |
where U is the mean velocity and R is the tube radius. The RBC concentration fields were set to match the experimentally observed concentration profiles and the final concentration profiles for platelets and WBCs were compared to the corresponding experimental results.
For each of the cases above, the transport equations were solved using the finite element package COMSOL 3.1 (Comsol AB). The domain was discretized using a structured mesh that was uniform in the x-direction and logarithmic in the y-direction for improved accuracy at the boundary. Memory allotment was exceeded before mesh independence could be established, but since the mesh exhibited m + 1 convergence, the mesh size was selected for an error of 1 × 10⁻⁸. The time derivatives were solved using the adaptive step algorithm, backward differentiation formulation (BDF), built into Comsol with a relative tolerance of 0.001 and absolute tolerance of 0.0001.
The model was evaluated using the following six criteria, given by Pope (2000) for appraising fluid dynamic models: (1) level of description, (2) completeness, (3) cost, (4) ease of implementation, (5) range of applicability and (6) accuracy. The level of description compares the information provided by the model to the desired information. A model is deemed complete if it only requires material properties, boundary conditions and the initial conditions, i.e. does not require problem-specific parameters or definitions. The cost of the model deals with the number of unknowns, the required mesh (spatial and temporal) and the number and linearity of the equations. These directly impact the computational cost in terms of memory and time. Ease of implementation regards the time and effort required to implement the model. The range of applicability is a measure of the versatility of the model to alternative applications (geometries). The final measure, accuracy, indicates how well the model represents the real world results.
4. Results
4.1. Model calibration in fully developed, steady-state flow between flat plates
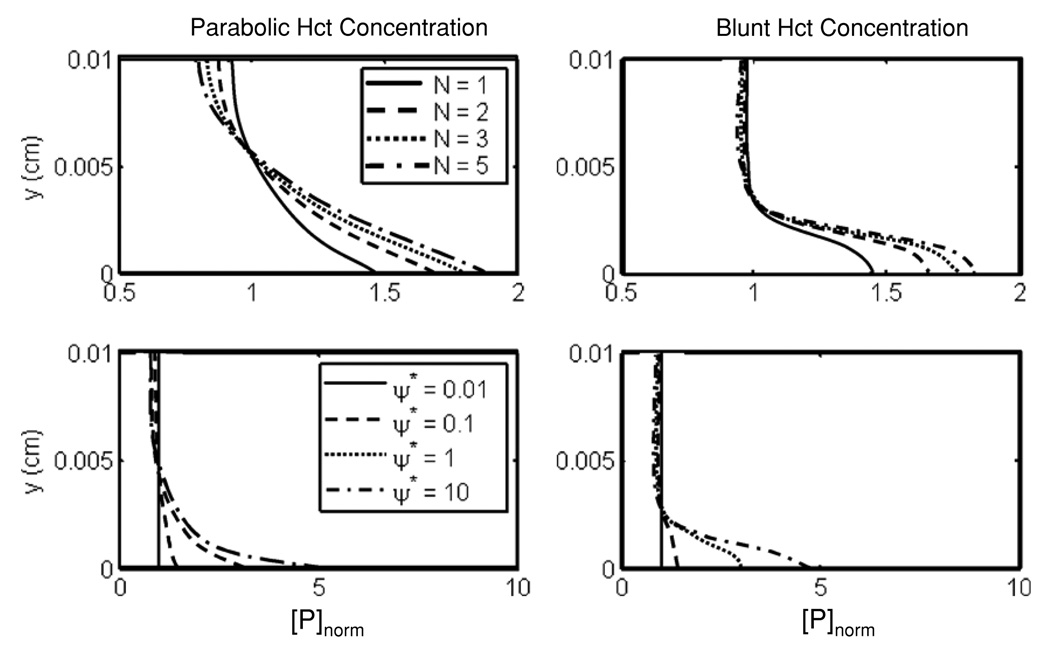
The closed-form solution (equation (10)) of transport between parallel plates using the ECD model exhibited the expected near-wall excess of platelets regardless of the hematocrit profile (see figure 3). Figure 3 also shows the sensitivity of predicted platelet profile to the model parameters N and ψi. Increasing N increased the Plt concentration in the boundary layer and reduced the core concentration of platelets. Due to this behavior, ψi is a better parameter for fine tuning the model. Irrespective of the hematocrit profile, the model was more sensitive to ψi than to changes in N. The profile approached an asymptotic limit with increasing N and/or ψi.
Figure 3.
Sensitivity analysis of the fully developed, steady-state solution to the parameters N (top) and ψ* (bottom) using both a parabolic (left) and a blunt (right) profile for hematocrit.
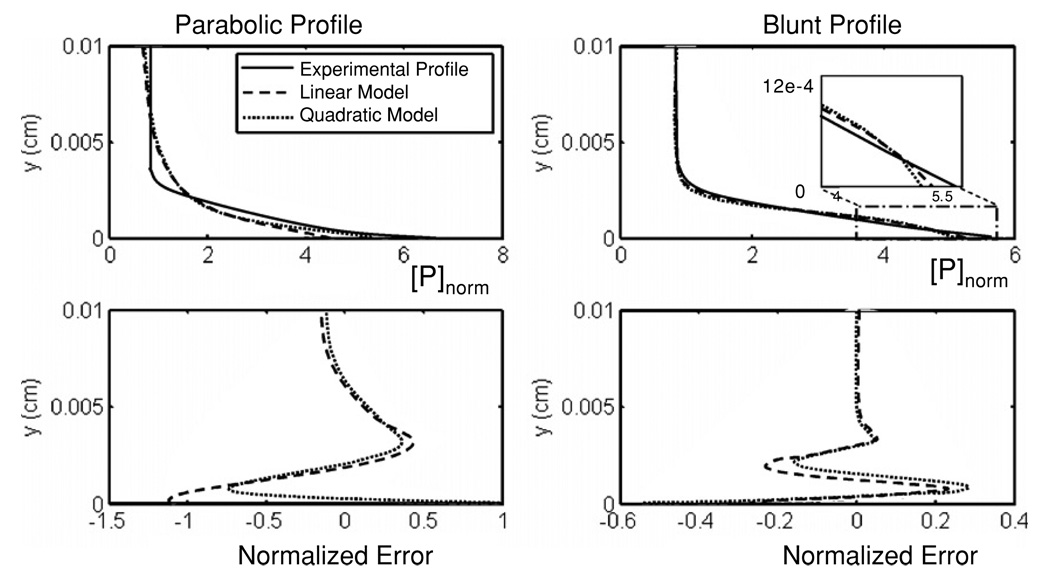
The regression of the closed form solution to the empirical profile of Hubbell yielded values N = 2, ψ1 = 6.8 and ψ1 = 10.1 for the parabolic hematocrit profile (normalized mean-squared error of 0.0542). The linear case (N = 1) also provided a reasonable fit (mean-squared error of 0.0795), with ψ1 = 13.2. The 95% confidence interval for ψ1 was 11.9–14.5. The core concentration was predicted relatively well. However, the profile was less blunt compared to the experimental observations. The predicted platelet boundary layer thickness was 1/4th of the channel height, versus approximately 1/6th reported by Hubbell (see figure 4). Using the blunt profile, the optimal value for N and ψ1 were 1 and 11.4, respectively. The 95% confidence interval for ψ1 was 10.8–12.0. The R2-value for the linear case (N = 1) calculated simultaneously for both profiles was 0.943, which was higher than the quadratic case (N = 2) 0.893. For N = 1, the optimal values of ψ1 when using the parabolic profile versus blunt profile were found to differ by only 16%, despite the 19% differences in hematocrit profiles. This would imply that the choice of hematocrit profile should not dramatically affect the optimal value of ψ1. The core concentration using the blunt profile was flatter and matched the empirical fit of Hubbell, yet preserving the near-wall excess (figure 4). The transition region was also more accurately reproduced by the blunt profile. There was not a significant difference between the linear and quadratic models (p = 0.11) which was further corroborated by the corrected Akaike’s information criterion (5.4) being greater than zero.
Figure 4.
Platelet concentration profiles per unit flux (top) and normalized error (bottom) using the optimal values for the model parameters compared to the experimental profile. The inset plot compares the near-wall profiles.
4.2. Results: 2D flow between parallel flat plates
Based on calibration results above, numerical simulation of flow between parallel plates was performed using both blunt and parabolic profiles with N = 1 and their respective optimal value of ψ1*. The results were compared to the empirical data and to enhanced diffusivity models (see figures 5–7).
Figure 5.
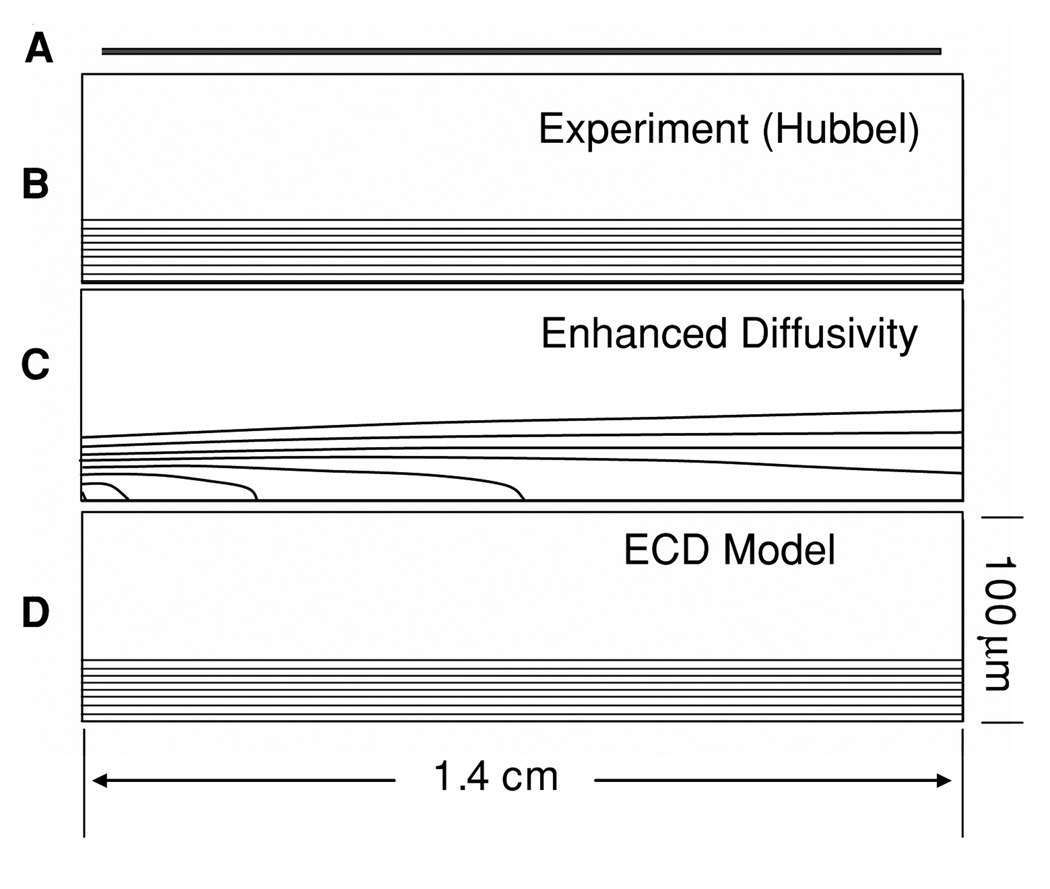
Platelet concentration field between parallel plates. (A) illustrates the geometry to scale; (B) experimental profile (scaled 200:1 in the y-direction) (C) predicted concentration using the enhanced diffusivity of Sorensen (Sorensen) illustrating rapid dispersion of platelets (50% at 0.4 cm); (D) ECD model which maintains the elevated near-wall concentration.
Figure 7.
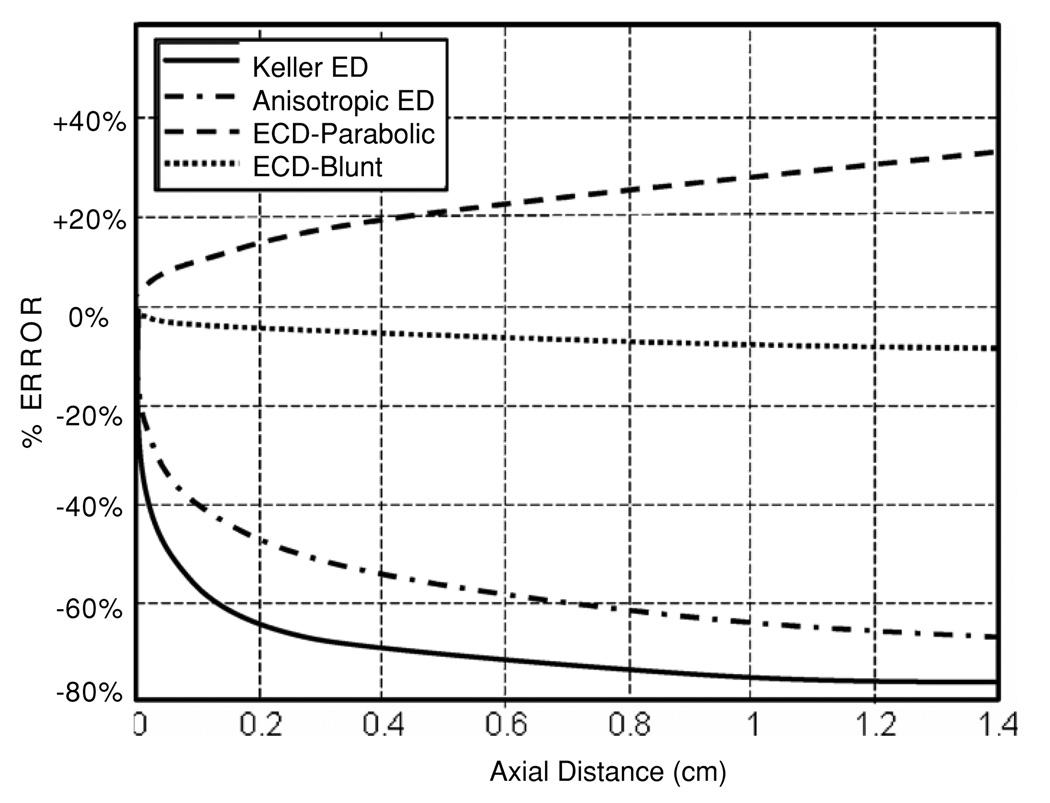
Error between predicted and experimental near-wall platelet excess for four of the models studied.
4.2.1. Case 1.1: steady state
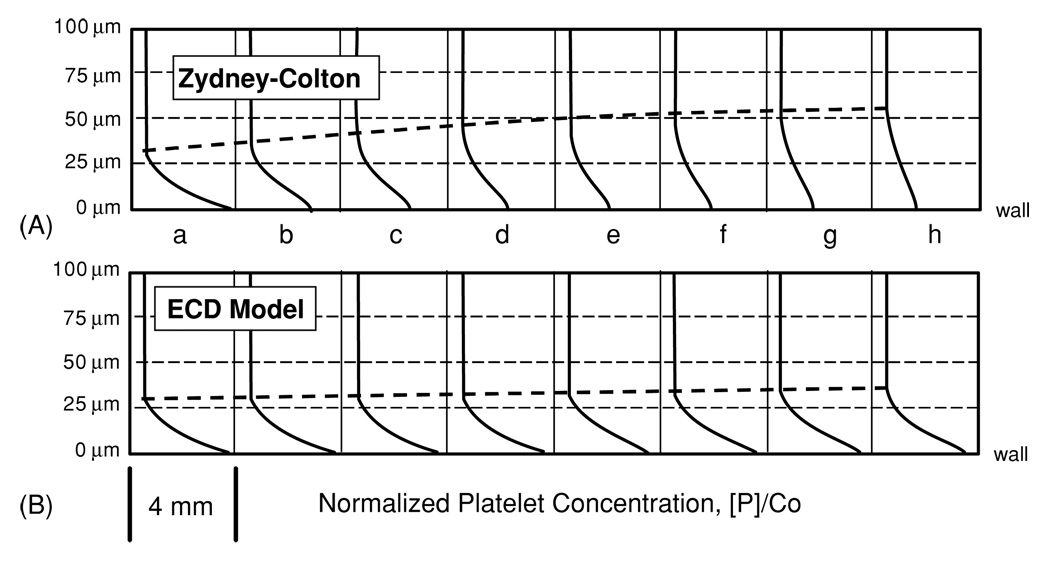
Without loss of generality, all enhanced diffusivity models caused a rapid dissipation of the near-wall excess downstream of the inlet. For example, figure 5(c) illustrates 50% depletion of the peak platelet concentration at 4 mm downstream using the Sorensen model (equation (16)). These iso-concentration contours revealed the effect of the isotropic dispersion of platelets reflected in the relatively uniform concentration level. By contrast, the ECD model maintained the general form of the skewed platelet profile from inlet to outlet regardless of RBC profile (see figure 5(d)). Figure 6 compares the ECD model to the best-performing enhanced diffusivity model, the Zydney–Colton (Z-C) model (equation (15)), in terms of the platelet concentration profiles at every 2 mm of axial length. The Z-C model underpredicts the near-wall platelet concentration at the exit by almost 60% compared to the empirical data. Figure 6 also shows that the growth of the platelet boundary layer was higher for the Z-C model, almost doubling by the outlet, while the ECD maintained almost a constant boundary layer. The ECD model (with parabolic Ht profile) predicts an increase over the length of the domain, resulting in an overprediction of 33% at the outlet.
Figure 6.
Normalized platelet concentration profile at 2 mm intervals along channel for the (A) Zydney–Colton-enhanced diffusivity model and the (B) ECD model using the blunt hematocrit profile.
Figure 7 compares the longitudinal development of the near-wall concentration for the ECD model (with both parabolic and blunt profiles) to both the Keller (equation (14)) and anisotropic enhanced diffusivity models (equation (17)). The ECD model using the parabolic profile predicts an increase of 33% over the length of the domain while the concentration predicted using the blunt profile shows a 6.5% decrease. The Keller diffusion and anisotropic diffusion models show a rapid decrease in the near-wall concentration within the first 4 mm followed by a slower rate of transport.
Table 1 provides a quantitative summary of these data in terms of the ratio of simulated versus experimental wall concentration and the overall RMS difference, the ratio of core concentration to wall concentration, and the error in the near-wall excess at 2 mm, 8 mm and 1.4 mm. The R2-value for the predicted profiles was calculated at 1.4 mm as compared to the experimental profile. The ECD model using the blunt profile had the best performance over the length of the domain. The Keller model had the worst performance over the entire domain, losing 64% of the near-wall excess within the first 2 mm. The Z-C model was simulated using both the bulk hematocrit and a spatially dependent (blunt) hematocrit profile. The variable hematocrit model showed improved behavior over the bulk model with RMS values greater than 15% (54.3%, 27.9%, and 16.7%) below the bulk version. This means that the dispersal of platelets from the near wall into the free stream is delayed until further downstream. The anisotropic model did not show any improvement over the other enhanced diffusion models. The enhanced diffusion models showed an average decrease of 66% as the platelets dispersed to the core region of the flow.
Table 1.
Comparison of predicted with experimental platelet concentration profiles at three locations along the domain length based on near wall to core concentration ratio, near-wall concentration and the normalized RMS deviation over domain height. The R2 value between the predicted profiles and the experimental profile was also given at the outlet.
| 2 mm | 8 mm | 14 mm | |||||||||||
|---|---|---|---|---|---|---|---|---|---|---|---|---|---|
| Axial distance | Wall to core ratio |
Wall []/ empirical % |
% Diff. |
RMS | Wall core ratio |
Wall []/ empirical |
% Diff. |
RMS | Wall to core ratio |
Wall []/ empirical |
% Diff. |
RMS |
R2- value |
| Empirical profile | 6.60 | 1.00 | 0 | 0 | 6.60 | 1.00 | 0 | n/a | 6.60 | 100 | 0 | 0 | 1 |
| Sorensen | 3.80 | 0.576 | −42.4 | 4.80 × 10⁷ | 2.75 | 0.417 | −58.2 | 7.75 × 10⁷ | 2.34 | 0.356 | −64.4 | 8.99 × 10⁷ | 0.485 |
| Keller | 2.39 | 0.361 | −63.9 | 8.87 × 10⁷ | 1.69 | 0.256 | −74.4 | 1.12 × 10⁸ | 1.52 | 0.229 | −77.0 | 1.18 × 10⁸ | 0.342 |
| Zidney and Coltran-bulk | 3.52 | 0.524 | −47.6 | 5.70 × 10⁷ | 2.46 | 0.373 | −62.7 | 8.63 × 10⁷ | 2.12 | 0.322 | −67.8 | 9.71 × 10⁷ | 0.367 |
| Zidney and Coltran-blunt | 4.89 | 0.740 | −26.0 | 2.63 × 10⁷ | 3.47 | 0.525 | −47.5 | 6.12 × 10⁷ | 2.76 | 0.419 | −58.1 | 8.08 × 10⁷ | 0.562 |
| Anisotropic | 3.52 | 0.534 | −46.6 | 5.53 × 10⁷ | 2.52 | 0.382 | −61.8 | 8.44 × 10⁷ | 2.17 | 0.329 | −67.1 | 9.55 × 10⁷ | 0.388 |
| Parabolic profile | 7.53 | 1.14 | +14.1 | 7.48 × 10⁶ | 8.30 | 1.25 | +25.7 | 1.53 × 10⁷ | 8.81 | 1.33 | +33.5 | 2.11 × 10⁷ | 0.9701 |
| Blunt profile | 6.35 | 0.963 | −3.72 | 1.70 × 10⁶ | 6.25 | 0.948 | −5.24 | 7.68 × 10⁶ | 6.17 | 0.935 | −6.46 | 4.13 × 10⁶ | 0.9982 |
The results above used the Brownian value for diffusivity of platelets. Additional simulations with the ECD model were performed using four different diffusivity functions. These were the anisostropic model; the spatially dependent form of the Z-C model; the stream-wise component of the anisotropic model and a modified version of the stream-wise diffusion using the form
| (22) |
The latter function was introduced to account for the local hematocrit. The first three of these diffusivity models resulted in a depletion of the near-wall excess at the outlet, underpredicting the near-wall concentration by 18.6%, 25.2% and 25.5%, respectively. The combined models did perform better than the best-performing enhanced diffusivity model (Z-C) with an error −58%, but underperformed the ECD model with Brownian diffusivity, with an error of −6.7%. The hematocrit-modified diffusivity (equation (21)) was the best-performing model, with an error of only −1.5%. It should be noted that the effective RBC-enhanced diffusion of the ECD model is 5 Db, as compared to 1000 Db for the enhanced diffusivity models.
To verify the integrity of the numerical solution, the conservation of mass for each of the cases above was compared to a negative control benchmark, in which the walls are allowed to be permeable. As compared to the latter case, in which 39.3% of the platelets were lost, the unmodified diffusivity resulted in 2 × 10⁻¹⁰% loss, and the modified models ranged from 1.6 × 10⁻²% to 3.6 × 10⁻⁷% loss. The ECD models exhibited the greatest losses of the models tested, 1.6 × 10⁻²% and 1.6 × 10⁻³% for the parabolic and blunt profiles, respectively. This was comparable to the Keller model, yet four orders of magnitude less than that of a free wall.
4.2.2. Case 1.2: unsteady with initially uniform concentration
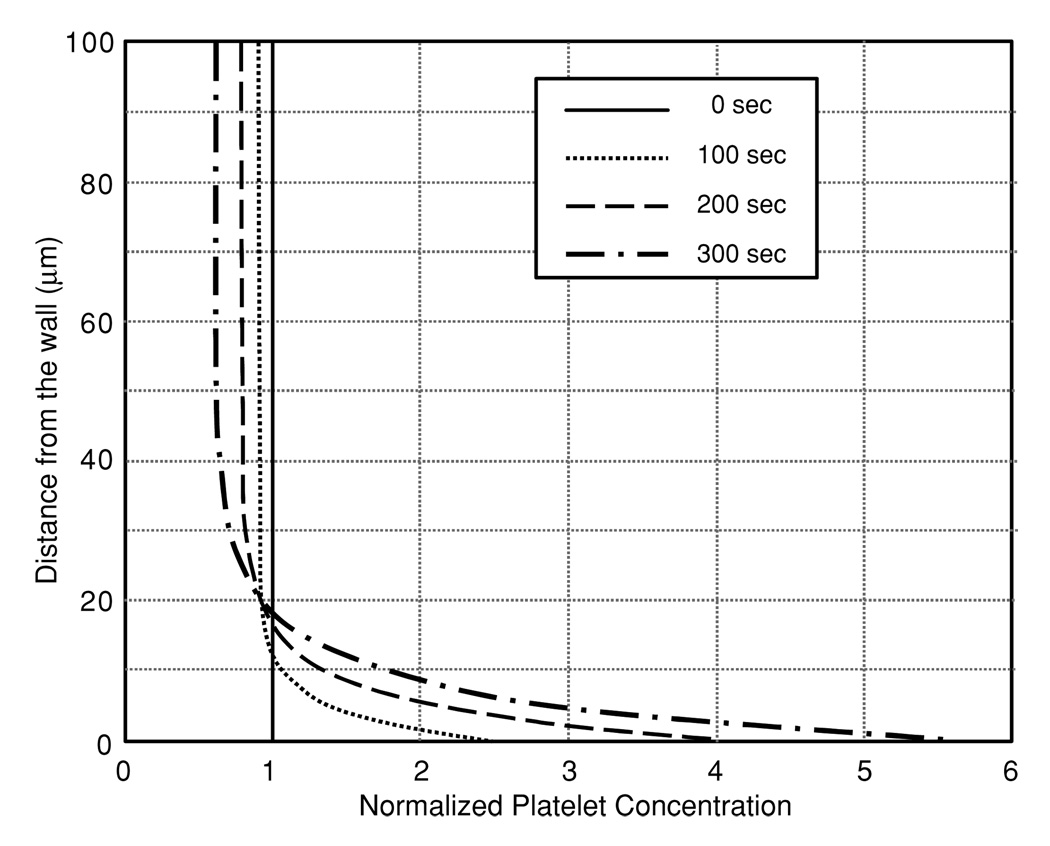
When the profile was permitted to develop temporally from an initially uniform concentration (1.5 × 10⁸ Plts ml−1), the model predicted the generation of near-wall excess comparable to the steady-state case (case 1.1.) (see figure 8). This temporal development was more rapid with the parabolic hematocrit profile as compared to the blunt profile; however, both profiles yielded virtually equivalent steady-state results. The choice of hematocrit profiles also affected the shape of the intermediate [Plt] profiles. Compared to the relatively smooth transition exhibited by the parabolic profile (shown in figure 8), the blunt hematocrit profile caused an initial excess in the transition region between 10 and 30 µm from the wall, which propagated toward the wall.
Figure 8.
The development of the platelet-rich boundary layer predicted by the ECD model with parabolic hematocrit profile.
4.2.3. Case 1.3: unsteady with an initially zero concentration
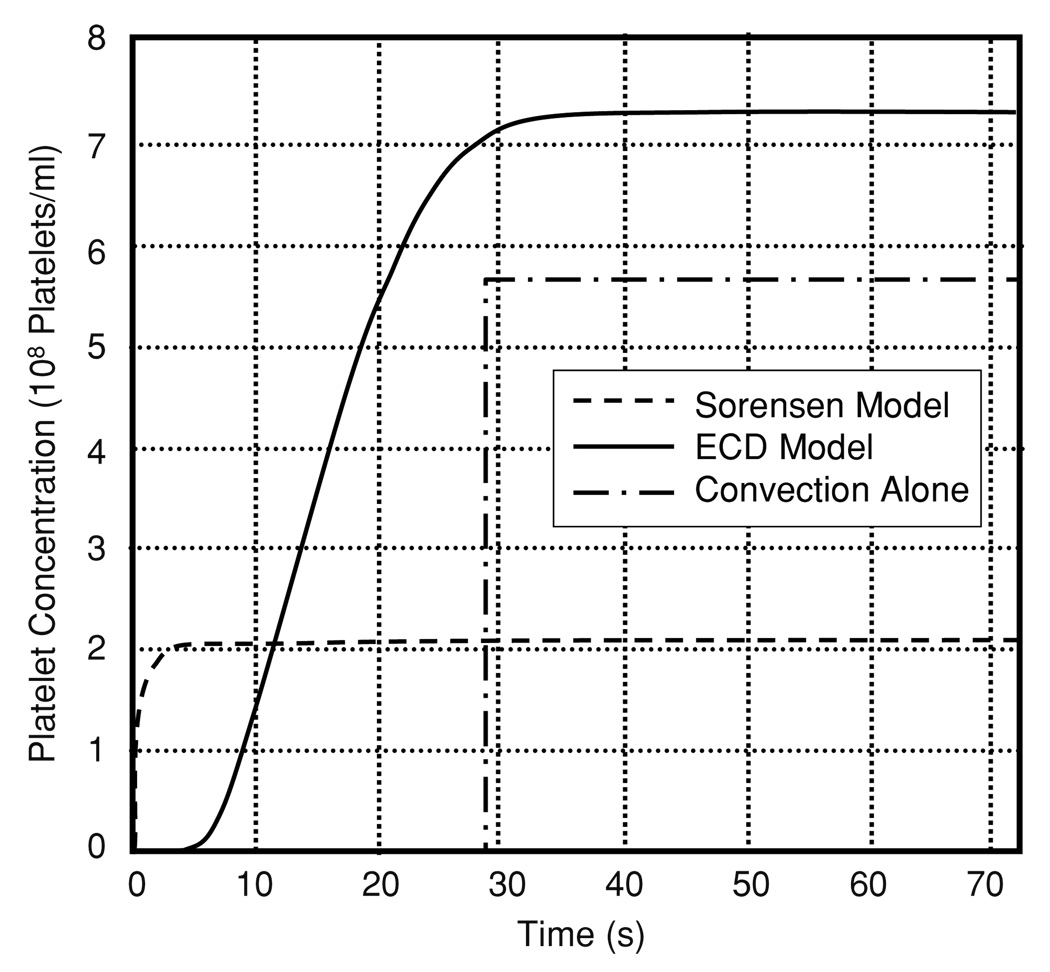
An additional unsteady simulation was performed to determine the effect of the ECD model on the rate of development of the steady-state concentration profile. Accordingly, an empty domain was used as the initial condition, similar to that employed by Sorensen et al (1999a, 1999b). The boundary condition at the inlet was the empirical platelet profile. In this simulation, the steady-state profile was achieved within approximately 30 s. This is illustrated in figure 9 by the transient growth of the near-wall (0.5 µm) concentration at 1.4 cm downstream of the inlet. There is a delay of approximately 5 s before platelets start arriving in that region, where convection alone would imply a delay of 28.5 s before the arrival of platelets. By comparison, the enhanced diffusivity models represented by the Sorensen function result in the arrival of platelets within 1 s due to the three orders of magnitude difference in diffusivities. The platelets arrive almost immediately using the enhanced diffusion, while there is a slight time delay using the ECD model. This delay agrees with experimental data presented by Folie and McIntire (1989) who showed a slight delay before deposition started.
Figure 9.
Concentration of platelets at a near-wall location (0.5 µm from the wall and 1.4 cm from the inlet) predicted by the Sorensen-enhanced diffusion model, the ECD model and pure convection.
4.3. Platelet distribution in tube flow
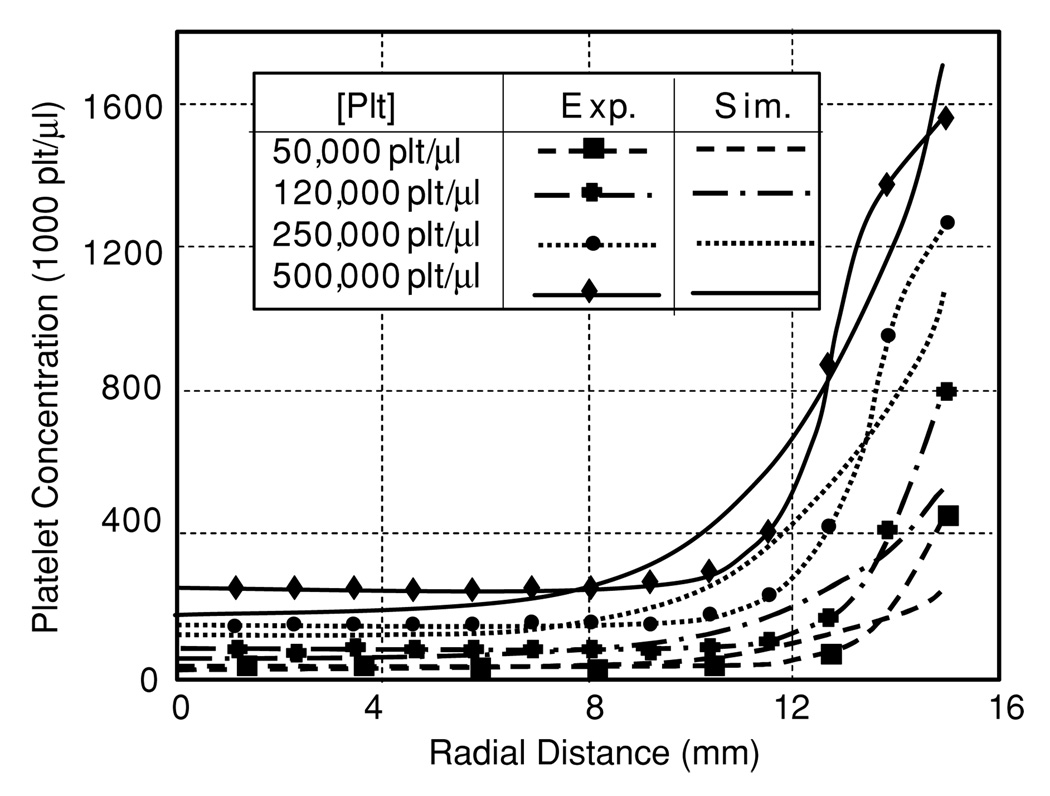
The model, optimized for flow in parallel plates, only had slight difficulty in predicting the experimental results of blood flow in a tube by Aarts et al (1988). For low concentrations of platelets, the model predicted the core concentration well, but underpredicted the near-wall excess (see figure 10). For the highest concentration of platelets, the reverse was seen. The RMS error between experimental and predicted results for the four platelet concentrations studied (50, 120, 250, 500 kplt µl−1) was 43.4 (87%), 66.0(55%), 93.5(37.4%) and 94.1 (19%), respectively. Therefore, the model performed best at higher concentrations of platelets.
Figure 10.
Comparison of predicted and experimentally measured platelet profiles for several bulk concentrations of platelets in tube flow.
4.4. White blood cell distribution in tube flow
The final test for the model was to predict the outward migration of WBCs. The ratio of core concentration to wall concentration was 3.8.
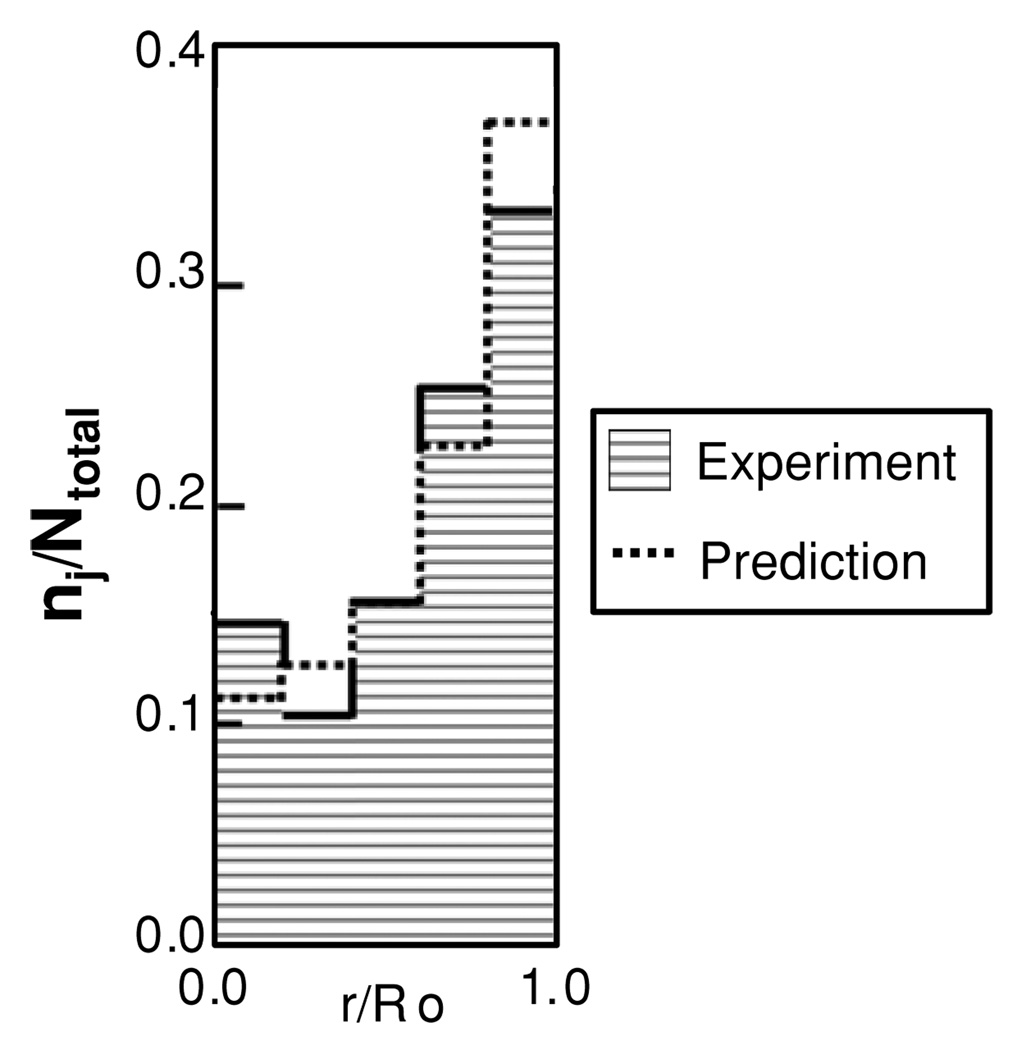
Figure 11 compares the experimental data from Goldsmith and Spain (1984) to the simulation results with ψ1 set to 1. These experimental results were reported as ratio of the WBC count in each of five annular subregions to the total WBC count. The simulation results were likewise compared to these experimental data using the ratio of the analogous numerical integral of WBC concentration in each region.
Figure 11.
Comparison of normalized WBC distribution predicted by the ECD model in tube flow compared to the experimental results of Goldsmith and Spain.
5. Discussion
A proper mathematical model of platelet-mediated thrombosis requires an accurate prediction of the transport and concentration field of platelets. The prevailing enhanced-diffusivity (ED) models are unable to predict or preserve flow-induced platelet concentration. Because they presume passive diffusion, they will inevitably lead to the uniform steady-state concentration field. However, it is well known that regions of the enhanced platelet concentration may occur in flowing blood—due to active transport mechanisms such as lift and drag (Zhao et al 2006). This phenomenon can be simulated through mechanistic models in which the hydrodynamic forces and cellular collision are explicitly accounted for. However, such models are impractical for large-scale problems. This was the motivation for introducing a microstructurally motivated phenomenological model, in which the components have physical relevance and account for anisotropic active transport of platelets.
Table 2 compares the enhanced diffusivity model and the ECD using the criteria of Pope for assessing the quality of a model. The ECD model, although similar to the enhanced diffusivity models in many aspects, showed a higher accuracy in predicting the concentration field and a wider range of applicability. Because of its ability to produce an experimentally accurate concentration field from a variety of initial conditions, it offers promise of predicting platelet concentration in other, arbitrary flow geometries. This would greatly improve its value as a design tool for blood-wetted devices.
Table 2.
A comparison of model characteristics based on the criteria of Pope (2000).
| Enhanced diffusion | ECD model |
|---|---|
| Level of description | |
|
|
| Completeness | |
|
|
| Cost and ease of implementation | |
|
|
| Range of applicability | |
|
|
| Accuracy | |
|
|
The advantage of this model is illustrated by its ability to accurately predict the near-wall excess of platelets that occurs in blood flow within small tubes and parallel plates. The ECD predicted a near-wall excess of seven to eight times the core concentration, which agrees well with experimentally observed values (Aarts et al 1988, Eckstein et al 1989). The only other known model that can predict this phenomenon is the drift flux model, which however requires a priori knowledge of the platelet concentration (Eckstein and Belgacem 1991).
Experiments by Wagner and Hubbell (1990) of platelet deposition in parallel plates argued that the upstream deposition along the wall was limited by the adhesion kinetics, while downstream deposition was limited by the lateral transport of platelets. Folie and McIntyre (1989) likewise showed that there was a consistent delay time between the initiation of flow and initial platelet deposition. Both ED and ECD models showed that the concentration near the inlet quickly reaches the peak value which is maintained by convection and diffusion coinciding with rate-limited deposition (case 1.3). The enhanced diffusion models result in almost instantaneous arrival of platelets at the wall, even at the outlet of the channel (≪1 s), which would result in immediate deposition of platelets using the deposition model of Sorensen et al (1999a). The ECD model showed a delayed arrival of platelets (~5 s) that was more consistent with the experimental results (see figure 9). It should be noted that some of the delay may also be due to micro and molecular scale events governing platelet adhesion, such as a cell-surface interaction and the formation of adhesion bounds. The flux of platelets to the wall is clearly driven by lateral transport since the near-wall concentration starts to increase at 5 s, as compared to 28.5 s for convection alone.
The actual form and parameters of the diffusivity function are still uncertain, and are crucial for the spatial and temporal development of platelet profiles, hence deposition of cells onto walls. The numerical experiments coupling passively enhanced diffusivities with the active transport showed that the true RBC-enhanced diffusivity for platelets is of the same order as the Brownian diffusion, as compared to the ED models (e.g. ZC and anisotropic diffusion) that predict the increase of diffusivity by three orders of magnitude. Consequently, these models were unable to maintain a near-wall excess. Even the stream-wise diffusivity, one order higher, prevented the formation of a platelet excess.
Previous diffusivity models were calibrated to experimental data using average values of hematocrit andwall shear rate. This study showed the critical importance of a spatially variable hematocrit field on the performance of enhanced diffusivity models, whether coupled with ECD or not. This was illustrated in case 1.1, for example, in which the stream-wise diffusion model in combination with the ECD model produced a platelet profile within 1.5% of the experimentally reported profile. The same model with a uniform hematocrit field resulted in over ten times the loss.
While diffusivity is one important factor in the development of the platelet-rich boundary layer, this study ignored the development of the RBC profile over time and space. In all experiments, it was assumed that the RBC profiles were fully developed. In case 1.2, for example, the RBC profile would likewise develop over time. Due to the assumption of a fully developed profile, it took more time to develop to steady state using the blunt hematocrit profile than the parabolic one. This was due to the low value of hematocrit and hematocrit gradient at the wall. A temporally developing hematocrit profile would start with a sharp gradient near wall and slight cellular depletion near the wall which would expand over time. This caused increased platelet transport as compared to the steady-state hematocrit profile. A related factor due to RBC migration that is not taken into account by the ECD model was the motion of plasma contrary to the RBCs. This counter-flux would increase the rate of margination as the RBC profile develops (Kao 2000). This is tantamount to the addition of an unsteady term in the function for diffusion. It is uncertain how the absence of these terms would affect the over-all results.
In general, the parameter ψ1, assumed constant in these studies, could be a function of shear rate, time, fibrinogen concentration, RBC shape and RBC deformability. The later three factors would depend on the experimental condition of the blood which may vary significantly from sample to sample. Indeed, Goldsmith and Spain (1984) indicated that RBC aggregation during low shear flow resulted in an enhanced ‘cell-free layer’. This implies that the parameter should also be treated as a function of RBC aggregation, which in turn is dependent on the above factors. This is indicative of the challenges associated with identifying a universal form for the parameter ψ1.
The current model predicted a monotonically increasing radial concentration of platelets toward the wall in tubes. This is consistent with the observation of Aarts et al (1988) However, the experiments of Eckstein et al has shown an unimodal platelet profile, in which the peak concentration is displaced a small distance from the wall, and an attenuation of platelet concentration develops adjacent to the wall (Eckstein and Belgacem 1991, Waters and Eckstein 1990). In the absence of RBCs, Aarts et al showed an inward migration of platelets. In both circumstances, the transport of cells away from the wall is due to the variation in collision frequency caused by the gradient in the shear rate, which was not included in the ECD model. These kinetics could however be included through an additional flux term (Phillips et al 1992) having the form
| (23) |
where Kc is a constant of order 1, a is the radius of the platelets, Vplt is the volume per platelet and γ̇ is the shear rate.
The ECD model was able to predict the outward migration of WBC under high shear conditions, in good agreement with experimental observations. However, at low shear rates, inward migration of WBCs has also been observed. In the context of the ECD model, this would imply migration against the RBC concentration gradient, and hence a negative value of ψ1. This is possible mathematically but the model is counter-intuitive and evades physical interpretation.
The ultimate application of the ECD model, or any platelet transport model, is its ability to predict platelet transport in flows of arbitrary geometries. The current model is limited in this regard inasmuch as the hematocrit profiles and coefficients of the diffusion have been prescribed based on experiments in parallel plates. Therefore to be fully independent of empiricism, future extrapolation of the ECD model would require coupling with a model of blood flow capable of accurately predicting the hematocrit field, and recalibration of the generalized diffusivity function, i.e. that proposed by Zydney and Colton (equation (15)), using spatially dependent hematocrit and shear rate.
6. Conclusion
The ECD model, developed herein, was able to accurately model the exclusion of WBC and platelets toward the wall as observed in whole blood flowing in channels and tubes. Despite its simplicity, the model matched previously reported experimental data for platelets (Aarts et al 1988) and WBCs (Goldsmith and Spain 1984) in tubes and for platelets in rectangular channels (Wagner and Hubbell 1990) without requiring a priori knowledge of the final platelet distribution. By treating the cellular species as a dilute suspension, it is therefore possible to model the behavior of whole blood in large geometries, which would be valuable for design of blood-wetted devices and the study of hemodynamics in the vasculature.
Appendix. The continuum assumption
The continuum assumption was analyzed to confirm that the cellular concentrations were sufficiently small that they cannot be treated as a continuum in the classical sense. Normally, the fluid–continuum assumption is determined from the mean free path (MFP) and thermal kinetic energy (TKE). The MFP is the average distance that a particle of a particular species travels before colliding with another particle of the same species. The TKE relates to diffusivity and Brownian motion but also governs the time between interactions or frequency of collisions. The TKE of large particles is treated as zero; therefore, the MFP must also be small.
Stickel et al proposed a method for calculating MFP for dilute and compact particles’ suspensions using purely geometric considerations and rigid spheres as a model particle (Stickel et al 2006, 2007). The MFP for a perfectly dilute suspension of particles is
| (A.1) |
where a is the particle radius and ϕ is the volume fraction. This formulation assumes that a is much less than the MFP. The MFP of densely packed cells is given by the equation:
| (A.2) |
which results in a MFP of zero for particles that are optimally packed.
RBCs were modeled as disks, platelets as oblate spheroids and WBC as spheres for the sake of determining the optimal packing fraction. The optimal packing fraction for a geometrically continuous bed of particles was determined from the relationship
| (A.3) |
where Vcellular is the volume within the total volume taken up by cells and Vtotal is the overall volume. Since RBCs change shape, they can only achieve a simple rectangular packing structure as disks in unstressed flow and it is assumed that they attain a body center cubic structure when forming ellipsoids under stress. The optimal packing for WBCs and platelets was considered body center cubic. The resulting optimal packing fractions for RBCs, platelets and WBC are 0.78, 0.60, and 0.52, respectively.
Using average volume fraction values for blood, ϕ = 0.4 for RBCs and 0.01 for both platelets and WBCs, yields a compact MFP of 1.01, 36.1 and 196 µm and a dilute MFP of 2.01, 36.7 and 200 for RBC, platelets and WBCs, respectively. The MFP for the platelets is therefore an order of magnitude greater than that of the RBCs, while the MFP for WBCs is two orders higher. In other words, the WBCs and platelets travel approximately 16 diameters, respectively, before interacting with another cell of that species, while RBCs collide without having to travel a full cell radius. The MFP for platelets and WBCs are within 2% of the idealized dilute suspension. The MFP for the RBC phase is half that of the ideally dilute suspension. Therefore, platelets and WBC should be treated as a dilute species.
Contributor Information
S J Hund, Email: shund@andrew.cmu.edu.
J F Antaki, Email: antaki@andrew.cmu.edu.
References
- Aarts PA, Van Den Broek SA, Prins GW, Kuiken GD, Sixma JJ, Heethaar RM. Blood platelets are concentrated near the wall and red blood cells, in the center in flowing blood. Arteriosclerosis. 1988;8:819–824. doi: 10.1161/01.atv.8.6.819. [DOI] [PubMed] [Google Scholar]
- Adams GA, Feuerstein IA. Maximum fluid concentrations of materials released from platelets at a surface. Am. J. Physiol. 1983;244:H109–H114. doi: 10.1152/ajpheart.1983.244.1.H109. [DOI] [PubMed] [Google Scholar]
- Bernsdorf J, Harrison SE, Smith SM, Lawford PV, Hose DR. Concurrent numerical simulation of flow and blood clotting using the lattice Boltzmann technique. Int. J. Bioinform. Res. Appl. 2006;2:371–380. doi: 10.1504/IJBRA.2006.011036. [DOI] [PubMed] [Google Scholar]
- Boyd J, Buick J, Cosgrove JA, Stansell P. Application of the lattice Boltzmann model to simulated stenosis growth in a two-dimensional carotid artery. Phys. Med. Biol. 2005;50:4783–4796. doi: 10.1088/0031-9155/50/20/003. [DOI] [PubMed] [Google Scholar]
- Buchanan JR, Jr, Kleinstreuer C. Simulation of particle-hemodynamics in a partially occluded artery segment with implications to the initiation of microemboli and secondary stenoses. J. Biomech. Eng. 1998;120:446–454. doi: 10.1115/1.2798013. [DOI] [PubMed] [Google Scholar]
- Caiazzo A, Junk M. Boundary forces in lattice Boltzmann: analysis of momentum exchange algorithm. Comput. Math. Appl. 2008;55:1415–1423. [Google Scholar]
- Chervu A, Moore WS. An overview of intimal hyperplasia. Surg. Gynecol. Obstet. 1990;171:433–447. [PubMed] [Google Scholar]
- Dupin MM, Halliday I, Care CM. A multi-component lattice Boltzmann scheme: towards the mesoscale simulation of blood flow. Med. Eng. Phys. 2006;28:13–18. doi: 10.1016/j.medengphy.2005.04.015. [DOI] [PubMed] [Google Scholar]
- Eckstein EC, Belgacem F. Model of platelet transport in flowing blood with drift and diffusion terms. Biophys. J. 1991;60:53–69. doi: 10.1016/S0006-3495(91)82030-6. [DOI] [PMC free article] [PubMed] [Google Scholar]
- Eckstein EC, Koleski JF, Waters CM. Concentration profiles of 1 and 2.5 microns beads during blood flow. Hematocrit effects. ASAIO Trans. 1989;35:188–190. [PubMed] [Google Scholar]
- Fogelson AL, Guy RD. Platelet-wall interactions in continuum models of platelet thrombosis: formulation and numerical solution. Math. Med. Biol. 2004;21:293–334. doi: 10.1093/imammb21.4.293. [DOI] [PubMed] [Google Scholar]
- Folie BJ, Mcintire LV. Mathematical analysis of mural thrombogenesis. Concentration profiles of platelet-activating agents and effects of viscous shear flow. Biophys. J. 1989;56:1121–1141. doi: 10.1016/S0006-3495(89)82760-2. [DOI] [PMC free article] [PubMed] [Google Scholar]
- Gabbanelli S, Drazer G, Koplik J. Lattice Boltzmann method for non-Newtonian (power-law) fluids. Phys. Rev. E. 2005;72:046312. doi: 10.1103/PhysRevE.72.046312. [DOI] [PubMed] [Google Scholar]
- Goldsmith HL, Marlow JC. Flow behavior of erythrocytes: 2. Particle motions in concentrated suspensions of ghost cells. J. Colloid Interface Sci. 1979;71:383–407. [Google Scholar]
- Goldsmith HL, Spain S. Radial distribution of white cells in tube flow. In: Mieiselman HJ, Lichtman MA, Lacelle PL, editors. White Cell Mechanics: Basic Science and Clinical Aspects. New York: Alan R. Liss, Inc.; 1984. [Google Scholar]
- Guo Z, Zhao TS, Shi Y. Preconditioned lattice-Boltzmann method for steady flows. Phys. Rev. E. 2004;70:066706. doi: 10.1103/PhysRevE.70.066706. [DOI] [PubMed] [Google Scholar]
- Guy RD, Fogelson AL. Probabilistic modeling of platelet aggregation: effects of activation time and receptor occupancy. J. Theor. Biol. 2002;219:33–53. [PubMed] [Google Scholar]
- Harting J, Chin J, Venturoli M, Coveney PV. Large-scale lattice Boltzmann simulations of complex fluids: advances through the advent of computational grids. Phil. Trans. R. Soc. A. 2005;363:1895–1915. doi: 10.1098/rsta.2005.1618. [DOI] [PubMed] [Google Scholar]
- Hazi G. Accuracy of the lattice Boltzmann method based on analytical solutions. Phys. Rev. E. 2003;67:056705. doi: 10.1103/PhysRevE.67.056705. [DOI] [PubMed] [Google Scholar]
- Hofer M, Perktold K. Computer simulation of concentrated fluid-particle suspension flows in axisymmetric geometries. Biorheology. 1997;34:261–279. doi: 10.1016/S0006-355X(98)00004-3. [DOI] [PubMed] [Google Scholar]
- Hubbell JA, Mcintire LV. Visualization and analysis of mural thrombogenesis on collagen, polyurethane and nylon. Biomaterials. 1986;7:354–363. doi: 10.1016/0142-9612(86)90006-2. [DOI] [PubMed] [Google Scholar]
- Hyun S, Kleinstreuer C, Longest PW, Chen C. Particle-hemodynamics simulations and design options for surgical reconstruction of diseased carotid artery bifurcations. J. Biomech. Eng. 2004;126:188–195. doi: 10.1115/1.1688777. [DOI] [PubMed] [Google Scholar]
- Jordan A, David T, Homer-Vanniasinkam S, Graham A, Walker P. The effects of margination and red cell augmented platelet diffusivity on platelet adhesion in complex flow. Biorheology. 2004;41:641–653. [PubMed] [Google Scholar]
- Jung J, Hassanein A. Three-phase CFD analytical modeling of blood flow. Med. Eng. Phys. 2008;30:91–103. doi: 10.1016/j.medengphy.2006.12.004. [DOI] [PubMed] [Google Scholar]
- Jung J, Hassanein A, Lyczkowski RW. Hemodynamic computation using multiphase flow dynamics in a right coronary artery. Ann. Biomed. Eng. 2006a;34:393–407. doi: 10.1007/s10439-005-9017-0. [DOI] [PubMed] [Google Scholar]
- Jung J, Lyczkowski RW, Panchal CB, Hassanein A. Multiphase hemodynamic simulation of pulsatile flow in a coronary artery. J. Biomech. 2006b;39:2064–2073. doi: 10.1016/j.jbiomech.2005.06.023. [DOI] [PubMed] [Google Scholar]
- Kao PH, Yang RJ. An investigation into curved and moving boundary treatments in the lattice Boltzmann method. J. Comput. Phys. 2008;227:5671–5690. [Google Scholar]
- Kao SH. Platelet Transport and Surface Reactions in Mural Thrombosis. Houston, TX: Rice University; 2000. [Google Scholar]
- Karner G, Perktold K. The influence of flow on the concentration of platelet active substances in the vicinity of mural microthrombi. Comput. Methods Biomech. Biomed. Eng. 1998;1:285–301. doi: 10.1080/01495739808936708. [DOI] [PubMed] [Google Scholar]
- Keller KH. Effect of fluid shear on mass transport in flowing blood. Fed. Proc. 1971;30:1591–1599. [PubMed] [Google Scholar]
- Kim SH, Pitsch H. Analytic solution for a higher-order lattice Boltzmann method: slip velocity and Knudsen layer. Phys. Rev. E. 2008;78:016702. doi: 10.1103/PhysRevE.78.016702. [DOI] [PubMed] [Google Scholar]
- Kuharsky AL, Fogelson AL. Surface-mediated control of blood coagulation: the role of binding site densities and platelet deposition. Biophys. J. 2001;80:1050–1074. doi: 10.1016/S0006-3495(01)76085-7. [DOI] [PMC free article] [PubMed] [Google Scholar]
- Latt J, Chopard B, Malaspinas O, Deville M, Michler A. Straight velocity boundaries in the lattice Boltzmann method. Phys. Rev. E. 2008;77:056703. doi: 10.1103/PhysRevE.77.056703. [DOI] [PubMed] [Google Scholar]
- Leonard EF, Grabowski EF, Turitto VT. The role of convection and diffusion on platelet adhesion and aggregation. Ann. NY Acad. Sci. 1972;201:329–342. doi: 10.1111/j.1749-6632.1972.tb16309.x. [DOI] [PubMed] [Google Scholar]
- Longest PW, Kleinstreuer C. Computational haemodynamics analysis and comparison study of arterio-venous grafts. J. Med. Eng. Technol. 2000;24:102–110. doi: 10.1080/03091900050135013. [DOI] [PubMed] [Google Scholar]
- Longest PW, Kleinstreuer C. Numerical simulation of wall shear stress conditions and platelet localization in realistic end-to-side arterial anastomoses. J. Biomech. Eng. 2003a;125:671–681. doi: 10.1115/1.1613298. [DOI] [PubMed] [Google Scholar]
- Longest PW, Kleinstreuer C. Particle-hemodynamics modeling of the distal end-to-side femoral bypass: effects of graft caliber and graft-end cut. Med. Eng. Phys. 2003b;25:843–858. doi: 10.1016/s1350-4533(03)00124-3. [DOI] [PubMed] [Google Scholar]
- Longest PW, Kleinstreuer C, Andreotti PJ. Computational analyses and design improvements of graft-to-vein anastomoses. Crit. Rev. Biomed. Eng. 2000;28:141–147. doi: 10.1615/critrevbiomedeng.v28.i12.240. [DOI] [PubMed] [Google Scholar]
- Longest PW, Kleinstreuer C, Archie JP., Jr Particle hemodynamics analysis of Miller cuff arterial anastomosis. J. Vasc. Surg. 2003a;38:1353–1362. doi: 10.1016/s0741-5214(03)00950-9. [DOI] [PubMed] [Google Scholar]
- Longest PW, Kleinstreuer C, Deanda A. Numerical simulation of wall shear stress and particle-based hemodynamic parameters in pre-cuffed and streamlined end-to-side anastomoses. Ann. Biomed. Eng. 2005;33:1752–1766. doi: 10.1007/s10439-005-7784-2. [DOI] [PubMed] [Google Scholar]
- Longest PW, Kleinstreuer C, Truskey GA, Buchanan JR. Relation between near-wall residence times of monocytes and early lesion growth in the rabbit aorto-celiac junction. Ann. Biomed. Eng. 2003b;31:53–64. doi: 10.1114/1.1531635. [DOI] [PubMed] [Google Scholar]
- Malvern LE. Introduction to the Mechanics of a Continuous Medium. Englewood Cliffs, NJ: Prentice-Hall; 1969. [Google Scholar]
- Massoudi M, Antaki JF. An anisotropic constitutive equation for the stress tensor of blood based on mixture theory. Math. Prob. Eng. 2008;2008:1–31. [Google Scholar]
- Mickelson JK, Lakkis NM, Villarreal-Levy G, Hughes BJ, Smith CW. Leukocyte activation with platelet adhesion after coronary angioplasty: a mechanism for recurrent disease. J. Am. Coll. Cardiol. 1996;28:345–353. doi: 10.1016/0735-1097(96)00164-7. [DOI] [PubMed] [Google Scholar]
- Motulsky H, Christopoulos A. Fitting Models to Biological Data Using Linear and Nonlinear Regression: A Practical Guide to Curve Fitting. Oxford: Oxford University Press; 2004. [Google Scholar]
- Nguyen NQ, Ladd AJ. Lubrication corrections for lattice-Boltzmann simulations of particle suspensions. Phys. Rev. E. 2002;66:046708. doi: 10.1103/PhysRevE.66.046708. [DOI] [PubMed] [Google Scholar]
- Phillips RJ, Armstrong RC, Brown RA, Graham AL, Abbott JR. A constitutive equation for concentrated suspensions that accounts for shear-induced particle migration. Phys. Fluids A. 1992;4:30–40. [Google Scholar]
- Pope SB. Turbulent Flows. New York: Cambridge University Press; 2000. [Google Scholar]
- Premnath KN, Abraham J. Lattice Boltzmann model for axisymmetric multiphase flows. Phys. Rev. E. 2005;71:056706. doi: 10.1103/PhysRevE.71.056706. [DOI] [PubMed] [Google Scholar]
- Richardson PD. Rheological factors in platelet—vessel wall interactions. Phil. Trans. R. Soc. B. 1981;294:251–266. doi: 10.1098/rstb.1981.0104. [DOI] [PubMed] [Google Scholar]
- Rohde M, Derksen JJ, Akker HEAVD. An applicability study of advanced lattice-Boltzmann techniques for moving, no-slip boundaries and local grid refinement. Comput. Fluids. 2008;37:1238–1252. [Google Scholar]
- Ross R. Atherosclerosis—an inflammatory disease. N. Engl. J. Med. 1999;340:115–126. doi: 10.1056/NEJM199901143400207. [DOI] [PubMed] [Google Scholar]
- Sequeira A, Janela J. An overview of some mathematical models of blood rheology. In: Pereira MS, editor. A Portrait of State-of-the-Art Research at the Technical University of Lisbon. Lisbon, Portugal: Springer; 2007. [Google Scholar]
- Siebert DN, Hegele LA, Jr, Philippi PC. Lattice Boltzmann equation linear stability analysis: thermal and athermal models. Phys. Rev. E. 2008;77:026707. doi: 10.1103/PhysRevE.77.026707. [DOI] [PubMed] [Google Scholar]
- Slack SM, Turitto VT. Flow chambers and their standardization for use in studies of thrombosis—on behalf of the subcommittee on rheology (Sakariassen, K., Chairman) of the scientific and standardization committee of the isth. Thromb. Haemost. 1994;72:777–781. [PubMed] [Google Scholar]
- Sorensen EN, Burgreen GW, Wagner WR, Antaki JF. Computational simulation of platelet deposition and activation: I. Model development and properties. Ann. Biomed. Eng. 1999a;27:436–448. doi: 10.1114/1.200. [DOI] [PubMed] [Google Scholar]
- Sorensen EN, Burgreen GW, Wagner WR, Antaki JF. Computational simulation of platelet deposition and activation: II. Results for Poiseuille flow over collagen. Ann. Biomed. Eng. 1999b;27:449–458. doi: 10.1114/1.201. [DOI] [PubMed] [Google Scholar]
- Sorensen EN, Burgreen GW, Wagner WR, Antaki JF. Simulation of platelet deposition in disturbed flow. Second Joint EMBS/BMES Conf.; Housten, TX, USA: IEEE; 2002. [Google Scholar]
- Stickel JJ, Phillips RJ, Powell RL. A constitutive model for microstructure and total stress in particulate suspensions. J. Rheol. 2006;50:379–413. [Google Scholar]
- Stickel JJ, Phillips RJ, Powell RL. Application of a constitutive model for particulate suspensions: time-dependent viscometric flows. J. Rheol. 2007;51:1271–1302. [Google Scholar]
- Sun C, Migliorini C, Munn LL. Red blood cells initiate leukocyte rolling in postcapillary expansions: a lattice Boltzmann analysis. Biophys. J. 2003;85:208–222. doi: 10.1016/S0006-3495(03)74467-1. [DOI] [PMC free article] [PubMed] [Google Scholar]
- Sun C, Munn LL. Particulate nature of blood determines macroscopic rheology: a 2-D lattice Boltzmann analysis. Biophys. J. 2005;88:1635–1645. doi: 10.1529/biophysj.104.051151. [DOI] [PMC free article] [PubMed] [Google Scholar]
- Wagner WR. Chemical Engineering. Austin: University of Texas; 1991. Biochemical and biophysical mechanisms of mural thrombosis on natural surfaces. [Google Scholar]
- Wagner WR, Hubbell JA. Local thrombin synthesis and fibrin formation in an in vitro thrombosis model result in platelet recruitment and thrombus stabilization on collagen in heparinized blood. J. Lab. Clin. Med. 1990;116:636–650. [PubMed] [Google Scholar]
- Waters CM, Eckstein EC. Concentration profiles of platelet-sized latex beads for conditions relevant to hollow-fiber hemodialyzers. Artif. Organs. 1990;14:7–13. doi: 10.1111/j.1525-1594.1990.tb01586.x. [DOI] [PubMed] [Google Scholar]
- Wootton DM, Markou CP, Hanson SR, Ku DN. A mechanistic model of acute platelet accumulation in thrombogenic stenoses. Ann. Biomed. Eng. 2001;29:321–329. doi: 10.1114/1.1359449. [DOI] [PubMed] [Google Scholar]
- Zhao R, Antaki JF, Naik T, Bachman TN, Kameneva MV, Wu ZJ. Microscopic investigation of erythrocyte deformation dynamics. Biorheology. 2006;43:747–765. [PubMed] [Google Scholar]
- Zydney AL, Colton CK. Augmented solute transport in the shear-flow of a concentrated suspension. Physicochem. Hydrodyn. 1988;10:77–96. [Google Scholar]


