Abstract
Single Nucleotide Polymorphisms (SNPs) are the most common genetic variation in the human genome. Kinetic methods based on branch migration have proved successful for detecting SNPs because a mispair inhibits the progress of branch migration in the direction of the mispair. We have combined the effectiveness of kinetic methods with AFM of DNA origami patterns to produce a direct visual readout of the target nucleotide contained in the probe sequence. The origami contains graphical representations of the four nucleotide alphabetic characters, A, T, G and C, and the symbol containing the test nucleotide identity vanishes in the presence of the probe. The system also works with pairs of probes, corresponding to heterozygous diploid genomes.
Keywords: Single Nucleotide Polymorphism Detection, DNA Origami, Direct Readout of SNPs, DNA branch migration, Atomic Force Microscopy, Photo-Cleavable Linkers
Single Nucleotide Polymorphisms (SNPs) are the most common genetic variation in the human genome.1-2 A variety of methods exist for their detection exploiting the free-energy advantage of Watson-Crick paired nucleotides over mispairs, or they involve the use of enzymes that extend a primer to include the site of interest, resulting in a species with identifiable characteristics.3 Kinetic methods based on branch migration have proved successful for detecting SNPs because a mispair will inhibit the progress of branch migration in the direction of the mispair.4,5 Biased single-stranded branch migration is used prominently for changing the shapes of DNA nanomachines, because it involves the isothermal removal of strands from a DNA machine frame, enabling a change in topology.6 The unidirectional character of strand removal is based on the notion of a ‘toehold’,7 wherein one end of a strand to be removed is extended a few nucleotides beyond its pairing partner; when the full complement of the strand (including the toehold) is added to solution, it pairs with the toehold and then removes the strand by single-stranded branch migration in the direction away from the toehold.
Here, we have combined the effectiveness of this approach4 with atomic force microscopy (AFM) of DNA origami patterns8-10 to produce a direct visual readout of the target nucleotide contained in the probe sequence. The origami contains graphical representations of the four possible nucleotide alphabetic characters, A, T, G and C, and the symbol containing the test nucleotide identity vanishes in the presence of the probe. Computer processing of a statistically significant group of images produces a direct symbolic readout that directly identifies the nucleotide carried by the probe. The system also works with pairs of probes, corresponding to heterozygous diploid genomes.
Figure 1 illustrates a solution analog of the kinetic system that is the basis for our method.11 One strand of a perfectly matched duplex contains a toehold on one end, and a fluorescence quencher on the other end. Opposite the fluorescence quencher is a fluorescent dye. If a perfectly matched probe, including the toehold, is added to the solution, it will displace the strand containing the dye, and a fluorescent signal will result (right side of Figure 1). However, if the probe contains one or more mismatched nucleotides, branch migration will not surmount that barrier, and there will be no fluorescent signal (left side of Figure 1). A key feature of the system is that it operates isothermally, so that the progression of branch migration, although stochastic, is ultimately unidirectional, from the toehold toward the dyes. Thus, the barrier to branch migration is designed to depend on the local homology of the two strands, and not on small relative differences between the free energies of hybridization of two oligonucleotides.11,12
Figure 1. Schematic Representation of the Branch-Migration-Based Mismatch Detection Probe Technique.
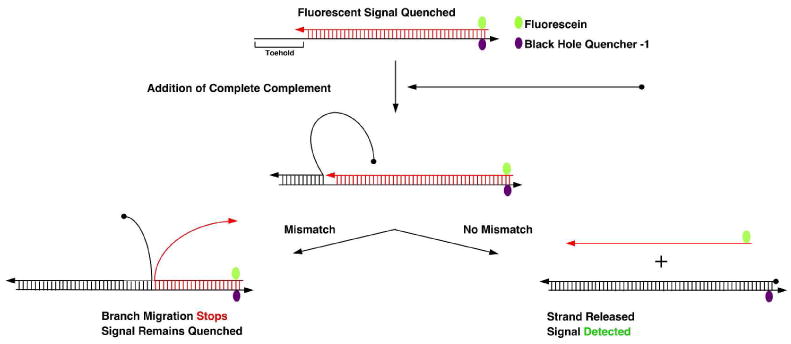
The top part of the scheme shows duplex DNA consisting of two strands, a red strand containing Fluorescein (Green) dye at 5′-end, and a black strand with Black Hole Quencher-1 (Purple) at its 3′-end and an 8-nucleotide ‘toehold’ overhang on its 5′-end. Arrowheads represent the 3′ ends of strands. The first step is the addition of the complete complement strand to the black strand, whose 5′ end is represented by a black dot. When it is added to the system, it binds to the 8-nucleotide overhang region and branch migration initiates; an intermediate showing binding only to the toehold is shown at the central part of the figure. If the strand is fully complementary to the black strand, migration will proceed stochastically all the way to the end of the black strand, removing red strand completely (right branch); if this occurs, the fluorescein and BHQ-1 will be separated, and the fluorescent signal from the fluorescein will no longer be quenched. However, if there is even a single mismatch present in the completely complementary strand, branch migration away from the toehold will not proceed further (left branch), leading to the continued existence of the quenched state.
Our goal here is to incorporate the strengths of this system into a DNA origami-based procedure, so as to produce readout that directly identifies the nucleotide in the probe molecule. We have done this by patterning the four possible nucleotide characters on the surface of a DNA origami tile; their sites are illustrated in Figure 2. Each of the visible characters, A, T, G and C, consists of a series of removable strands that protrude from the surface. The presence of A (12 red components in the upper-left), T (8 green components in the upper-right), G (13 blue components in the lower left) and C (9 magenta components in the lower right) are evident in the schematic drawing. However, the strands that protrude differ from each other, depending on whether they are part of the A-character, the G-character, the T-character or the C-character.
Figure 2. A Schematic Drawing of the DNA Origami Tile Used Here.
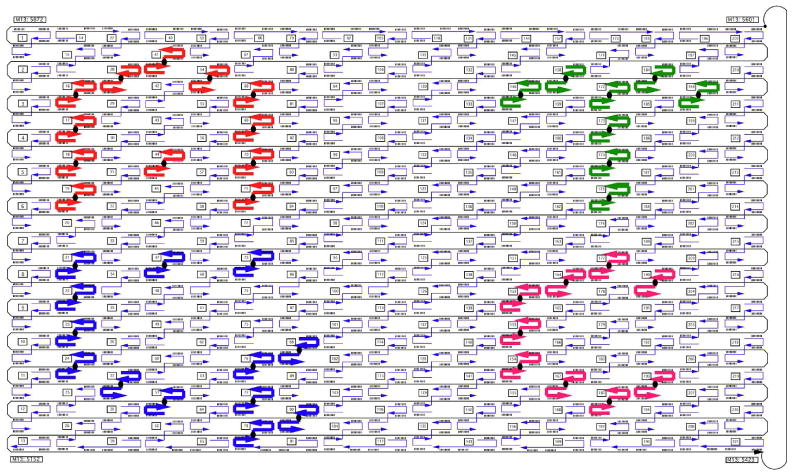
The M13 viral strand of the origami is drawn in black, and the staple strands only present for the structure are drawn in light blue, with thin lines. Those staple strands involved in producing the letters are drawn with thicker lines, A components in red, T components in green, G components in bright blue, and C components in magenta.
The details of the symbols highlighted in Figure 2 are shown in Figure 3. Panels 3a through 3d show in green the origami staple strands that are added to the four regions: A G-containing strand (removed by a C-containing complement) is shown in Figure 3a, a C-containing strand (removed by a G-containing complement) is shown in Figure 3b, a T-containing strand (removed by an A-containing complement) is shown in Figure 3c and an A-containing strand (removed by a T-containing complement) is shown in Figure 3d. These are the strands that produce the signals visible on the origami surface. Each strand is held tightly to the origami surface by hybridization with the M13 origami strand in a portion on its 5′ end.
Figure 3. The Detailed Structures of the Signal-Generating Strands.
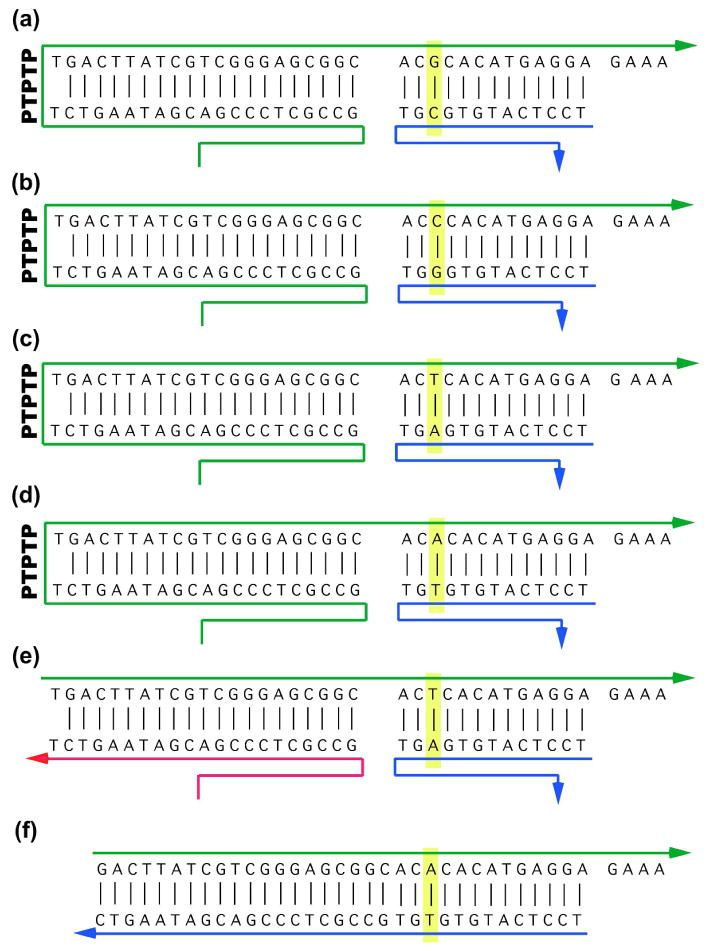
Panels (a)-(d) show the structures of the four different signal-generating strands when they are inserted into the origami. Arrowheads represent the 3′ ends of the strands. The target nucleotide pair is outlined in yellow, spanning the blue and green strands. The green strands contain a PTPTP unit on the left, where the ‘P’ represents a photo-cleavable linker. The 5′ end of the green strands is tightly hydrogen bonded to the M13 origami strand, as are the 3′ ends of the blue strands. Upon UV irradiation, the photo-cleavable linker is cut, leaving an arrangement such as the one shown in panel (e). Note that a 4-nucleotide toehold remains on the green strand. Panel (f) shows the structure of the competitive inhibitor used to equalize the displacement of the T symbol with the others.
Each of the strands is seen to form a hairpin on the left through a segment labeled PTPTP. Each ‘P’ in this segment represents a photo-cleavable linker (Glen Research, Sterling, VA) that breaks upon irradiation with UV light (the ‘T’ represents a thymidine nucleotide). Thus, the signal-producing component is reliably bound to the origami upon initial assembly, but may then be freed, so as to be released by the probe strand; the arrangement in Figure 3e shows the T-containing strand following scission of the photo-cleavable portion. The magenta portion is still attached to the origami, but the green part can be removed by adding its complement, including the complement to the GAAA toehold; in the case of the strand shown in Figure 3e, the complement would contain an A at the key position. It is important that all letters be invaded at the same rate. We found that T was being invaded somewhat more quickly under our conditions, so we added a competitive inhibitor (Figure 3f) to the solution so as to slow it down.
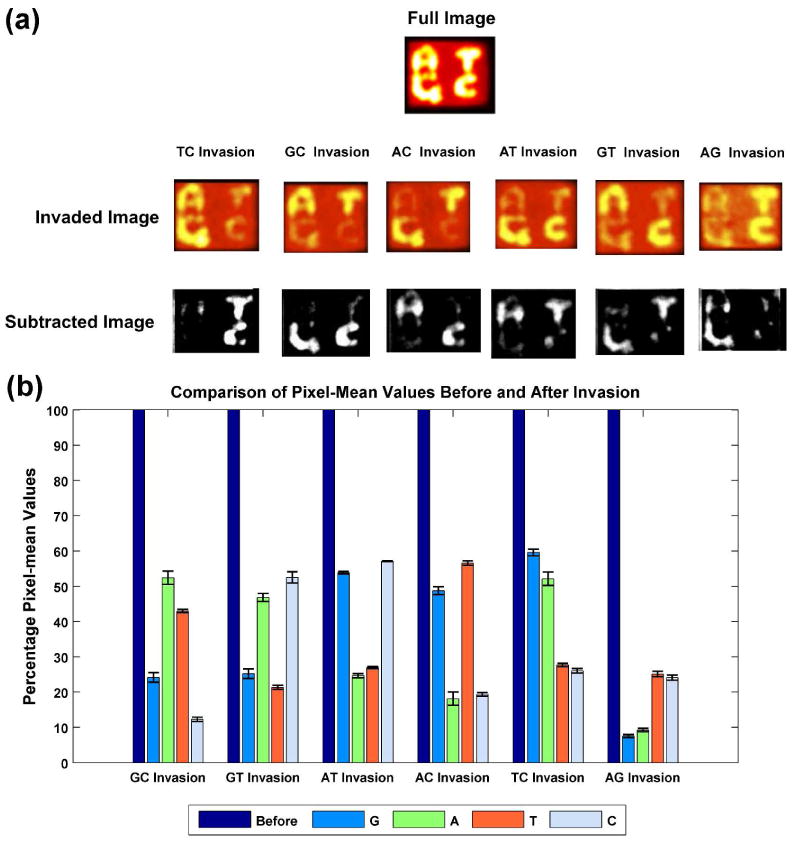
We find the method we have developed to be quite effective. We have written a computer program named PADO (Pattern Aligner for DNA Origami)13 to process an adequate number of images to give a reliable result. Figure 4a shows the images containing the results of averaging the results of 25 origami tiles invaded with each of the possible probes. The program does the superposition of the tiles, once their outlines are delineated. The left of Figure 4a shows an image that has not been invaded. The column to its right shows the averages of 25 images that have been invaded, with the key invading nucleotide indicated over the arrow. In each case, comparison of the ‘invaded image’ with the ‘full image’ clearly identifies the nucleotide that was eliminated. It is also easy to have the program apply a subtraction procedure to emphasize the image of the eliminated nucleotide, so one can tell readily which base is contained within the SNP.
Figure 4.
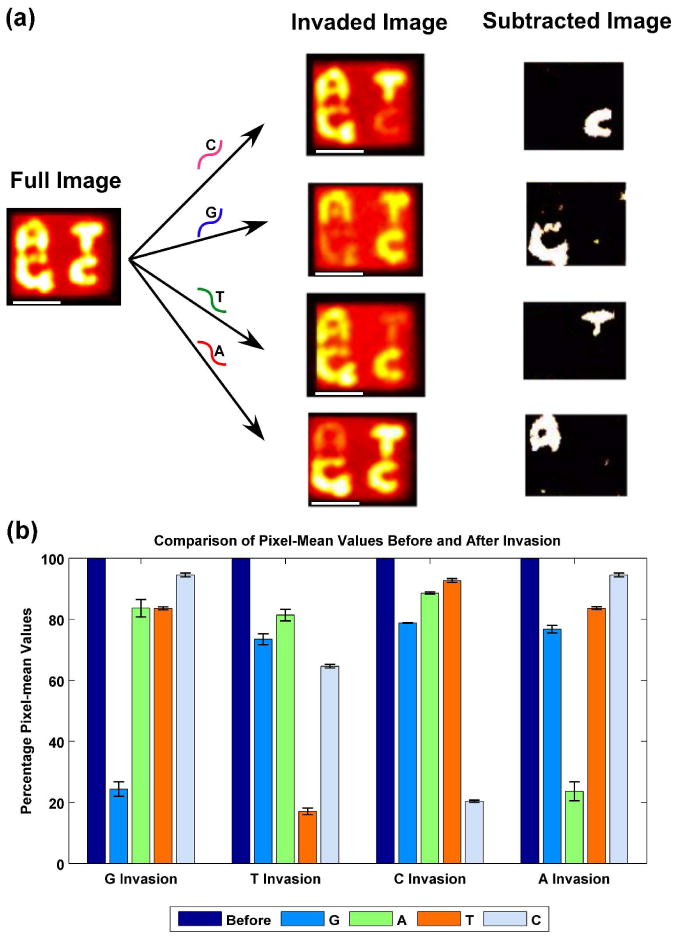
(a) Operation of the System. The ‘Full Image’ shown at the left of the panel shows an AFM image of the DNA origami tile before any invasion has taken place; 25 separate images are averaged. The four ‘Invaded Image’ rectangles correspond to the averaging of 25 separate AFM images, and the identity of the key nucleotide in the invasive strand is indicated over the arrow. The white scale bars represent a distance of 50 nm. It is clear from these images that the correct letter has been removed in each case. The ‘Subtracted Image’ on the right highlights the identity of the nucleotide. (b) Robustness of the Assay For each character, normalized to 100%, the mean value of the sum of the pixels around the letters are shown for invasion by the target nucleotide and for the others. Error bars are indicated for each of the measurements. In each case, the average of the pixel intensities is about 20-25% for the target nucleotide, and ranges from >60% to >90% for the other nucleotides.
Figure 4b quantitates the capabilities of this approach, particularly the lack of cross-talk. The mean pixel values of the signal are shown for each possible answer character in a variety of invasion experiments, all normalized to 100% for pre-invasion (dark blue). The average is taken over 25 images in each case. In no case is the target nucleotide present in greater than 25% of the pre-invasion state. The worst case of crosstalk is ‘C’ in the case of a ‘T’ invasion, and this is still better than 60% of the pre-invasion state.
We have explored the case when a heterozygous probe is used, as may well be the case in a diploid organism. Figure 5a shows that the six possible heterozygous systems clearly show the results of the double invasion, once the software has been applied. Figure 5b shows the analogous chart to Figure 4b, now considering the double invasion with two different probe molecules. Although the statistics are less dramatic than in the single-invasion case, the results are still clear-cut.
Figure 5. Double Invasion.
(a) Operation of the Double Invasion System. The conventions of Figure 4a apply to the case of double invasion, which might occur in a heterozygous diploid organism. (b) Statistics for Double Invasion. The results are less dramatic than in Figure 4b, but are nevertheless quite clear-cut. The conventions of Figure 4b apply.
We have developed a reliable method to visualize the target nucleotide symbol in a SNP assay. The kinetic method appears to be very effective, and the results are very clear-cut when combined with the visual approach made possible by combining the approach with AFM of DNA origami. The unambiguous nature of the AFM results suggests that it would be possible to introduce this assay into clinical settings, as appears to be happening with other forms of analysis (e.g., ref. 14). The recent development15 of 2D arrays of DNA origami tiles would likely enable the formation of multiplexed SNP assays in a single sample. We note that related character readouts on DNA origami could be used for a variety of diagnostic applications.
Supplementary Material
Acknowledgments
We thank Corinna Maass for valuable discussions about the computer implementation of this system. This research has been supported by the following grants to NCS: GM-29554 from the National Institute of General Medical Sciences, CTS-0608889 and CCF-0726378 from the National Science Foundation, 48681-EL and W911NF-07-1-0439 from the Army Research Office, N000140910181 and N000140911118 from the Office of Naval Research and a grant from the W.M. Keck Foundation.
Contributor Information
Hari K. K. Subramanian, Email: hks224@nyu.edu.
Banani Chakraborty, Email: bc517@nyu.edu.
Ruojie Sha, Email: ruojie.sha@nyu.edu.
Nadrian C. Seeman, Email: ned.seeman@nyu.edu.
References
- 1.Collins FS, Brooks LD, Chakravarti A. Genome Res. 1998;8:1229–31. doi: 10.1101/gr.8.12.1229. [DOI] [PubMed] [Google Scholar]
- 2.Collins FS, Morgan M, Patrinos A. Science. 2003;300:286–90. doi: 10.1126/science.1084564. [DOI] [PubMed] [Google Scholar]
- 3.Kim S, Misra A. Ann Rev Biomed Eng. 2007;9:289–320. doi: 10.1146/annurev.bioeng.9.060906.152037. [DOI] [PubMed] [Google Scholar]
- 4.Wang SQ, Wang XH, Chen SH, Guan W. Anal Biochem. 2002;309:206–211. [Google Scholar]
- 5.Panyutin IG, Hsieh P. Proc Natl Acad Sci (U S A) 1994;91:2021–2025. doi: 10.1073/pnas.91.6.2021. [DOI] [PMC free article] [PubMed] [Google Scholar]
- 6.Seeman NC. Trends Biochem Sci. 2005;30:119–125. doi: 10.1016/j.tibs.2005.01.007. [DOI] [PMC free article] [PubMed] [Google Scholar]
- 7.Yurke B, Turberfield AJ, Mills AP, Jr, Simmel FC, Neumann JL. Nature. 2000;406:605–608. doi: 10.1038/35020524. [DOI] [PubMed] [Google Scholar]
- 8.Rothemund PWK. Nature. 2006;440:297–302. doi: 10.1038/nature04586. [DOI] [PubMed] [Google Scholar]
- 9.Ke Y, Lindsay S, Chang Y, Liu Y, Yan H. Science. 2008;319:180–183. doi: 10.1126/science.1150082. [DOI] [PubMed] [Google Scholar]
- 10.Zhang Z, Zeng D, Ma H, Feng G, Hu J, He L, Li C, Fan C. Small. 2010;6:1854–1858. doi: 10.1002/smll.201000908. [DOI] [PubMed] [Google Scholar]
- 11.Buck AH, Campbell CJ, Dickinson P, Mountford CP, Stoquert HC, Terry JG, Evans SAG, Keane LM, Su TJ, Mount AR, Walton AJ, Beattie JS, Crain J, Ghazal P. Anal Chem. 2007;79:4724–2728. doi: 10.1021/ac070251r. [DOI] [PubMed] [Google Scholar]
- 12.Chakraborty B. Ph D Thesis. New York University; 2008. [Google Scholar]
- 13.Source code can be downloaded at http://code.google.com/p/pado.
- 14.Stolz M, Gottardi R, Raiteri R, Miot S, Martin I, Imer R, Staufer U, Raducanu A, Duggelin M, Baschong W, Daniels AU, Friedrich NF, Aszodi A, Aebi U. Nature Nanotech. 2009;4:188–192. doi: 10.1038/nnano.2008.410. [DOI] [PubMed] [Google Scholar]
- 15.Liu W, Zhong H, Wang R, Seeman NC. Angew Chemie. 2011 doi: 10.1002/anie.201005911. in press. [DOI] [PMC free article] [PubMed] [Google Scholar]
- 16.Gonzalez RC, Woods RE, Eddins SL. Digital Image processing using MATLAB. 2nd. Gatesmark Publishing; 2009. pp. 681–682. [Google Scholar]
Associated Data
This section collects any data citations, data availability statements, or supplementary materials included in this article.


