

Abstract
C57BL/6J × FVB/NJ F1 (B6 × FVB) mice consume more alcohol than C57BL/6J × NZB/B1NJ F1 (B6 × NZB) mice and this high alcohol consumption is stable after abstinence whereas B6 × NZB show reduced consumption, thus providing models of Sustained Alcohol Preference (SAP) and Reduced Alcohol Preference (RAP). In female hybrids, we assessed several behavioral responses to define behaviors which might predict SAP and RAP. B6 × FVB exhibited less severe ethanol-induced conditioned taste aversion and were less sensitive to ethanol- induced loss of righting reflex than B6 × NZB. Both hybrids demonstrated ethanol-induced place preference and a low ethanol withdrawal severity. We found that these hybrids differ in their sensitivity to the aversive and sedative, but not rewarding, effects of ethanol. Results of elevated plus maze, mirror chamber, and locomotor tests reveal B6 × FVB mice are less anxious and more active than B6 × NZB mice. Results obtained offer insights about factors that determine SAP and RAP in these new genetic models of alcohol consumption.
Keywords: Alcohol preference or consumption, Hybrid, Conditioned place preference, Conditioned taste aversion, Loss of righting reflex
Introduction
Use of rodent models to imitate human disease has been a powerful tool in the advancement of understanding disease and improving treatments. There are several rodent models in place to study alcohol consumption. The extent to which a mouse will orally self-administer ethanol solutions under similar environmental conditions depends heavily on its genetic background (Belknap et al. 1993; Rodgers and McClearn 1962; Yoneyama et al. 2008). Blednov et al. (2005) discovered that F1 hybrid mice from the cross of C57BL/6J and FVB/NJ (B6 × FVB and FVB × B6) drink substantially more alcohol than either progenitor strain, and thus is the highest alcohol consuming mouse reported in the literature. Contrasting voluntary ethanol self-administration behaviors were observed when comparing two F1 hybrid mice: B6 × NZB and NZB × B6 show reduced alcohol preference (RAP) after experience with high concentrations of alcohol and abstinence, whereas B6 × FVB and FVB × B6 show sustained alcohol preference (SAP) (Blednov et al. 2010). These behavioral phenotypes offer significant opportunities for research on the motivational aspects of voluntary ethanol consumption.
A critical aspect of past work is that models of abuse (mice consuming excessive amounts ethanol) are compared with models of avoidance (mice not willing to orally self-administer ethanol). Basic research on novel behavioral and genetic models of high alcohol consumption and experience-induced changes in drinking will further our knowledge on alcohol abuse and alcoholism. RAP phenotype is novel because B6 × NZB mice initially show a high preference for ethanol solutions. Though the motivational aspect of reducing alcohol intake after experience with high ethanol concentrations and abstinence is unknown, B6 × NZB mice might be likened to moderate alcohol drinkers in that they will still consume ethanol solutions but not at their initially preferred levels due to a presumably aversive experience. Our SAP model is also novel, as B6 × FVB mice consume high levels of ethanol regardless of previous experience. To correlate how SAP and RAP relate to other phenomena in models of alcohol consumption, they can be related to an alcohol deprivation effect which describes significantly increased alcohol consumption after a period of forced abstinence. The RAP behavioral phenotype is a negative alcohol deprivation effect and the SAP behavioral phenotype is not an alcohol deprivation effect. Further exploration of ethanol-related behaviors for these hybrids offers insight into their sensitivity to the rewarding and aversive properties of ethanol.
In continuous access two bottle choice ethanol self-administration experiments, B6 × FVB mice consume more ethanol than do B6 × NZB mice, therefore motivational properties of ethanol were assessed using a locomotor sensitization paradigm followed by voluntary ethanol consumption, conditioned place preference and conditioned taste aversion behavioral paradigms, loss of righting reflex (LORR) assay, and acute withdrawal severity. Response to anxiogenic tests were used to assess innate behaviors. These new genetic models of both stable, high consumption and moderate drinking offer significant advantages to existing inbred strains and can be used to study the genetic basis of ethanol consumption.
Materials and methods
Animals
Studies were conducted using F1 hybrid female mice derived from C57BL/6J and FVB/NJ or NZB/B1NJ mice (B6 × FVB F1 and B6 × NZB F1, maternal strain × paternal strain). Since both reciprocal crosses (B6 × FVB, FVB × B6, B6 × NZB, and NZB × B6) exhibited similar drinking patterns in Blednov et al. (2010), and to reduce potentially confounding maternal care effects we chose C57BL/6J to be the maternal strain and either FVB/NJ or NZB/B1NJ to be the paternal strain. C57BL/6J, FVB/NJ, and NZB/B1NJ breeders were purchased from The Jackson Laboratory (Bar Harbor, ME) and mated at 7–8 weeks. We tested only female mice to facilitate comparison with previously collected data (Blednov et al. 2005). Mice were housed in standard cages and except where noted, food and water were available ad libitum. The vivarium was maintained on a 12:12 h light:dark cycle with lights on at 7:00 a.m. The temperature and humidity of the room were maintained at 21 ± 1°C and 40–60%, respectively. Experiments were performed during the light phase of the light/dark cycle. The illumination levels in the experimental and colony rooms were 50 footcandles. Behavioral testing began when the mice were at least 2 months of age. All behavioral experiments were performed with randomly selected female littermates derived from multiple litters; and for ethanol-related behaviors mice were assigned from within litters to ethanol and saline groups. Ethanol-naive mice were used in all ethanol-related behavioral experiments. Experiments were conducted in the isolated behavioral testing rooms in the animal facility to avoid external distractions. A solution of 3% ethanol was used to clean each testing apparatus in between subject trials. All experiments were approved by the Institutional Animal Care and Use Committee and adhered to NIH Guidelines. The University of Texas facility is Association for the Assessment and Accreditation of Laboratory Animal Care (AAALAC) accredited.
Drugs
Ethanol was obtained from Aaper (Shelbyville, KY) and was dissolved in 0.9% saline and injected intraperitoneally (i.p.) in a volume of 0.2 mL per 10 g of body weight. Control mice received a similar volume of saline.
Conditioned taste aversion
Mice were adapted to a water-restriction schedule (2 h unmeasured water access per day) over a 7 day period. At 48 h intervals over the next 12 days, all mice received 1 h measured access to a solution of saccharin (0.15% w/v sodium saccharin in tap water). Ethanol was not given after the first presentation of saccharin to allow for dissipation of possible taste neophobia before conditioning (Risinger and Cunningham 1998; Phillips et al. 2005). Immediately after the second and subsequent presentations of saccharin, mice received injections of saline or ethanol (2.5 g/kg). This ethanol dose was selected for comparison of prior data collected in our laboratory and is based on published studies (Blednov et al. 2006, 2007a). All mice also received unmeasured 1 h access to tap water 5 h after injection of ethanol to prevent dehydration. A 2 h access to tap water was given during intervening days. All together, 33 female mice (n = 7–10/group/genotype) derived from 10 litters were tested.
LORR
Sensitivity to the sedative effects of ethanol was determined using the standard sleep time assay. Ethanol was administered in a dose of 3.2 or 3.8 g/kg. These doses were selected to give LORR in all mice, but not to give a prohibitively long sleep time because the dependence between dose of alcohol and duration of LORR is remarkably steep. Mice were injected with ethanol and when they became ataxic, they were placed in the supine position in V-shaped plastic troughs until they were able to right themselves three times within 1 min. Latency to LORR was defined as the time from receiving the ethanol injection until mice remained in the supine position for 1 min. Sleep time was defined as the time from being placed in the supine position until they regained their righting reflex. Mice that failed to lose the righting reflex (misplaced injections) or had a sleep time greater than two standard deviations from the group mean were excluded from analysis. Retro-orbital blood samples (50 μL) were taken at gain of righting reflex. Blood alcohol concentration values, expressed as mg ethanol per mL blood were determined spectrophotometrically by an enzyme assay (Lundquist 1959). All together, 54 female mice (n = 7–11/group/genotype) derived from 16 litters were tested.
Initial sensitivity to LORR using the up and down method
The up and down method was used as described by Dixon (1965). Mice were given an ethanol injection and then tested for a LORR greater than 1 min. The 95% confidence limits were determined using the “up and down” method with an ethanol log dose interval of 0.025, which corresponds to approximately a 0.13 g/kg ethanol dose difference at doses tested. Each mouse was injected with an ethanol dose and tested only once, and the results from each mouse determined the dose the next mouse would receive. If a mouse did not show LORR for a particular dose, the ethanol dose for the next mouse to be tested would be increased (by a log interval of 0.025) or if the mouse did show LORR the ethanol dose for the next mouse would be decreased (by a log interval of 0.025). The up and down method ascertains the ethanol dose at which 50% of the population (ED50) displays a LORR. The ED50 values were determined by the following equation: [(Σxi)/ N] + [(d/N)(A + C)], where xi are the test levels, N = the last N trials, d = dosing interval, and A and C are constants listed in Table 2 from Dixon (1965). The 95% CI was determined using the following equation: 95% CI = ±[d × (√(2/N)) × 1.96], where 1.96 reflects the 0.05α level (Dixon 1965). All together, 26 female mice (n = 13/genotype) derived from 8 litters were tested.
Table 2.
Summary of results
| B6 × FVB | B6 × NZB | |
|---|---|---|
| Ethanol drinking phenotype | SAP | RAP |
| Ethanol-induced conditioned taste aversion (aversive) | < | |
| Sensitivity and duration of loss of righting reflex (sedative) | < | |
| Ethanol-induced conditioned place preference (reward) | = | |
| Acute ethanol withdrawal severity (aversive) | > | |
| Locomotor response to ethanol (reward) | = | |
| Ethanol metabolism (metabolic) | = | |
| Elevated plus maze (anxiety) | < | |
| Latency to enter mirrored chamber (anxiety) | < | |
| Locomotor response to novelty (novelty) | > | |
| Spontaneous locomotor activity (locomotor) | > |
This summary table provides a list of tested behaviors and signifies the hybrid comparisons using <, >, and =. For example, B6 × FVB show a less severe ethanol-induced conditioned taste aversion than B6 × NZB and this is denoted in the table as <
SAP sustained alcohol preference, RAP reduced alcohol preference
Conditioned place preference
The main principles of conditioned place preference, the apparatus and the protocol has been previously described (Hill et al. 2003; Cunningham et al. 2006). Each box had two compartments separated by a wall with a door. One compartment had a bar floor, and the other had a circle floor (perforated aluminum floor with 0.7 cm holes). There were three experimental groups per genotype; Grid+ (ethanol injection paired with circle floor, saline injection paired with bar floor), Grid− (ethanol injection paired with bar floor, saline injection paired with circle floor), and Saline (saline injections paired with both floors). The place-conditioning study involved two 5 min habituation sessions, eight 5 min conditioning sessions, and one 30 min test session. During habituation sessions both compartments had smooth metal flooring. On conditioning days 1, 3, 5, and 7, mice received a saline injection 1 min before being placed in either the Grid+ or Grid− compartment. On conditioning days 2, 4, 6, and 8, mice from Grid+ and Grid− groups received an ethanol injection (2.0 g/kg) 1 min before being placed in either the Grid+ or Grid− compartment; whereas mice from the saline group received a saline injection 1 min before being placed in either the Grid+ or Grid− compartment. On the ninth day (test day), mice were placed in the chamber with full access to both compartments. The distance traveled was measured during conditioning days and the time spent in each compartment was measured on test day. All together, 60 female mice (n = 10/group/genotype) derived from 18 litters were tested.
Ethanol-induced acute withdrawal
Mice were scored for baseline handling-induced convulsion (HIC) severity 1 day before ethanol administration. Ethanol was administered at a dose of 4.0 g/kg and HIC scores were measured every hour until they reached baseline. Each mouse was picked up gently by the tail and, if necessary, gently rotated 180°, and the HIC scored as follows: 5, tonic-clonic convulsion when lifted; 4, tonic convulsion when lifted; 3, tonic-clonic convulsion after a gentle spin; 2, no convulsion when lifted, but tonic convulsion elicited by a gentle spin; 1, facial grimace only after a gentle spin; 0, no convulsion (Crabbe et al. 1991). Acute withdrawal was quantified as the area under the curve (AUC) but above baseline level (Blednov et al. 2007b). All together, 18 mice (nine per genotype) derived from 6 litters were tested.
Ethanol injections with measured locomotor activity followed by ethanol self-administration
The aim of this experiment was to assess the effects of ethanol on locomotor activity and determine if ethanol or saline injection experience affects subsequent ethanol self-administration patterns. Prior to measuring locomotor activity, mice were placed individually into standard housing cages for 30 min for habituation. Locomotor activity was measured every 5 min for 30 min, for 14 days in standard mouse cages by an Opto-microvarimex (Columbus Instruments, Columbus, OH). Each locomotor activity cage contained bedding and was covered by a heavy flat plastic lid equipped with ventilation holes. Baseline activity was established in the first 4 days of recording (habituation days 1–4, abbreviated as H1–H4). On days 1–10 of the experiment, mice were given an injection of either saline or 1.75 g/kg ethanol immediately before being placed into locomotor activity cages. The dose and injection schedule was chosen based on published data (Blednov et al. 2004; Lessov and Phillips 1998; Lessov et al. 2001). During days 1–10, we measured water consumption daily from two identical bottles in the home cage and did not identify any position preferences. Beginning on day 11, water and an ethanol solution were available using the continuous access two bottle choice paradigm. Bottle positions were changed daily. Mice were weighed every 8 days throughout the experiment. On day 11, the mice were offered water and 3% ethanol (v/v in tap water) for 2 days. After 3% ethanol, escalating concentrations (3% increases up to 30%, then a 5% increase to 35% ethanol on day 31) were offered versus water, 2 days each. On day 33, 9% ethanol was presented for a second time. To assess the locomotor response to ethanol after chronic voluntary ethanol consumption, all mice were given an injection of 1.75 g/kg ethanol on Day 35 and their locomotor activity was recorded every 5 min for 30 min. During this experiment we measured locomotor activity (number of beam crosses), ethanol preference (amount of ethanol solution consumed divided by total fluid consumption), and ethanol consumption (g ethanol consumed per kg body weight). All together, 53 female mice derived from 16 litters were tested (n = 12–14/group).
Ethanol clearance
Mice (n = 7/genotype; derived from 4 litters) received a high dose of ethanol (4 g/kg) and rates of ethanol clearance were determined using a spectrophotometric enzyme assay (Lundquist 1959). Blood samples (50 μL) were taken from retro-orbital sinus (at 30, 60, 120, 180, and 240 min post-injection), added to 2 mL 3% perchloric acid, and centrifuged for 10 min at 1000 × g. Resulting supernatants were used to determine blood ethanol concentration (BEC) using an alcohol dehydrogenase enzyme assay.
Elevated plus maze
The elevated plus maze apparatus was a modification of that validated by Lister (1987) and has been previously described (Blednov et al. 2001). The elevated plus maze apparatus consisted of two open (30 × 5 × 0.25 cm) and two enclosed (30 × 5 × 5 cm) arms that extended from a common central platform (5 × 5 cm). The apparatus was constructed from black Plexiglas and elevated 60 cm above the floor. Mice were individually placed in a dark box on the central platform of the maze for 1 min prior to the start of testing, which began upon removal of the dark box. Test duration was 5 min and sessions were recorded by an overhead camera and scored at a later time. The conventional spatiotemporal measures (i.e., open arm time and entries) as well as behaviors related to the defensive repertoire of the mouse (i.e., stretch attend posturing, and head dipping) were scored (Rodgers and Johnson 1995). A mouse was considered to have entered an arm when all four of its paws were placed in the arm. All together, 30 mice (15 per genotype) derived from 9 litters were tested.
Mirror chamber
The mirrored chamber was originally described by Toubas et al. (1990) and consisted of an internally mirrored cube (30.5 cm width × 30.5 length × 30.5 height; open on one side) which was placed into the center of a square black plexiglass box (40.5 cm length × 40.5 cm width × 30.5 cm height). The four corridors were 4.5 cm wide. Anxiolytic drugs reduced the latency to enter the mirrored cube as compared with untreated animals; therefore the mirrored cube is presumably anxiogenic (Kliethermes et al. 2003; Seale et al. 1996; Toubas et al. 1990). The apparatus is similar to that described by Kliethermes et al. (2003) with the exception that the mirrored chamber was placed in the center of the container. Group housed mice were brought into the experimental room and allowed to acclimate for at least 30 min prior to initiation of the experiment. To begin the experiment, a mouse was placed at a single, fixed starting point at the same comer of the corridor. The mouse was able to move freely in the corridors and into the chamber of mirrors. Latency to enter the mirrored chamber was measured as the time from placement into the corridor until the mouse placed all four paws onto the floor plane of the mirrored chamber. Mice were in the apparatus for 5 min. Behaviors were recorded by a small overhead camera and scored at a later time. The experimenter remained behind a blocking screen. Latency values are expressed as the mean entry time in seconds ± SEM. All together, 26 mice (13 per genotype) derived from 8 litters were tested.
Response to novelty
Locomotor activity was measured in clean standard mouse cages (with modified cage tops) by Opto-Varimex-Mini (Columbus Instruments, Columbus, OH) as described in Blednov et al. (2002). Mice in their home cages were moved to the experimental room 1 day before the beginning of the experiment. Motor response to novelty was monitored on the next day every 10 min during a 3-h session that began immediately after the mouse was placed into an unfamiliar cage. The unfamiliar cage contained bedding and was covered by a heavy flat plastic lid equipped with ventilation holes. Unfamiliar cages can increase exploration and burying behaviors, resulting in a transient increase in locomotor activity. It is important to note the measured locomotor response to novelty is different than tests of novelty seeking or preference for novel environments. All together, 32 mice (16 per genotype) derived from 10 litters were tested.
Spontaneous locomotor activity
Locomotor activity was measured in standard mouse cages by Opto-Varimex-Mini (Columbus Instruments, Columbus, OH) as described in Blednov et al. (2002). Mice in their home cages were moved to the experimental room 1 day before beginning of the experiment. Spontaneous locomotor activity was monitored every hour over a 72 h session. All together, 14 mice (seven per genotype) derived from 4 litters were tested.
Statistical analysis
Data were normally distributed and are reported as the mean ± SEM. value (except LORR ED50 values obtained from up and down method which are reported as the mean ± 95% CI). Statistics were performed using Statistica version 6 (StatSoft, Tulsa, Oklahoma, USA) and GraphPad Prism version 4.00 (GraphPad Software, San Diego, California, USA). Three-way ANOVA, two-way ANOVA, Student’s t test, and Pearson’s chi-square test were carried out to evaluate differences between trials, groups and/or genotypes. Repeated measures (or paired comparisons) were carried out when appropriate.
Results
Ethanol-related behaviors
Conditioned taste aversion
There were initial differences in saccharin solution consumption before conditioning between B6 × FVB and B6 × NZB females (133 ± 4 and 86 ± 4 g/kg/1 h, respectively) (p<0.0001). To attempt to correct for initial differences and individual fluctuations in saccharin intake and facilitate presentation of the data, intake was calculated as a percentage of injection day 1 consumption for each subject by dividing the amount of saccharin consumption on subsequent conditioning days by the amount of saccharin consumed on injection day 1. Ethanol injections, but not saline injections, paired with saccharin produced a reduction in saccharin intake over time for B6 × NZB and B6 × FVB mice (F(4,112) = 2.63; p<0.05—trial × treatment × genotype interaction; F(4,112) = 25.5; p< 0.0001—treatment – trial interaction; F(1,28) = 70.9; p<0.0001—main effect of treatment; F(4,112) = 17.6; p<0.0001—main effect of trial) (Fig. 1). B6 × NZB mice develop a more severe ethanol-induced conditioned taste aversion than B6 × FVB mice (F(4,112) = 6.30; p<0.001—genotype × trial interaction; F(1,28) = 5.20; p<0.05—main effect of genotype).
Fig. 1.

B6 × NZB mice develop a more severe ethanol-induced conditioned taste aversion than do B6 × FVB mice. Consumption of saccharin, the conditioned stimulus, is presented (as percent of injection day 1 intake) for all conditioning days. Dashed horizontal line placed at y = 100 to aid in visualizing data. F(4,112) = 2.63; p<0.05—genotype × treatment × trial interaction; F(4,112) = 6.30; p<0.001—genotype × trial interaction; F(4,112) = 25.5; p< 0.0001—treatment × trial interaction; F(1,28) = 70.9; p<0.0001— main effect of treatment; F(4,112) = 17.6; p<0.0001—main effect of trial; F(1,28) = 5.20; p<0.05—main effect of genotype)
Sedative effects of ethanol
The duration of LORR (sleep time) produced by 3.2 g/kg ethanol, but not 3.8 g/kg ethanol, was greater for B6 × NZB than B6 × FVB mice (p<0.001) (Fig. 2a). There was no significant difference in latency to LORR between B6 × NZB and B6 × FVB mice (Fig. 2b). There were no significant differences between genotypes in blood alcohol concentrations at gain of righting reflex for the 3.2 or 3.8 g/kg doses. Blood alcohol concentrations at gain of righting reflex for B6 × FVB mice were 4.13 ± 0.09 mg/mL (for 3.2 g/kg) and 4.81 ± 0.04 mg/mL (for 3.8 g/kg), and for B6 × NZB mice were 3.96 ± 0.16 mg/mL (for 3.2 g/kg) and 4.87 ± 0.11 mg/mL (for 3.8 g/kg).
Fig. 2.
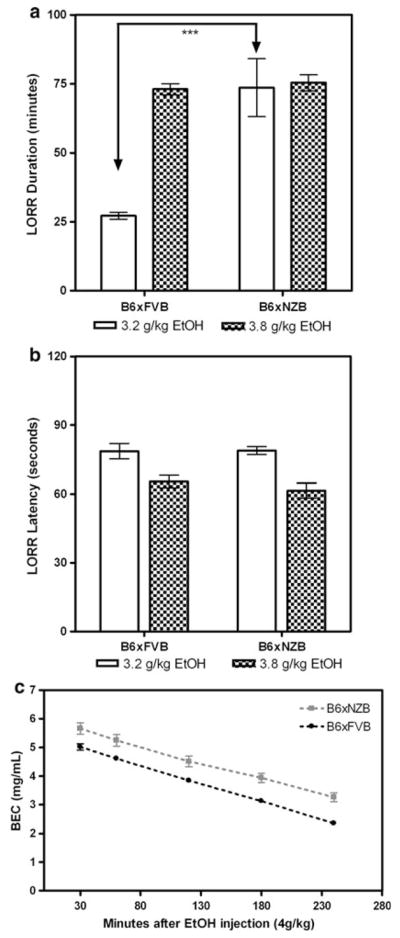
B6 × NZB mice are more sensitive than B6 × FVB mice to the sedative effects of ethanol as measured by ethanol-induced LORR. a Duration of LORR (sleep time in minutes) for both genotypes at doses of 3.2 and 3.8 g/kg ethanol. *** p<0.001. b Latency to lose righting reflex (seconds) for both genotypes at doses of 3.2 and 3.8 g/kg ethanol. c BEC in mg/mL per minute. Rate of ethanol clearance does not differ between genotypes after a single injection of ethanol (4 g/kg)
We then tested for differences in initial sensitivity to LORR using the up and down method. FVB × B6 mice had a greater ethanol-induced LORR ED50 (2.43 ± 0.02 g/kg) than B6 × NZB mice (2.14 ± 0.02 g/kg; p<0.0001). These results add further support that B6 × NZB mice are more sensitive to the sedative effects of ethanol than B6 × FVB mice.
In a separate experiment, we determined blood alcohol concentrations for both genotypes at 30, 60, 120, 180, and 240 min after a single injection of 4 g/kg ethanol. Ethanol clearance rates did not statistically differ between genotypes (0.013 ± 0.001 mg/mL per minute for B6 × FVB mice and 0.012 ± 0.001 mg/mL per minute for B6 × NZB mice) (Fig. 2c). Although the rates (slopes) did not differ, there was a clear difference in the y-intercepts. Since the y-intercept was greater for B6 × NZB we calculated the volume of distribution for each mouse as the initial dose (y-intercept) divided by body weight. The volume of distribution was slightly greater for B6 × NZB mice (22.4 ± 0.9 mL) than for B6 × FVB mice (19.4 ± 0.2 mL) (p<0.05).
Conditioned place preference
Conditioned place preference (CPP) is often used as a measure of drug reward and we asked if the hybrids differed in ethanol-induced conditioned place preference (Cunningham et al. 2006; Tzschentke 2007). Analysis of test day data indicates that both genotypes develop an ethanol-induced conditioned place preference to a similar extent, indicating a similar sensitivity to the rewarding properties of ethanol (Fig. 3a). Saline groups did not exhibit a floor type preference on test day. The data were analyzed by two-way ANOVA (group (GRID+ and GRID−) × genotype (B6 × FVB and B6 × NZB)). There was no group × genotype interaction and no main effect of genotype was seen. However, there was a main effect of group (F(1,53) = 37.9, p<0.0001). Both genotypes spent more time on the circle floor when it was paired with ethanol injections (GRID+ group), and both genotypes spent less time on the circle floor when it was paired with saline (GRID− group).
Fig. 3.

B6 × FVB and B6 × NZB mice develop an ethanol-induced conditioned place preference. a Ethanol-induced conditioned place preference. Percent of time spent on Grid+ floor (circles) during 30-min test session in ethanol conditioned (Grid+ and Grid− groups) and saline conditioned (control) groups. Dashed horizontal line placed at y = 0.5 to aid in visualizing data. F(1,53) = 37.9, p<0.0001—main effect of group. b Motor activity of B6 × FVB and B6 × NZB mice (Grid+ and Grid− groups) reported as total distance traveled (cm) during 5-min conditioning trials for CS+ and CS− trials. F(3,222) = 2.89; p<0.05—trial × genotype interaction; F(3,222) = 3.08; p<0.05—trial × CS interaction; F(1,74) = 23.6; p<0.001—main effect of CS; F(1,74) = 23.6; p<0.001—main effect of trial
We assessed whether the conditioning dose of ethanol (2 g/kg, i.p.) changed locomotor activity. Activity of ethanol groups (Grid+ and Grid−) during each 5 min conditioning trial was recorded and is presented separately for CS+ and CS− trials in Fig. 3b. Locomotor activity from the four CS+ and four CS− trials was compared using a three-way ANOVA of the data (genotype × CS × trial) for mice. For both genotypes, locomotor activity was greater on ethanol conditioning days than on saline conditioning days (main effect of CS: F(1,74) = 23.6; p<0.001). Locomotor activity for both genotypes decreased over trials (F(1,74) = 23.6; p<0.001). Three-way ANOVA also revealed two interactions: trial × genotype (F(3,222) = 2.89; p<0.05) and trial × CS (F(3,222) = 3.08; p<0.05).
Ethanol-induced acute withdrawal
The severity of ethanol-induced acute withdrawal was assessed by monitoring HIC scores. A single 4 g/kg dose suppressed basal HIC scores for about 4.5 to 7 h, followed by an increase in HIC scores which returned to baseline in 2–5 h (Fig. 4a). A two-way ANOVA of the data over the entire observation period revealed a significant genotype × time interaction (F(10,160) = 7.0; p<0.0001), with a main effect of genotype (F(1,160) = 4.5; p<0.05) and a main effect of time (F(10,160) = 99.4; p<0.0001). For each subject, the AUC was determined for the negative area (area below baseline represents of the sedative effects of ethanol) and the positive area (area above baseline represents of ethanol withdrawal severity). B6 × FVB mice had a smaller negative AUC and a greater positive AUC than B6 × NZB (p<0.001—negative AUC; p<0.05— positive AUC) (Fig. 4b, c).
Fig. 4.

Low severity of acute ethanol-induced withdrawal in B6 × NZB and B6 × FVB mice. a. Handling induced convulsion (HIC) scores after a single injection of ethanol (4 g/kg). Dashed horizontal line denotes B6 × NZB baseline HIC level and solid horizontal line denotes baseline HIC level for B6 × FVB. b Area under HIC curve and below the basal HIC level is higher for B6 × NZB mice than for B6 × FVB mice. *** p<0.001. c Area under HIC curve and above the basal HIC level is higher for B6 × FVB mice than for B6 × NZB mice. * p<0.05
Repeated ethanol or saline injections with measured locomotor activity followed by voluntary ethanol self-administration
There is evidence that the motor activating actions of drugs are related to their rewarding effects and that sensitization to stimulant actions enhances drug self-administration (Kalivas et al. 1998; Lessov et al. 2001; Robinson and Berridge 2000). To determine if the hybrids respond differently to the stimulant actions of ethanol we measured locomotor activity and to determine if non-contingent ethanol administration changes subsequent ethanol consumption we measured ethanol consumption (Fig. 5a). We also determined responses to a single ethanol injection for all groups following ethanol self-administration (Fig. 5a).
Fig. 5.

Ethanol injections with measured locomotor activity followed by ethanol self-administration. a Diagram of experimental schedule. b Locomotor activity reported as total number of beam crosses during 30 min session. Day of measurement is reported on the x-axis (H1–H4 represents habituation days 1–4, D1–D10 represents ethanol or saline injection days 1–10, and D35 represents ethanol injection after completion of the ethanol preference test. Vertical lines are plotted to aid in visualizing the data according to the experimental schedule. c Voluntary ethanol consumption presented as g/kg/day. d Preference for solution in two-bottle choice beginning with data from two-bottle, water only (H2O), immediately followed by data from two-bottle, water and ethanol solution (%). e Comparison of first and second presentation of 9% ethanol consumption. f Comparison of first and second presentation of 9% ethanol preference. * p<0.05, ** p<0.01, *** p<0.001
We did not observe ethanol-induced locomotor sensitization in either hybrid. Using a schedule expected to produce sensitization, we found that locomotor activity of ethanol treated mice (both genotypes) was lower than in saline treated mice (Fig. 5b; F(1,49) = 6.95; p<0.05—main effect of treatment). The three-way ANOVA also revealed a trial × genotype interaction (F(9,441) = 2.35; p<0.05).
To determine if non-contingent ethanol administration changed subsequent ethanol consumption we measured ethanol consumption following the repeated ethanol or saline injections shown in Fig. 5b. Ethanol was offered in a two-bottle free-choice paradigm in ascending concentrations of 3–35%, ending with a second presentation of 9% ethanol (Fig. 5c, d). The amount of ethanol consumed was dependent on the ethanol concentration offered for both genotypes (Fig. 5c; F(12, 588) = 67.2; p<0.0001). There was a main effect of treatment on ethanol consumption for both hybrids, with increased consumption in the ethanol-treated group as compared with the saline-treated group (F(1,49) = 14.9; p<0.0001). There was also a main effect of genotype (F(1,49) = 70.4; p<0.0001). The three-way ANOVA also revealed two significant interactions: ethanol concentration × genotype (F(12,588) = 18.4; p<0.0001) and ethanol concentration × treatment (F(12,588) = 15.4; p<0.0001).
Ethanol preference was dependent on the ethanol concentration offered for both genotypes (Fig. 5c; F(12,588) = 331; p<0.0001). There was a main effect of treatment on ethanol consumption for both hybrids, with increased consumption in the ethanol-treated group as compared with the saline-treated group (F(1,49) = 4.77; p<0.0001). There was also a main effect of genotype (F(1,49) = 88.2; p<0.0001). The three-way ANOVA also revealed two significant interactions: ethanol concentration × genotype (F(12,588) = 71.3; p<0.0001) and ethanol concentration × treatment (F(12,588) = 4.09; p<0.0001).
We next evaluated the behavioral phenotypes of SAP and RAP and consumption by comparing 9% ethanol preference and consumption before experience with high ethanol concentrations (first 9%) with 9% ethanol preference and consumption after experience with high ethanol concentrations (second 9%) (Fig. 5e, f). Mice from the B6 × FVB EtOH group showed sustained 9% alcohol preference and consumption. Mice from the B6 × FVB Saline group showed a small but significant reduction in 9% alcohol preference and consumption (p<0.05—ethanol preference; p<0.05—ethanol consumption). Mice from both the B6 × NZB EtOH and B6 × NZB Saline groups showed reduced 9% alcohol preference and consumption (p<0.001—B6 × NZB EtOH ethanol preference; p<0.001—B6 × NZB EtOH ethanol consumption; p<0.01—B6 × NZB Saline ethanol preference; p<0.01—B6 × NZB Saline ethanol consumption).
Following completion of the ethanol self-administration schedule, all mice were given an injection of ethanol (1.75 g/kg, i.p.) and locomotor activity was recorded (Fig. 5b). For both genotypes, saline groups had increased locomotor activity, while the activity of mice from ethanol groups remained unchanged (comparison of data from injection day 10 and on day 35 after 24 days of ethanol self-administration: p<0.01—B6 × NZB Saline; p<0.01—B6 × FVB Saline).
Ethanol-naïve behaviors
Elevated plus maze
Spatiotemporal measures (i.e., percent time, arm entries, percent arm entries) as well as behaviors related to the defensive repertoire of the mouse (i.e., stretch attend posturing and head dipping) are reported in Table 1. B6 × FVB mice spent a higher percentage of time in the open arms of the plus maze than B6 × NZB mice (p<0.01). There were no significant differences for percent time spent in the middle or in the closed arms. B6 × FVB had a greater number of open arm entries (p<0.01), closed arm entries (p<0.05), and total arm entries (p<0.01) than B6 × NZB mice. These data indicate that basal locomotor activity is greater for B6 × FVB mice than for B6 × NZB mice; therefore, we calculated the percent of open and closed arm entries (as a function of total arm entries) for further comparison. The percent of open arm entries was higher for B6 × FVB mice (p<0.05), while the percent of closed arm entries was higher for B6 × NZB mice (p<0.05). Furthermore, B6 × FVB mice displayed more body stretches (p<0.001) and head dips (p<0.05) than B6 × NZB mice.
Table 1.
Elevated plus maze behaviors
| B6 × FVB | B6 × NZB | |
|---|---|---|
| Percent time in closed arms | 68 ±3 | 69± 5 |
| Percent time in open arms | 14 ±2 | 6± 2** |
| Percent time in middle | 18 ±2 | 26± 4 |
| No. of closed arm entries | 14.3 ± 0.8 | 11 ± 1* |
| No. of open arm entries | 4.7 ± 0.5 | 2.1 ± 0.6** |
| No. of total arm entries | 19 ±1 | 13± 2** |
| Percent closed arm entries | 75 ±2 | 86± 3* |
| Percent open arm entries | 25 ±2 | 14± 3* |
| No. of body stretches | 27 ±1 | 21± 1*** |
| No. of head dips | 17 ±1 | 13± 1* |
B6 × FVB are less anxious and more active than B6 × NZB. Significant difference from B6 × FVB (Student’s t-test)
p<0.05,
p<0.01,
p<0.001
Mirror chamber
Latency to enter the mirrored chamber was greater for B6 × NZB mice than for B6 × FVB mice (149 ± 29 and 283 ± 11 s, respectively; p<0.001). Whether a mouse enters the mirror chamber or not depends on genotype (Pearson’s chi-square test, χ2 = 7.72, p<0.01).
Response to novelty
To determine the role of novel environment in the locomotor activity differences seen in the previous experiments, we compared motor responses of hybrid mice in a novel situation. Motor activity levels of B6 × FVB mice were markedly higher than B6 × NZB mice (F(1,510) = 16.36; p<0.001—main effect of genotype) (Fig. 6). Although both genotypes demonstrated typical transient motor responses to a novel situation, the increased motor response is more brief in B6 × NZB mice than in B6 × FVB mice (F(17,510) = 20.98; p<0.001—main effect of time, F(17,510) = 1.74; p<0.05—genotype × time interaction).
Fig. 6.

Locomotor response to novelty is higher in B6 × FVB mice than in B6 × NZB mice. Motor response to novelty was recorded as the number of beam crosses per 10 min for 3 h. Motor activity levels of B6 × FVB mice were higher than B6 × FVB mice (F(1,510) = 16.36; p<0.001—main effect of genotype)
Spontaneous locomotor activity
Locomotor activity was monitored hourly for 72 h (Fig. 7). Spontaneous locomotor activity levels of B6 × FVB mice were markedly higher than B6 × NZB mice (F(1, 852) = 12.97; p<0.01—main effect of genotype). B6 × FVB mice were more active during lights off periods than B6 × NZB mice (F(71,852) = 4.97; p<0.001— genotype × time interaction; F(71,852) = 14.3; p< 0.0001—main effect of time). To further analyze genotype differences more apparent during the lights off periods, AUC was calculated from individual locomotor data from the three lights off periods. Student’s t-test of AUC analysis for lights off periods show that B6 × FVB mice were more active during the dark (lights off) than B6 × NZB mice (AUC values: B6 × FVB 80,000 ± 10,000, B6 × FVB 50,000 ± 4,000; p<0.05).
Fig. 7.

B6 × FVB have higher levels of spontaneous locomotor activity than do B6 × NZB mice. Spontaneous locomotor activity was monitored hourly for 72 h. Activity levels of B6 × FVB mice were higher than B6 × NZB mice (F(1, 852) = 12.97; p<0.01—main effect of genotype)
Discussion
Ethanol motivation and sensitivity were assessed in B6 × FVB and B6 × NZB F1 hybrids using a battery of tests including conditioned taste aversion, conditioned place preference, LORR, acute withdrawal severity and repeated alcohol injections followed by voluntary ethanol consumption (Table 2). B6 × FVB mice were less sensitive to the aversive and sedative, but not to the rewarding, effects of ethanol than B6 × NZB. In addition, the B6xFVB mice were more exploratory, less anxious and more active than B6 × NZB mice.
Differences in sensitivity to the aversive effects of ethanol could have a role in the development of the RAP and SAP behaviors seen in our models. Indeed, B6 × FVB mice developed a less severe ethanol-induced conditioned taste aversion than B6 × NZB mice. The relative strength of the conditioned stimulus, saccharin, is known to influence the development of conditioned taste aversion. Blednov et al. (2010) report B6 × FVB and B6 × NZB both exhibit a high preference for saccharin (0.94 ± 0.01 and 0.88 ± 0.04, respectively); therefore, differences in saccharin preferences are not likely an explanation of the differences in ethanol-induced conditioned taste aversion. In addition to our findings, an inverse relationship between ethanol consumption and severity of ethanol-induced conditioned taste aversion has been described for many genotypes (Broadbent et al. 2002; Chester et al. 2003; Phillips et al. 2005). However, it is unknown whether ethanol-induced conditioned taste aversion is produced by the rewarding or aversive effects of ethanol (Liu et al. 2009). Additional conditioned taste aversion experiments would be helpful in determining if the conditioned taste aversion that develops in these hybrids is specific to ethanol. If it is specific to ethanol, one would expect the hybrids to develop a similar degree of conditioned taste aversion to lithium chloride. Another variant of conditioned taste aversion could be employed using two tastants where, on alternating days, one tastant is paired with ethanol injections and another tastant is paired with saline injections. Ethanol specificity would be supported if a taste aversion developed to the tastant paired with ethanol, but not to the tastant paired with saline.
B6 × FVB mice were less sensitive to the sedative effects of ethanol than B6 × NZB mice. Differences in ethanol-induced LORR can be due to differences in metabolism, sensitivity, or acute tolerance. We found no difference in rates of ethanol clearance after a single high dose, suggesting that the differences in LORR are not due to clearance. Blood alcohol levels at regaining of righting reflex were not different for B6 × FVB and B6 × NZB mice, indicating no difference between the hybrids in alcohol sensitivity at awakening. Therefore, it is likely that the difference in LORR is due to initial sensitivity to ethanol. B6 × FVB are less sensitive to the initial effects of ethanol than B6 × NZB. This implies that B6 × FVB develop greater acute tolerance than B6 × NZB.
B6 × FVB and B6 × NZB mice developed similar ethanol-induced conditioned place preference and both genotypes showed a motor stimulatory response to ethanol during the conditioning trials. These observations are consistent with both genotypes exhibiting similar sensitivity to the rewarding properties of ethanol. It is important to note that ethanol preference in general is likely influenced not only by pharmacological actions of ethanol, but also by its caloric value, taste, olfaction and palatability, whereas the final measure of reward in conditioned place preference (as well as conditioned taste aversion) paradigms takes place in the absence of ethanol (Bachmanov et al. 2003; Belknap et al. 1993; Kiefer et al. 1998; McMillen and Williams 1998). The issue of whether voluntary ethanol drinking is related to the reinforcing effects of ethanol has been addressed in a recent meta-analysis which revealed a positive relationship between ethanol drinking and ethanol-induced conditioned place preference (Green and Grahame 2008).
Acute ethanol-induced withdrawal was higher for B6 × FVB mice than for B6 × NZB mice. However, it is pertinent to note that both genotypes showed a low HIC withdrawal severity. In the future, other tests of alcohol withdrawal severity such as withdrawal-induced anxiety could be measured. Since both hybrids show an initial high ethanol preference and a low severity of acute ethanol withdrawal, our results further support findings by Metten et al. (1998) demonstrating a negative correlation between ethanol preference and acute ethanol withdrawal severity.
Although drug-induced locomotor sensitization is thought to reflect neural adaptations important in the development of addiction, ethanol-induced locomotor sensitization has been positively and negatively correlated with voluntary ethanol consumption in mice (Grahame et al. 2000; Lessov and Phillips 1998; Phillips et al. 1995; Robinson and Berridge 2000). Ethanol-induced locomotor sensitization is well known to be dependent upon genotype and ethanol dose (Lessov et al. 2001; Phillips et al. 2005). Under our conditions, neither genotype displayed ethanol-induced locomotor sensitization. Ethanol-experienced mice had suppressed locomotor activity as compared with saline-experienced mice.
In addition, injection of ethanol did not change the SAP and RAP behavioral phenotypes. However, ethanol preference and consumption were increased in B6 × NZB and B6 × FVB mice injected with ethanol as compared with saline injection. One interpretation of this finding is that mice are more sensitive to the stress associated with the previous experience of repeated saline injections. When comparing ethanol preference and consumption data from the first and second 9% ethanol presentations, B6 × FVB mice given repeated saline injections unexpectedly showed a small, but significant reduction. Other reports showed that pre-exposure to ethanol (via voluntary or forced ethanol consumption) can increase, decrease, or have no affect on subsequent ethanol consumption (Lessov et al. 2001; Ufer et al. 1999). Importantly, preliminary experience with equivalent ethanol doses did not change the SAP and RAP behavioral phenotypes. This suggests that initial differences in ethanol consumption play a minimal role in subsequent behavior. In contrast to the schedule carried out by Blednov et al. (2010), there were no periods of abstinence in this experimental schedule; therefore, they may not be necessary for the development of RAP seen in B6 × NZB mice. It will be important to test hybrid responses to different ethanol schedules (i.e., experience with high or low concentrations of ethanol, with or without periods of abstinence) to identify the conditions which produce RAP in B6 × NZB mice.
There were notable differences in behavior when handling the hybrids and subsequent behavioral tests (elevated plus maze, mirror chamber, and environmental novelty) validated that B6 × FVB mice were more exploratory, less anxious, and more active than B6 × NZB mice. Anxiety is often invoked as a predictor of ethanol consumption or more specifically, craving and relapse behavior. For example, the selected rat line Roman high-avoidance (low anxiety and high novelty seeking profile) shows a higher preference for ethanol than the Roman low-avoidance rats (high anxiety and low novelty seeking profile) (Fernández-Teruel et al. 2002). Also, there are several reports indicating a major role for anxiety and stress in craving and relapse models (Heilig and Koob 2007). To further understand ethanol-related behaviors in these hybrids, it will be important in the future to compare their behavioral responses before and after SAP/RAP, rather than under ethanol-naïve conditions.
These new genetic models of both stable, high consumption and experience-induced moderate drinking offer significant advantages to existing models. B6 × FVB mice drink high concentrations of ethanol with a high preference. Therefore, to test the validity of the SAP behavioral phenotype it is imperative to assess the development of tolerance and dependence after chronic voluntary consumption for this new mouse model. Factors important for experience-induced alcohol moderation, a negative alcohol deprivation effect, have not been fully explored. Neuronal circuitry underlies motivational aspects of ethanol consumption. Therefore it will crucial to identify neural networks important for the SAP and RAP behavioral phenotypes to better understand what neurobehavioral mechanisms could be responsible for SAP and RAP.
Acknowledgments
We would like to thank Igor Ponomarev for many helpful discussions and Marni Martinez, Jennifer Stokes, and Danielle Walker for assistance in animal husbandry and data collection. This research was supported by the Integrative Neuroscience Initiative on Alcoholism Consortium Grant AA13520, and National Institute on Alcohol Abuse and Alcoholism Grants AA06399-S and AA16424.
References
- Bachmanov AA, Kiefer SW, Molina JC, Tordoff MG, Duffy VB, Bartoshuk LM, Mennella JA. Chemosensory factors influencing alcohol perception, preferences, and consumption. Alcohol Clin Exp Res. 2003;27:220–231. doi: 10.1097/01.ALC.0000051021.99641.19. [DOI] [PMC free article] [PubMed] [Google Scholar]
- Belknap JK, Crabbe JC, Young ER. Voluntary consumption of ethanol in 15 inbred mouse strains. Psychopharmacology. 1993;112:503–510. doi: 10.1007/BF02244901. [DOI] [PubMed] [Google Scholar]
- Blednov YA, Stoffel M, Chang SR, Harris RA. Potassium channels as targets for ethanol: studies of G-protein-coupled inwardly rectifying potassium channel 2 (GIRK2) null mutant mice. J Pharmacol Exp Ther. 2001;298:521–530. [PubMed] [Google Scholar]
- Blednov YA, Stoffel M, Cooper R, Wallace D, Mane N, Harris RA. Hyperactivity and dopamine D1 receptor activation in mice lacking girk2 channels. Psychopharmacology. 2002;159:370–378. doi: 10.1007/s00213-001-0937-6. [DOI] [PubMed] [Google Scholar]
- Blednov YA, Walker D, Osterndorf-Kahanek E, Harris RA. Mice lacking metabotropic glutamate receptor 4 do not show the motor stimulatory effect of ethanol. Alcohol. 2004;34:251–259. doi: 10.1016/j.alcohol.2004.10.003. [DOI] [PubMed] [Google Scholar]
- Blednov YA, Metten P, Finn DA, Rhodes JS, Bergeson SE, Harris RA, Crabbe JC. Hybrid C57BL/6J × FVB/NJ mice drink more alcohol than do C57BL/6J mice. Alcohol Clin Exp Res. 2005;29:1949–1958. doi: 10.1097/01.alc.0000187605.91468.17. [DOI] [PMC free article] [PubMed] [Google Scholar]
- Blednov YA, Walker D, Martinez M, Harris RA. Reduced alcohol consumption in mice lacking preprodynorphin. Alcohol. 2006;40:73–86. doi: 10.1016/j.alcohol.2006.12.002. [DOI] [PMC free article] [PubMed] [Google Scholar]
- Blednov YA, Cravatt BF, Boehm SL, II, Walker D, Harris RA. Role of endocannabinoids in alcohol consumption and intoxication: studies of mice lacking fatty acid amide hydrolase. Neuropsychopharmacology. 2007a;32:1570–1582. doi: 10.1038/sj.npp.1301274. [DOI] [PubMed] [Google Scholar]
- Blednov YA, Walker D, Martinez M, Levine M, Damak S, Margolskee RF. Perception of sweet taste is important for voluntary alcohol consumption in mice. Genes Brain Behav. 2007b;7:1–13. doi: 10.1111/j.1601-183X.2007.00309.x. [DOI] [PMC free article] [PubMed] [Google Scholar]
- Blednov YA, Ozburn AR, Walker D, Ahmed S, Belknap JK, Harris RA. Hybrid mice as genetic models of high alcohol consumption. Behav Genet. 2010;40:93–110. doi: 10.1007/s10519-009-9298-4. [DOI] [PMC free article] [PubMed] [Google Scholar]
- Broadbent J, Muccino KJ, Cunningham CL. Ethanol-induced conditioned taste aversion in 15 inbred mouse strains. Behav Neurosci. 2002;116:138–148. [PubMed] [Google Scholar]
- Chester JA, Lumeng L, Li TK, Grahame NJ. High- and low-alcohol- preferring mice show differences in conditioned taste aversion to alcohol. Alcohol Clin Exp Res. 2003;27:12–18. doi: 10.1097/01.ALC.0000046340.06154.9F. [DOI] [PubMed] [Google Scholar]
- Crabbe JC, Merrill C, Belknap JK. Acute dependence on depressant drugs is determined by common genes in mice. J Pharmacol Exp Ther. 1991;257:663–667. [PubMed] [Google Scholar]
- Cunningham CL, Gremel CM, Groblewski PA. Drug-induced conditioned place preference and aversion in mice. Nat Protoc. 2006;1:1662–1670. doi: 10.1038/nprot.2006.279. [DOI] [PubMed] [Google Scholar]
- Dixon WJ. The up and down method for small samples. J Am Stat Assoc. 1965;60:967–978. [Google Scholar]
- Fergusson DM, Boden JM, Horwood LJ. The developmental antecedents of illicit drug use: evidence from a 25-year longitudinal study. Drug Alcohol Depend. 2008;96:165–177. doi: 10.1016/j.drugalcdep.2008.03.003. [DOI] [PubMed] [Google Scholar]
- Fernández-Teruel A, Driscoll P, Gil L, Aguilar R, Tobeña A, Escorihuela RM. Enduring effects of environmental enrichment on novelty seeking, saccharin and ethanol intake in two rat lines (RHA/Verh and RLA/Verh) differing in incentive-seeking behavior. Pharmacol Biochem Behav. 2002;73:225–231. doi: 10.1016/s0091-3057(02)00784-0. [DOI] [PubMed] [Google Scholar]
- Grahame NJ, Rodd-Henricks K, Li TK, Lumeng L. Ethanol locomotor sensitization, but not tolerance correlates with selection for alcohol preference in high- and low-alcohol preferring mice. Psychopharmacology. 2000;151:252–260. doi: 10.1007/s002130000388. [DOI] [PubMed] [Google Scholar]
- Green AS, Grahame NJ. Ethanol drinking in rodents: is free-choice drinking related to the reinforcing effects of ethanol? Alcohol. 2008;42:1–11. doi: 10.1016/j.alcohol.2007.10.005. [DOI] [PMC free article] [PubMed] [Google Scholar]
- Heilig M, Koob GF. A key role for corticotropin-releasing factor in alcohol dependence. Trends Neurosci. 2007;30:399–406. doi: 10.1016/j.tins.2007.06.006. [DOI] [PMC free article] [PubMed] [Google Scholar]
- Hill KG, Alva H, Blednov YA, Cunningham CL. Reduced ethanol-induced conditioned taste aversion and conditioned place preference in GIRK2 null mutant mice. Psychopharmacology. 2003;169:108–114. doi: 10.1007/s00213-003-1472-4. [DOI] [PubMed] [Google Scholar]
- Kalivas PW, Pierce RC, Cornish J, Sorg BA. A role for sensitization in craving and relapse in cocaine addiction. J Psychopharmacol. 1998;12:49–53. doi: 10.1177/026988119801200107. [DOI] [PubMed] [Google Scholar]
- Kiefer SW, Hill KG, Kaczmarek HJ. Taste reactivity to alcohol and basic tastes in outbred mice. Alcohol Clin Exp Res. 1998;22:1146–1151. [PubMed] [Google Scholar]
- Kliethermes CL, Finn DA, Crabbe JC. Validation of a modified mirrored chamber sensitive to anxiolytics and anxiogenics in mice. Psychopharmacology. 2003;169:190–197. doi: 10.1007/s00213-003-1493-z. [DOI] [PubMed] [Google Scholar]
- Lessov CN, Phillips TJ. Duration of sensitization to the locomotor stimulant effects of ethanol in mice. Psychopharmacology. 1998;135:374–382. doi: 10.1007/s002130050525. [DOI] [PubMed] [Google Scholar]
- Lessov CN, Palmer AA, Quick EA, Phillips TJ. Voluntary ethanol drinking in C57BL/6J and DBA/2J mice before and after sensitization to the locomotor stimulant effects of ethanol. Psychopharmacology. 2001;155:91–99. doi: 10.1007/s002130100699. [DOI] [PubMed] [Google Scholar]
- Lister RG. The use of a plus-maze to measure anxiety in the mouse. Psychopharmacology. 1987;92:180–185. doi: 10.1007/BF00177912. [DOI] [PubMed] [Google Scholar]
- Liu C, Showalter J, Grigson PS. Ethanol-induced conditioned taste avoidance: reward or aversion? Alcohol Clin Exp Res. 2009;33:522–530. doi: 10.1111/j.1530-0277.2008.00865.x. [DOI] [PMC free article] [PubMed] [Google Scholar]
- Lundquist F. The determination of ethyl alcohol in blood and tissue. Methods Biochem Anal. 1959;7:217–251. [Google Scholar]
- McMillen BA, Williams HL. Role of taste and calories in the selection of ethanol by C57BL/6NHsd and Hsd:ICR mice. Alcohol. 1998;15:193–198. doi: 10.1016/s0741-8329(97)00111-0. [DOI] [PubMed] [Google Scholar]
- Metten P, Phillips TJ, Crabbe JC, Tarantino LM, McClearn GE, Plomin R, Erwin VG, Belknap JK. High genetic susceptibility to ethanol withdrawal predicts low ethanol consumption. Mamm Genome. 1998;9:983–990. doi: 10.1007/s003359900911. [DOI] [PubMed] [Google Scholar]
- Phillips TJ, Huson M, Gwiazdon C, Burkhart-Kasch S, Shen EH. Effects of acute and repeated ethanol exposures on the locomotor activity of BXD recombinant inbred mice. Alcohol Clin Exp Res. 1995;19:269–278. doi: 10.1111/j.1530-0277.1995.tb01502.x. [DOI] [PubMed] [Google Scholar]
- Phillips TJ, Broadbent J, Burkhart-Kasch S, Henderson C, Wenger CD, McMullin C, McKinnon CS, Cunningham CL. Genetic correlational analyses of ethanol reward and aversion phenotypes in short-term selected mouse lines bred for ethanol drinking or ethanol-induced conditioned taste aversion. Behav Neurosci. 2005;119:892–910. doi: 10.1037/0735-7044.119.4.892. [DOI] [PubMed] [Google Scholar]
- Risinger FO, Cunningham CL. Ethanol-induced conditioned taste aversion in BXD recombinant inbred mice. Alcohol Clin Exp Res. 1998;22:1234–1244. [PubMed] [Google Scholar]
- Robinson TE, Berridge KC. The psychology and neurobiology of addiction: an incentive-sensitization view. Addiction. 2000;95:S91–S117. doi: 10.1080/09652140050111681. [DOI] [PubMed] [Google Scholar]
- Rodgers RJ, Johnson NJ. Factor analysis of spatiotemporal and ethological measures in the murine elevated plus-maze test of anxiety. Pharmacol Biochem Behav. 1995;52:297–303. doi: 10.1016/0091-3057(95)00138-m. [DOI] [PubMed] [Google Scholar]
- Rodgers DA, McClearn GE. Mouse strain differences in preference for various concentrations of alcohol. Q J Stud Alcohol. 1962;23:26–33. [PubMed] [Google Scholar]
- Seale TW, Niekrasz I, Garrett KM. Anxiolytics by ethanol, diazepam and buspirone in a novel murine behavioral assay. Neuroreport. 1996;7:1803–1808. doi: 10.1097/00001756-199607290-00023. [DOI] [PubMed] [Google Scholar]
- Toubas PL, Abla KA, Cao W, Logan LG, Seale TW. Latency to enter a mirrored chamber: a novel behavioral assay for anxiolytic agents. Pharmacol Biochem Behav. 1990;35(1):121–126. doi: 10.1016/0091-3057(90)90215-4. [DOI] [PubMed] [Google Scholar]
- Tzschentke TM. Measuring reward with the conditioned place preference (CPP) paradigm: update of the last decade. Addict Biol. 2007;12:227–462. doi: 10.1111/j.1369-1600.2007.00070.x. [DOI] [PubMed] [Google Scholar]
- Ufer M, Dadmarz M, Vogel WH. Voluntary consumption of amphetamine, cocaine, ethanol and morphine by rats as influenced by a preceding period of forced drug intake and clozapine. Pharmacology. 1999;58:285–291. doi: 10.1159/000028293. [DOI] [PubMed] [Google Scholar]
- Yoneyama N, Crabbe JC, Ford MM, Murillo A, Finn DA. Voluntary ethanol consumption in 22 inbred mouse strains. Alcohol. 2008;42:149–160. doi: 10.1016/j.alcohol.2007.12.006. [DOI] [PMC free article] [PubMed] [Google Scholar]