

Abstract
Background
We posit that cell-mediated drug delivery can improve transport of therapeutic enzymes to the brain and decrease inflammation and neurodegeneration induced during Parkinson’s disease. Our prior work demonstrated that macrophages loaded with nanoformulated catalase (“nanozyme”) protect the nigrostriatum in a murine model of Parkinson’s disease. Packaging of catalase into block ionomer complex with a synthetic polyelectrolyte block copolymers protects the enzyme degradation in macrophages.
Methods
We examined relationships between the composition and structure of block ionomer complexes, their physicochemical characteristics, and loadings, release rates, and catalase activity in bone marrow-derived macrophages.
Results
Formation of block-ionomer complexes resulted in improved aggregation stability. Block ionomer complexes with ε-polylisine, and poly-L-glutamic acid -poly(ethylene glycol) demonstrated the least cytotoxicity and high loading and release rates, however, did not efficiently protect catalase inside macrophages.
Conclusion
nanozymes with polyethyleneimine- and poly(L-lysine)10-poly(ethylene glycol) provided the best protection of enzymatic activity for cell-mediated drug delivery.
Keywords: cell-mediated drug delivery, neuroinflammation, catalase, Parkinson’s disease, blood-brain barrier
INTRODUCTION
Cell-based drug carriage of nanoformulated drugs and proteins has shown promise in early efforts aimed to improve central nervous system (CNS) drug delivery. Specifically, it is one promising avenue for translational research efforts seeking ways to combat the ravages of neurodegenerative disease [1]. The system rests in the abilities of blood borne macrophages to carry a range of neuroprotective, immune modulatory, and antimicrobial drugs, acting as Trojan horses, to cross the blood brain barrier (BBB) and affecting ongoing disease at action sites [2-5]. Specific drug carriage inside inflammatory cells rests with commonalities of inflammatory processes that underlie degenerative, infectious, and metabolic disorders of the CNS that include Alzheimer’s and Parkinson’s diseases (AD and PD), amyotrophic lateral sclerosis, Prion disease, meningitis, encephalitis, multiple sclerosis, hepatic encephalopathy, and human immunodeficiency virus (HIV)-associated neurocognitive impairment (HAND) [6]. Such CNS inflammation is characterized by chemokine and cytokine-mediated leukocyte recruitment to the site of disease by processes involving macrophage diapedesis and chemotaxis [7]. Importantly, macrophages also have a high rate of endocytosis that allows them to efficiently accumulate micro- and nanoparticles within intracytoplasmic endosomes and release them through processes that include exocytosis. All these features make blood borne and tissue macrophages attractive candidates for cell-mediated delivery of drugs and therapeutic proteins. Particularly, redox enzymes, which are known to inactivate reactive oxygen species (ROS) and reduce inflammation at the site of action, can be carried by into a diseased inflamed brain.
Recently our laboratories developed novel CNS drug delivery systems using macrophages for delivery of the antioxidant enzyme, catalase, in the 1-methyl-4-phenyl-1,2,3,6-tetrahydropyridine (MPTP) mouse model of PD [8]. For this system, nanoformulated catalase was obtained by coupling the enzyme to a cationic block copolymer, polyethyleneimine-poly(ethylene glycol), leading to a polyion complex micelle. Using macrophages as a carrier for therapeutic proteins offers several advantages to combat CNS disease including: i) prolonged plasma drug levels; ii) time-controlled release of the cell loaded drug; iii) targeted drug transport to the site of disease; and iv) diminished drug immunogenicity. Indeed, our previous works has demonstrated that BMM loaded with nanoformulated catalase and injected into MPTP-intoxicated mice reduce neuroinflammation and attenuate nigrostriatal degeneration [9].
In attempts to improve upon what was previously done we theorized that appropriate drug nanoformulations for cell-mediated delivery could be best designed by optimization of loading capacity, enabling sustained release, and realizing efficient preservation of drug activity within the cell-carriers. Indeed, size, charge and shape of nanoformulated antiretroviral drugs were shown important for macrophage-based delivery in treating ongoing HIV-1 disease [1]. Similar results were reported for the monocytes and neutrophil-mediated delivery of the liposome-encapsulated antifungal agent, chloroquine, against C. neoformans infection in the mouse brain [5]. In particular, cell-carriers showed preferential uptake of liposomes containing negatively charged lipids, such as phosphatidylserine [3], over liposomes that contain only neutral lipids, such as phosphatidylcholine. In addition, cytotoxicity of nanocontainers, as well as their ability to protect the drug inside cell-carriers, is also determined by their composition and structure [1].
The present study serves to optimize cell mediated enzyme delivery for therapeutic gain by improving the preparation and characterization of polyion complexes obtained by coupling catalase to different block copolymers. This consisted of: a) ionic block (positively-charged: polyethyleneimine- (PEI), or poly(L-lysine)- (PL); or negatively-charged: poly(L-glutamic acid)- (PGLU); and b) non-ionic block, poly(ethylene glycol)- (PEG). Electrostatic interactions between catalase and the charged copolymer block resulted in the formation of a insoluble polyion core, while a PEG corona provided stability of nanoparticles in water solutions. Effects of the length, charge and structure (linear or branched) of the ionic block on the nanozyme cytotoxicity, kinetics of uptake and release, and ability to protect enzymatic activity inside the host cells were examined. In addition, polymers with the similar ionic blocks (PEI or PL) but without PEG block were used to evaluate the role of PEG corona. All together, the incorporation of catalase in a BIC with cationic block copolymers, polyethyleneimine-poly(ethylene glycol) (PEI50-PEG), or poly(L-lysine)-poly(ethylene glycol) (PL50-PEG), resulted in formulations with optimal protection and sustained enzyme release of active catalase from macrophage carriers.
MATERIALS & METHODS
Reagents
Lipopolysaccharides (LPS), MPTP, polyethylenimine (PEI50) (2K, branched, 50% aq. solution), pronase, sulforhodamine-B (SRB), sodium dodecylsulfate (SDS), Sephadex G-25, Triton X-100, and trypsin, were purchased from Sigma-Aldrich, St. Louis, MO. Catalase from bovine liver erythrocytes was provided by Calbiochem (San Diego, CA). Methoxypolyethylene glycol epoxy (Me-PEG-epoxy) was purchased from Shearwater Polymer Inc. (Huntsville, AL). PEI50-PEG was synthesized using a modified procedure [10] by conjugation of PEI50 and Me-PEG-epoxy. Block copolymers PL10-PEG, PL30-PEG, PL50-PEG, and PGLU50-PEG were custom synthesized by Alamanda Polymers (Madison, AL). Epsilon polylisine (EPL) was purchased in Tecoland Co. (Edison, NJ). Metal chelators, DETC and deferoxamine were purchased from Noxygen Science Transfer and Diagnostics (Denzlingen, Germany). LysoSensor Yellow/Blue DND 160 was obtained from Molecular Probes (Eugene, OR). Interferon gamma (INT-γ) was purchased from Peprotech Inc. (RockyHill, N.J.)
Catalase Nanozymes
The polycomplexes were produced by mixing enzymes and block copolymers, which bind electrostatically to each other and forming nanoparticles with an enzyme-polyion complex core and PEG corona. Catalase and each block copolymer were separately dissolved in phosphate-buffered saline (PBS) at room temperature. Pre-calculated volumes of the block copolymer solution were added drop-by-drop to the enzyme solution to achieve the desired charge ratio (Z). The +/- charge ratio (Z) was calculated by dividing the amount of aminogroups in PL10-PEG, PL50-PEG, or PEI50-PEG protonated at pH 7.4 [11] by the total amount of Gln and Asp in catalase. In the case of PGLU50-PEG/catalase nanozyme, the -/+ charge ratio (Z-/+) was calculated by dividing the number of carboxyl groups of PGLU50-PEG by the total amount of Arg and Lys in catalase. To obtain a narrow size distribution of the particles, the nanozymes were filtered through a 20 nm filter before use.
Atomic Force Microscopy (AFM)
Nanozymes were prepared as described at an enzyme concentration of 1 mg/mL. Samples were diluted 100 × in PBS. A drop of catalase alone or catalase nanozyme dispersion (Z=1) in PBS was placed on positively charged mica treated with 1-(3-aminopropyl) silatrane (APS) [12] for 2 minutes, washed with deionized water and dried under an argon flow. Following additional drying for 15 min in vacuum, the glass slide with the sample was placed on the AFM stage of the Asylum Research Instrument (Santa Barbara, CA). The AFM imaging was operated in AC mode in air. The height, amplitude and phase images were collected. Regular silicon probes with spring constants of 40 N/m and resonance frequencies of 270-320 kHz were used.
Image processing and the cross-section analysis were performed using Femtoscan (Advanced Technologies Center, Moscow, Russia). The height of the particles and their diameters measured at half-maximal height were obtained from the cross-section analysis. The volume was approximated by a hemisphere using the equation described in [13]. To convert the volume data into particle size we used the volume value for Sfi tetramer (124 kDa) bound to DNA as described in [14].
Light Scattering Measurements (DLS)
Effective hydrodynamic diameter and ξ-potential of nanozymes were measured by photon correlation spectroscopy using the Zetasizer Nano (Malvern, UK) equipped with a 35 mW solid state laser (658 nm laser) as described [15, 16]. Scattered light was detected at a 90° angle and a temperature of 25° C. Hydrodynamic size was expressed as mean ± SEM of triplicate measurements. The aggregation stability of the nanoparticles in 10 mM phosphate buffer was examined over 168 hours.
Cells
Bone marrow-derived macrophages (BMM) were extracted from femurs of C57Bl/6 male mice 6-7 weeks of age according to previously published protocols [17] and cultured for 12 days in DMEM medium (Invitrogen, Carlsbad, CA) supplemented with 1,000 U/mL macrophage colony-stimulating factor (MCSF), a generous gift from Wyeth Pharmaceutical, Cambridge, MA). BMM were collected after 12 – 14 days of culture. Human monocytes were obtained from leukopaks of healthy donors, purified by countercurrent centrifugal elutration [18] and cultivated with MCSF as described above.
Bovine brain microvessel endothelial cell (BBMEC) monolayers that retain many of the morphological and biochemical characteristics of the BBB, such as the formation of tight junctions and low pinocytic activity [19], were used to reflect BBB function. BBMEC were isolated from fresh cow brains by enzymatic digestion and density centrifugation and grown on 96-well plates until confluent (typically 12 days) [20].
Mouse catecholaminergic CATH.a neurons were purchased from American Type Culture Collection (ATCC, Manassas, VA, USA) and cultured in RPMI-1640 medium supplemented with 8% normal horse serum (NHS), 4% fetal bovine serum (FBS), and 1% penicillin-streptomycin. Cultures were maintained in a humidified incubator at 37°C and 5% CO2. CATH.a neurons were differentiated by adding 1 mM of N6,2’-O-dibutyryladenosine 3’,5’-cyclic monophosphate sodium salt (dbcAMP, Sigma-Aldrich) to the culture media every other day for 6-8 days.
Cytotoxicity Assays
To evaluate toxicity of different nanozymes in BMM, CATH.a neurons, or BBMEC, cells were seeded in 96 well plates at a density of 10,000 cells/well and allowed to reattach overnight. Following treatment with various concentrations of nanozymes or block copolymers and catalase alone for two hours at 37°C, the cells were washed with PBS and cultured for 72 hours in complete media. The survival of the cells was determined using a standard 3-(4,5-dimethylthiazol-2-yl)-2,5-diphenyltetrazolium bromide (MTT) assay [21]. To ensure that catalase does not interfere with MTT coloring reaction, sulforhodamine-B (SRB) cell viability assay was used in parallel experiments.
BMM Accumulation and Release of Nanozymes
Catalase was labeled with rhodamine isothiocyanate (RITC) [8]. BMM grown on 24-well plates (2.5 × 10⁶ cells/plate) [20, 22] were pre-incubated with assay buffer (122 mM NaCl, 25 mM NaHCO3, 10 mM glucose, 3 mM KCl, 1.2 mM MgSO4, 0.4 mM K2HPO4, 1.4 mM CaCl2 and 10 mM HEPES) for 20 min. Following preincubation, the cells were treated with the RITC-labeled enzyme (1 mg/ml) in assay buffer alone or different nanozymes with various Z ratios for two hours. After incubation, the cells were washed three times with ice-cold PBS, and solubilized in Triton X100 (1%). For release studies, BMM were loaded with nanozymes for two hours, washed three times with ice-cold PBS, and then incubated in fresh media for various time points. Fluorescence in each sample was measured by Shimadzu RF5000 fluorescent spectrophotometer (λex=580 nm, λem=617 nm). The amount of RITC-labeled nanozyme was normalized for protein content and expressed in μg of enzyme per mg of the protein for loading experiments and μg enzyme per ml media as means ± SEM (N = 8). To exclude misinterpretation of results concerning possible degradation of catalase and accounting for fluorescent probe alone, BMM were incubated with 125I-labeled catalase nanozymes. Following incubation, BMM with accumulated enzyme were supplemented with trichloroacetic acid (TCA) for protein precipitation as described [23]. The radioactivity levels of the cells precipitates were measured on Wizard 3’ 1480 γ-counter (PerkinElmer Life, Boston, MA).
Antioxidant Activity Measurements
Catalytic activity of catalase alone or nanozymes was measured by three methods: spectrophotometry, EPR, and Amplex Red assay. The effect of incorporation of catalase into polyelectrolyte complex on its antioxidant activity was evaluated in a cell-free system. First, catalase activity in samples was measured using hydrogen peroxide decomposition. Activities were measured by monitoring the change in absorbance at 240 nm using Lambda 25 UV VIS Spectrophotometer (Perkin Elmer Instruments, Waltham, MA). In particular, 1 mL PBS, pH 7.4, 1-4 μL H2O2 (7.5 – 30 % v/w), and 2 μL catalase (0.06 - 0.5 mg/ml) or various nanozymes with different Z ratios were added into a cuvette. The initial activity was 10263 U/mg protein for catalase. A linear dependence of the catalytic activity on enzyme concentrations was observed in the range of 0.1 μg/ml – 1 mg/ml (data not shown). Furthermore, the stability of catalase in BIC was examined upon incubation of different nanozymes (0.5 mg/ml catalase) with trypsin (10-5 M), or pronase (2×10⁻¹ mg/ml) for 3 hours at 37°C. Following incubation, the aliquots were subjected for catalytic activity assessment as described above. Stability of catalase was expressed in residual activity vs. initial activity of nanozyme. Concentration dependence of catalase enzymatic activity was studied in a range of 1.7 – 35.2 mM hydrogen peroxide. Apparent kinetic parameters of different catalase nanozymes were determined for various Z ratios, and calculated using Lineweaver–Burk plot (or double reciprocal plot) [24].
Next, the ability of catalase nanozyme to scavenge hydrogen peroxide (H2O2) was tested by EPR spectroscopy in a cell-free system. Samples were prepared with a 200 μM spin probe 1-hydroxy-3-methoxycarbonyl-2,2,5,5-tetramethylpyrrolidine (CMH) and 20 μM H2O2 in 100 μL of a supplemented EPR buffer, called KDD+ buffer (pH 7.4), as previously described [25]. KDD+ buffer is a Krebs-HEPES buffer consisting of (in mM): 99 NaCl, 4.69 KCl, 2.5 CaCl2, 1.2 MgSO4, 25 NaHCO3, 1.03 KH2PO4, 5.6 D-glucose, 20 HEPES and supplemented with the metal chelators DETC (5 μM) and deferoxamine (25 μM). For the experimental groups, 250 ng/ml of free catalase or selected nanozymes (PEI50-PEG/catalase, PL10-PEG/catalase, and PGLU50-PEG/catalase) with different Z ratios (1, 10, and 20) incubated for different time points (0, 50, 100, and 150 minutes) at room temperature, and then were supplemented with 20 μM H2O2 and incubated at RT for 12 minutes before adding KDD amendments: 200 μM CMH spin probe, 1 mM 4-acetamidophenol (AAP), 200 μM diethylenetriaminepentaacetic acid (DTPA), and 1 U/ml HRP. Samples were incubated at room temperature for additional 5 minutes and 50 μL mixture was loaded into a glass capillary tube, which was then inserted into the capillary holder of a Bruker e-scan EPR spectrometer.
Finally, effect of BIC formation on catalase enzymatic activity was evaluated by Amplex Red Dye Fluorescence assay. Solutions of catalase alone (250 ng/ml) or different nanozymes were supplemented with Amplex Red Dye stock solution (10 U/mL HRP, 10 mM Ampex Red) for 30 minute, and ROS content was measured by fluorescence at λex=563 nm, λem=587 nm according to the manufacturer’s specifications.
Nanozyme Antioxidant Activities in Human Monocytes
Human blood monocytes seeded in 96-well plates (0.1 × 10⁶ cells/well) were stimulated with lipopolysaccharide (LPS, 20 ng/ml) and interferon gamma (IFN-γ, 2 μg/ml) for 24 hours to induce ROS production. Following incubation, “naked” catalase or nanozyme solutions were added to the cells for another hour. Then cells were supplemented with Amplex Red Dye stock solution for 30 min and ROS content was measured as described above.
Preservation of Nanozyme Activity in BMM
Mature mouse BMM were loaded with the enzyme alone or different Z ratio nanozymes for one hour, washed with PBS, and fresh media was added to the cells. Following one hour incubation, the media was collected and antioxidant activity of the enzyme released from BMM was assayed by the rate of hydrogen peroxide decomposition.
Confocal Microscopy
Monocytes grown in the chamber slides [22] were exposed to different RITC-labeled nanozymes (Z=5) for two hours at 37 °C. Following incubation, the cells were washed with PBS and incubated with 1 μM LysoSensor Yellow/Blue DND 160 solution for 5 minutes according to the manufacturer’s protocol. Then, the staining solution was removed and cells were washed two times with PBS. Labeled cells were examined by a confocal fluorescence microscopic system ACAS-570 (Meridian Instruments, Okimos, MI) with argon ion laser and corresponding filter set. Digital images were obtained using the CCD camera (Photometrics) and Adobe Photoshop software.
Statistical Analysis
For the all experiments, data are presented as the mean ± SEM. Tests for significant differences between the groups were done using a one-way ANOVA with multiple comparisons (Fisher’s pairwise comparisons) using GraphPad Prism 5.0 (GraphPad software, San Diego, CA). A minimum p value of 0.05 was estimated as the significance level for all tests.
RESULTS AND DISCUSSION
Manufacture and Testing of Nanozymes
Block ionomer complexes spontaneously form upon mixing block ionomers with either oppositely charged surfactant molecules or polyions (here polypeptide) [26]. Neutralization of the polyion charges can lead to the formation of insoluble polyion domains, which segregate in aqueous media. To this end, water-soluble nonionic segments (PEG) may prevent aggregation and macroscopic phase separation. As a result, these complexes self-assemble into particles of nanoscale size and form stable aqueous dispersions [26]. The BIC were produced by mixing the enzyme with different block copolymers, which bind electrostatically to each other, forming nanoparticles with the enzyme-polyion complex core and PEG corona. Catalase from bovine liver erythrocytes used in this study is negatively charged at physiological conditions containing 252 negatively-charged (Gln and Asp) and 240 positively-charged groups (Arg and Lys). Five different positively charged block copolymers were utilized for complex formation (Table 1). The effect of the length of positively-charged block (PL) was evaluated with three poly(L-lysine)-poly(ethylene glycol) block copolymers (PL10-PEG, PL30-PEG, and PL50-PEG) (Scheme 1). Two polymers, PEI50-PEG and PL50-PEG evaluated effect of the structure of positively-charged block (branched or linear for PEI50-PEG and PL50-PEG, respectively, Scheme 1). To assess importance of the PEG corona in nanoparticle formation two pairs of block copolymers, PL30-PEG vs. EPL, and PEI50-PEG vs. PEI50 were used (Scheme 1). Taking into account an abundance of positively-charged groups on the catalase surface, we utilized one negatively-charged block copolymer, poly(L-glutamic acid)-poly(ethylene glycol) (PGLU50-PEG), allowing interactions between PGLU- block and positively charged groups of catalase (Table 1).
Table 1.
Composition of the block copolymers utilized in this work
| Copolymer | MW | Average no. of units in ionic block a | Average no. of units in non-ionic block a |
|---|---|---|---|
| PEI50 | 2,000 | 50 | - |
| PEI50-PEG | 12,000 | 50 | 227 |
| PL10-PEG | 6,600 | 10 | 114 |
| PL30-PEG | 7,730 | 30 | 114 |
| PL50-PEG | 13,200 | 50 | 114 |
| EPL | 4,740 | 30 | - |
| PGLU50-PEG | 13,000 | 50 | 114 |
The average numbers of units were calculated using the average molecular weighs (MW) provided by the manufacturer.
First, complex formation was proved by AFM studies. Images on the positively-charged APS mica surface revealed clear differences between naked catalase and nanozymes (Figure 1). Application of catalase alone resulted in protein aggregation and highly polydispersed-size particles (Figure 1A). This is specific to APS mica, which is positively charged, while catalase is negatively charged at these conditions. The observed large aggregates form perhaps due to the electrostatic interactions between the protein and the mica surface. In contrast, all obtained nanozymes showed small spherical particles with the narrow size distribution (Figures 1 B-F). Typical image of PEI50-PEG/catalase complexes (Figure 1 B) demonstrated particles with a number-averaged height of 2.4 ± 0.1 nm and diameter of 21.5 ± 0.3 nm. The apparent volume was calculated as giving a mean value of 453.3 ± 18.5 nm3. It is worth mentioning that a volume of the catalase globule, estimated from the molecular weight of the protein and an average protein partial specific volume (0.73 cm3/g [27]) is ~ 300 nm3. Imaging in the air usually provides lower numbers for the height of the sample as a result of the drying process, but higher numbers for the width, due to the tip convolution effect. This tip-shape induced structural broadening usually results in an overestimated volume. In this respect, the data suggest that complexes formed from catalase and PEI50-PEG consist of one molecule of protein. Interestingly, nanoparticles obtained with the homopolymer, PEI50 (Figure 1D) also showed no signs of aggregation, indicating that even without the PEG corona, formation of the polyion-protein core of the micelles served to stabilize their 3D structures. Important, BICs were stable even upon 100-times dilution at concentrations about 0.01 mg/ml of catalase (see Materials and Methods section). Nanoparticles formed with the negatively-charged block copolymer, PGLU-PEG (Figure 1F), were slightly larger than those formed with positively-charged polymers. This might be a result of a partial aggregation of negatively-charged nanozyme core on positively-charged mica. The question remains in this case, whether the BIC complex remain intact upon deposition on APS mica.
Figure 1.
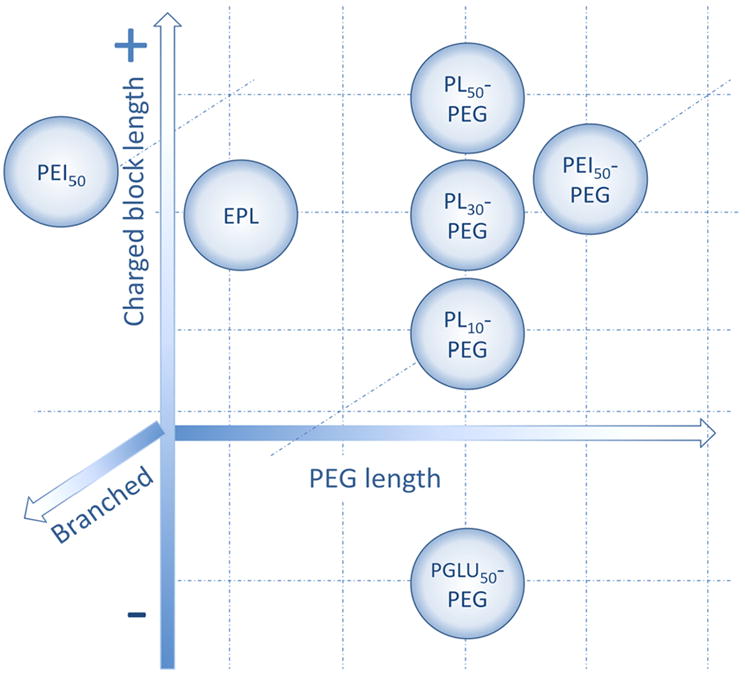
A pictorial scheme of different block copolymers used in this study. EPL: ε-polylisine; PEG: Polyethylene glycol; PEI: Polyethyleneimine; PGLU: Poly(L-glutalic) acid; PL: poly(L-lysine).
The hydrodynamic size (size) and surface charge (ζ-potential) of the formulations were determined by DLS (Table 2). Particles of naked catalase showed a small size (10.3 nm) with low polydispersity index (PdI), which was close to the theoretical diameter (10.5 nm) of a single protein globule calculated from the molecular mass of the enzyme [28]. An increase in the size of BICs (compared to naked catalase) accompanied by a decrease in negative charge to nearly electroneutral for all BICs obtained with positively-charged block copolymers confirmed the formation of complexes (Table 2). A slightly larger diameter was recorded for the nanozyme obtained with the negatively-charged block copolymer, PGLU50-PEG, which is consistent with what was observed for AFM (Figure 1). Moreover, aggregation of naked catalase on positively-charged mica was now seen in freshly prepared water solutions, as demonstrated by DLS studies (Table 2).
Table 2.
Diameter of different nanozyme particles measured by DLS (Z=1)
| Nanozyme | Size (nm) |
PdIa | ξ-potential (mV) | |
|---|---|---|---|---|
| Freshly prepared | 7 days | |||
| catalase | 10.3 ± 0.1 | 55.0 ± 0.2 | 0.1 ± 0.01 | -13.2 ± 0.4 |
| PEI50/catalase | 11.7 ± 0.1 | 13.6 ± 0.1 | 0.2 ± 0.02 | -7.4 ± 0.4 |
| PEI50-PEG/catalase | 14.4 ± 0.1 | 19.5 ± 0.2 | 0.2 ± 0.01 | -0.82 ± 0.18 |
| PL10-PEG/catalase | 14.7 ± 0.2 | 345 | 0.2 ± 0.03 | -2.8 ± 0.1 |
| PL30-PEG/catalase | 23 | 425 | 0.2 ± 0.03 | n/d |
| PL50-PEG/catalase | 16.5 ± 0.1 | n/d | 0.2 ± 0.01 | -0.79 ± 0.005 |
| EPL/catalase | 10.9 ± 0.1 | 52.1 ± 0.3 | 0.14 ± 0.02 | -4.1 ± 0.1 |
| PGLU50-PEG/catalase | 19.3 ± 0.06 | n/d | 0.2 ± 0.01 | -13.9 ± 0.8 |
The PDI values refers to freshly prepared solutions.
Formation of BIC resulted in improved aggregation stability. Thus, substantial aggregation of naked catalase was recorded over seven days (Table 2). In contrast, all nanozymes (with the exception of EPL/catalase) showed stable nanoparticles with the low polydispersity index and size. We hypothesized that the absence of a PEG corona along with lack of additional charges on the surface of nanozyme obtained with linear EPL polymer may result in low aggregation nanozyme stability. The latter may not be the case when branched PEI50 polymer was used (Table 2). The diameter of all nanozyme particles was below 20 nm, suggesting that they are suitable for loading into the cell-carriers. EPL/catalase nanozyme was least appropriate for this purpose due to the low aggregation stability in water solutions.
Cytotoxicity of Nanozymes
Possible toxic effects of polymers alone and in the complex with catalase (nanozymes) were evaluated in BMM (cell-carriers), CATH.a neurons, and BBMEC monolayers (as an in vitro model of BBB) (Table 3). The last cell model was used in suggestion that a portion of the nanozyme loaded into BMM and injected intravenously may be released from the cell-carriers in the blood stream and crosses the BBB independently [9]. As expected, BBMEC were more resistant to the toxic effects of the catalase formulations with block copolymers than monocytes, which are known to have greater rate of uptake than endothelial cells. Cytotoxicity effects of nanozymes in CATH.a neurons were overall similar to the effects in monocytes, although neurons were slightly less vulnerable than BMM. Overall, the possible toxic effects of nanozymes in BMM (but not in endothelial cells or neurons) raise the major concern for the cell-mediated drug delivery system.
Table 3.
Cytotoxicity of catalase nanozymes (Z=1) in vitro
| Formulation |
IC50, mg/ml a |
||
|---|---|---|---|
| BMM | BBMEC | CATH.a | |
| PEI50 | 0.4 ± 0.1 | > 3 ± 0.1 | 1.7 ± 0.1 |
| PEI50-PEG | 2 ± 0.1 | > 3 ± 0.1 | > 3 ± 0.1 |
| PL10-PEG | 0.4 ± 0.07 | 1 ± 0.1 | 0.3 ± 0.05 |
| PL30-PEG | 0.02 ± 0.03 | 0.2 ± 0.02 | 0.045 ± 0.09 |
| PL50-PEG | 0.01 ± 0.05 | 0.15 ± 0.02 | 0.03 ± 0.06 |
| EPL | 2 ± 0.1 | > 3 ± 0.1 | 1.5 ± 0.1 |
| PGLU50-PEG | 2 ± 0.2 | > 5 ± 0.1 | 1 ± 0.1 |
| PEI50/catalase | 0.7 ± 0.2 | > 3 ± 0.1 | 2 ± 0.1 |
| PEI50-PEG/catalase | >3 ± 0.05 | > 3 ± 0.1 | > 3 ± 0.1 |
| PL10-PEG/catalase | 0.5 ± 0.07 | 2 ± 0.1 | 0.4 ± 0.01 |
| PL30-PEG/catalase | 0.04 ± 0.001 | 0.18 ± 0.02 | 0.06 ± 0.001 |
| PL50-PEG/catalase | 0.03 ± 0.001 | 0.2 ± 0.05 | 0.02 ± 0.001 |
| EPL/catalase | 0.2 ± 0.05 | > 3 ± 0.1 | 0.9 ± 0.1 |
| PGLU50-PEG/catalase | > 5 ± 0.1 | > 5 ± 0.2 | > 3 ± 0.2 |
The IC50 values refer to polymer concentration in treatment solutions. No toxicity of catalase alone was observed at concentrations up to 6 mg/ml.
Catalase alone did not induce any cytotoxicity in BMM and BBMEC over a wide range of concentrations (0.03 to 6,000 μg catalase/ ml) (Table 3). The toxicity of a block copolymer alone was greater than its corresponding nanozyme for all cell types, suggesting that the binding of the polymer to catalase decreases its toxicity. Negatively-charged block copolymer PGLU50-PEG (as well as its corresponding nanozyme) has significantly less toxicity than formulations with positively-charged polymers likely linked to the overall negative charge of the outer plasma membrane resulting in the efficient absorption and internalization of the positively-charged block copolymers and cell-associated nanoparticles [29]. The same reason (i.e. better interactions between longer PL blocks and cellular membranes, as opposed to shorter PL blocks) may cause a greater polymer and nanozyme cytotoxicity with increasing of the length of PL block (PL10-PEG < PL30-PEG < PL50-PEG, Table 3). Thus, it is known that PEI (and especially PL) has considerable toxicity, especially at high concentrations [30]. Surprisingly, EPL alone showed very low toxicity in a wide range of concentrations in all cell lines, although toxic effects of the EPL-based nanozyme were much greater, probably due to their aggregation over time (Table 2). Furthermore, branched (PEI-) based polymers caused less toxicity in all cell types than linear (PL-) based polymers with comparable length of a polyion block (PEI50-PEG < PL50-PEG). As expected, addition of PEG block significantly decreased cytotoxicity of catalase formulations with branched block copolymers (PEI50 is more toxic than PEI50-PEG nanozymes, Table 3). In summary, the nanozymes with the least cytotoxicity are EPL-, and PGLU50-PEG-based, followed in ascending order by PEI50-PEG, PEI50, PL10-PEG, PL30-PEG, and PL50-PEG.
Loading and Release of Nanozymes from BMM
To achieve successful cell-mediated delivery, nanozymes should be loaded at high concentrations and then released upon the cell’s arrival at the site of action or disease. To this end, macrophages were exposed to a broad range of RITC-labeled nanozymes and the enzyme cellular levels were determined. First, the accumulation kinetics of some representative nanozymes (Z=1) shown on Figure 2 A, suggest a rapid uptake (approximately 30-40 minutes) of catalase into the cells. Loading capacity of nanozymes comprising of positively-charged mono-polymers without PEG corona (PEI50- and EPL-based) was greater than “naked” catalase, probably due to increased absorption and internalization of positively-charged nanoparticles into BMM. Next, the nanozyme prepared with negatively-charged block copolymer, PGLU50-PEG, was taken at almost the same levels as “naked” catalase. Furthermore, the lowest uptake was recorded for nanozymes based on positively-charged block-copolymers with PEG corona, especially poly-lysine with a long cationic block, PL50-PEG. Similar results were obtained with 125I-labeled nanozyme precipitated by TCA (Figure 2 B) confirming that observed dependences reflect actual catalase accumulation levels. Finally, the loading capacities for different nanozymes with various Z ratios were studied in BMM and expressed as a percentage of accumulation levels of nanozyme vs. catalase alone (Table 4). Notably, the formation of BIC significantly reduced the amount of nanozyme taken by the cells as the charge ratio increased (Table 4). To this end, the most attractive nanozymes from the cell-mediated delivery standpoint are those with low Z ratios.
Figure 2.
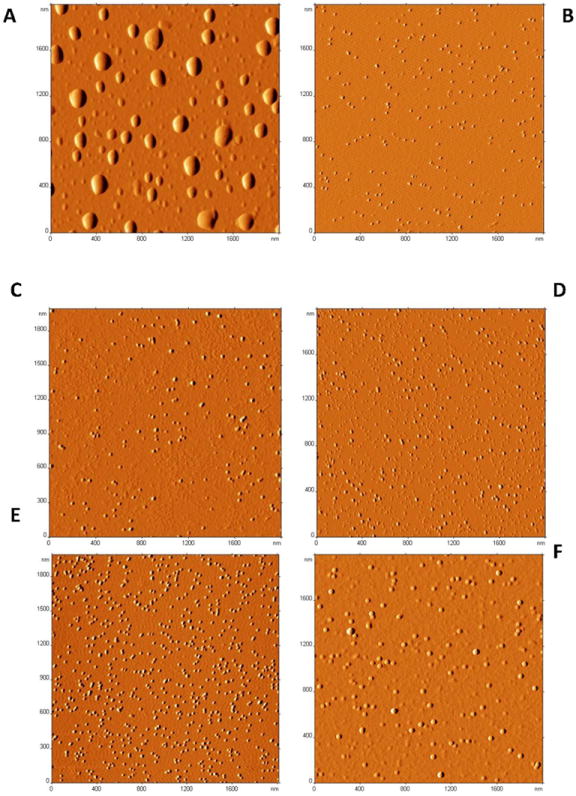
AFM images of naked catalase (A) and different catalase nanozymes (Z=1): PEI50-PEG/catalase (B); PL10-PEG/catalase (C); PEI50/catalase (D); PL50-PEG/catalase (E); and PGLU50-PEG/catalase (F). Nanozymes were prepared at an enzyme concentration of 1 mg/mL, and then diluted 100 times in PBS prior to the application on positively charged mica (APS) for 2 minutes, washed with deionized water and dried under an argon flow. Images revealed sharp differences between large aggregates of naked catalase and spherical particles with size corresponding to a single catalase globule in case of nanozymes.
Table 4.
Loading of catalase nanozymes into BMMa in serum-free media
| Z ratio | Polymer | ||||||
|---|---|---|---|---|---|---|---|
| PEI50 | PEI50-PEG | PL10-PEG | PL30-PEG | PL50-PEG | EPL | PGLU50-PEG | |
| 0.5 | 123 ± 2 (**) | 100 ± 5 (ns) | 99 ± 4 (ns) | 87 ± 2 (*) | 81 ± 2 (*) | 115.5 ± 2 (**) | 100.1 ± 2 (ns) |
| 1 | 120 ± 2 (*) | 85 ± 3 (*) | 58± 4 (*) | 79 ± 1 (*) | 34 ± 4 (**) | 112.2 ± 1 (*) | 100.2 ± 3 (ns) |
| 2 | 110 ± 2 (ns) | 73 ± 2 (*) | 51 ± 2 (**) | 72 ± 2 (*) | 20 ± 4 (**) | 117.5 ± 2 (**) | 87.1 ± 3 (*) |
| 5 | 113 ± 1 (*) | 73 ± 3 (*) | 42 ± 2 (**) | 45 ± 2 (**) | 21± 3 (**) | 116.0 ± 1 (**) | 78.6 ± 1 (*) |
| 10 | 110 ± 2 (ns) | 75 ± 1 (*) | n/db | n/db | n/db | 100.9 ± 2 (ns) | 79 ± 1 (*) |
| 20 | 66 ± 1 (**) | 68 ± 2 (*) | n/db | n/db | n/db | 111.4 ± 3 (*) | 73 ± 2 (*) |
Loading is expressed as a % of nanozyme vs. catalase alone accumulation levels
Nanozymes with high Z ratios were not examined due to their toxicity to BMM
Statistical significance is shown by symbols: p<0.005 (¶), p<0.05 (§), and non-significant (#) compared with accumulation levels of catalase alone at the same time point.
Based on loading capacity, nanozymes with low Z ratios (Z=1) were chosen for release studies. Mature BMM were pre-loaded with RITC-labeled catalase nanozymes (2 hrs) and then cultured in fresh media for different time intervals. The kinetics of release of some representative nanozymes (Z=1) is shown on Figure 3, indicating that loaded BMM released catalase in the external media for at least 10 days. In consistence with accumulation studies, the greatest levels of catalase in the media were recorded when cells were loaded with EPL- and PEI50-based nanozymes. Nanozymes with a PEG corona showed a decreased amount of unloaded catalase compared to “naked” enzyme. The release for all nanozymes (Z=1) was expressed as a percentage of RITC-labeled catalase in the media when cells were loaded with nanozyme vs. those when cells were loaded with naked catalase is shown in Table 1S. Basically, the amount of released nanozymes ranked in the same order as for loading capacity studies, suggesting that the more nanoparticles accumulated in the cells, the more they released later. However, interactions with the membranes may also play an essential role. Thus, negative particles may be released faster due to fewer interactions with cell membranes. Polymers for BIC providing effective BMM loading and release of nanozymes ranked in order from most to least are EPL, PEI50, PGLU50-PEG, PEI50-PEG, PL10-PEG, PL30-PEG, and PL50-PEG.
Figure 3.
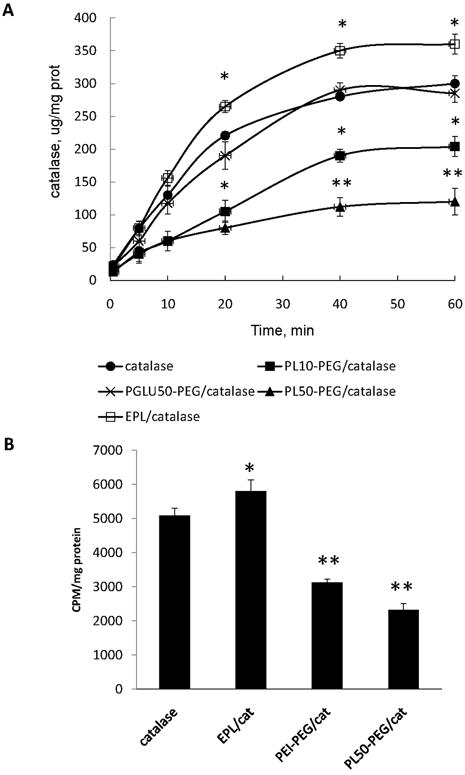
Effect of block copolymer structure on catalase nanozyme uptake in BMM. A) Kinetics of representative catalase nanozymes (Z = 1) accumulation in BMM: PL50-PEG/catalase (filled squares); PL10-PEG/catalase (filled diamonds); PGLU50-PEG/catalase (filled triangles); EPL/catalase (empty squares); catalase alone (empty circles). B) Accumulation of representative catalase nanozymes (Z = 1) in BMM. Cells were treated with (A) the RITC-labeled enzyme (1 mg/ml) in assay buffer alone or different nanozymes for various time points or (B) 125I-labeled enzyme or nanozymes for one hour. Following incubation, (A) the cells were washed three times with ice-cold PBS, solubilized in Triton X100 (1%), and the amount of fluorescence was measured by fluorescent spectrophotometer (λex=488 nm, λem=510 nm), or (B) the cellular content was precipitated by TCA, and the amount of radioactivity in the precipitate was measured by radioactivity counter. Results from N=8 wells (± SEM) demonstrating significant increase in accumulation of nanozyme without PEG corona; decrease of nanozyme obtained with PEG and positively-charged block copolymer, and no effect on nanozyme comprised of PEG and negatively-charged block copolymer, compared to “naked” catalase. Statistical significance is shown by asterisk: p<0.05 (*), and p<0.005 (**).
Nanozyme Catalytic Activity
First, the effect of complex formation on catalase activity was examined in a cell-free system by an Amplex Red assay (Figure 4). Obtained results clearly indicate that the catalase activity was slightly increased upon formation of BIC obtained with PEG-containing block copolymers; the larger the Z ratio in BIC, the greater the increase. Similar effect was reported earlier for another enzyme, lysozyme, incorporated into BIC with poly(ethylene glycol)-poly(alpha, beta-aspartic acid) block copolymers [31]. Thus, enzyme-incorporated nanoparticles showed increased activity and stability in the water solutions. Interestingly, in the case of mono-polymer without PEG block the catalase enzymatic activity was decreased. This was more pronounced with the larger Z ratios (Figure 4). These results were consistent with the data obtained by spectrophotometric assay (Table 2S). For catalase alone (2.8 nM) the obtained apparent Michaelis–Menten constant (Km) and kcat values were 82 mM and 2.86 × 10⁵ s-1, respectively, that are in agreement with [32]. Nanozymes obtained with PEG-containing block copolymers showed increased catalytic activity compared to “naked” catalase. Particularly high catalytic activity was observed for PEI50-PEG/catalase, Z=10, probably due to the improving substrate-enzyme interactions, in accordance with the increases of the maximum velocity (Vm, Table 2S). Oppositely, nanozymes without PEG corona have lower enzymatic activity than catalase alone. Observed changes in enzymatic activity were small, but statistically significant.
Figure 4.
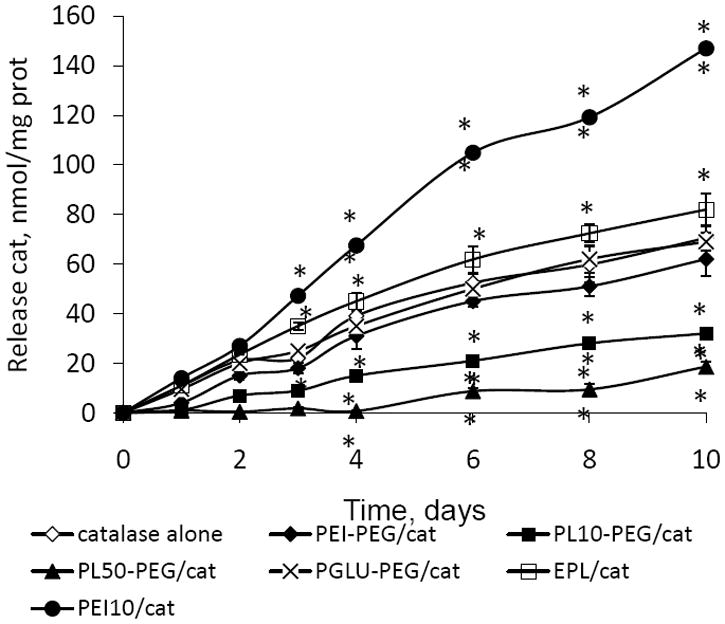
Release profile of different nanozymes from BMM: PL50-PEG/catalase (filled triangles); PL10-PEG/catalase (filled squares); PEI50-PEG (filled diamonds); PGLU50-PEG/catalase (crosses); catalase alone (empty diamonds). Cells were loaded with RITC-labeled catalase/block copolymer complex (1 mg/ml, Z = 1) for two hours, washed with PBS, and incubated with catalase-free media for various time intervals. Then, the media was collected and fluorescence in the each sample was accounted by fluorescent spectrophotometry as described in Figure 2 legend. The amount of the released RITC-labeled nanozyme was normalized for protein content and expressed in μg enzyme per ml media. Results from N=8 wells (± SEM) demonstrating significant increase in release of nanozyme without PEG corona; decrease of nanozyme obtained with PEG and positively-charged block copolymer, and no effect on nanozyme comprised of PEG and negatively-charged block copolymer, compared to “naked” catalase. Statistical significance is shown by asterisk: p<0.05 (*), and p<0.005 (**).
Furthermore, incorporation of catalase into BIC with a block copolymer drastically increased stability of catalase against a mixture of proteinases (pronase) (Figure 5). Thus, 50-90% of the enzyme was preserved in nanozyme formulations, when only 10% of naked catalase was active after incubation with pronase. Increasing of Z ratio in BIC resulted in the increase of catalase protection for PEG-containing nanozymes and decrease of protection in non-PEG containing BIC (Figure 5). These results were in consistence with the data obtained by EPR. The stabilization of catalase in BIC was assessed over different time intervals (Table 5). As is seen, catalase was almost completely inactive at 150 minutes. Low concentration of catalase (250 ng/mL) and EPR buffer are likely to cause such low stability of the enzyme. Oppositely, catalase in PEI50-PEG, PL10-PEG, and PGLU50-PEG-containing nanozymes was preserved up to 98% of the initial activity. The best stabilization effect was recorded for PL10-PEG/catalase nanozyme. Overall, increasing catalase stability is crucial for the protection of nanozymes inside the cell-carriers.
Figure 5.
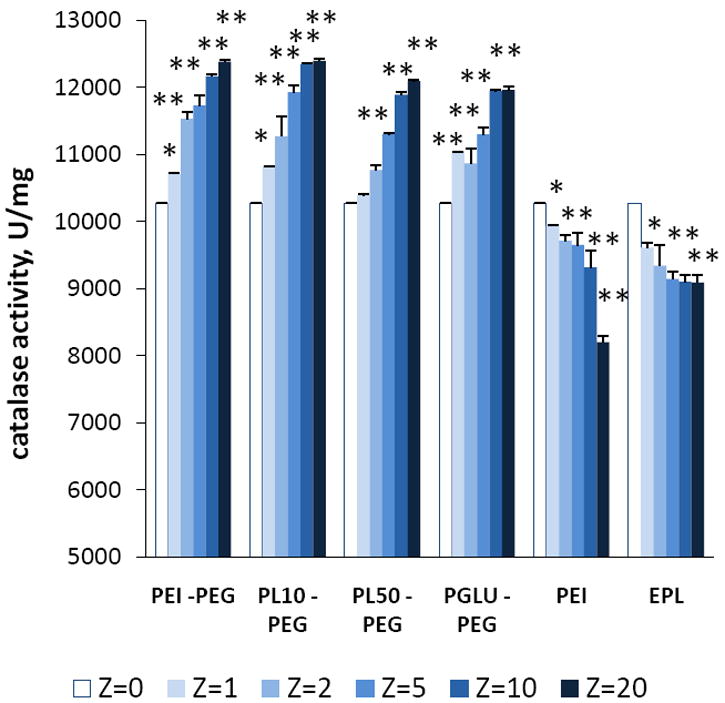
Effect of the amount of block copolymer in BIC on enzymatic activity of catalase in different BIC determined by hydrogen peroxide decomposition. The catalase activities were measured by spectrophotometry. In particular, 1-4 μL H2O2 (7.5 – 30 % v/w), and 2 μL catalase (0.06 - 0.5 mg/ml) or various nanozymes with different Z ratios were added into a cuvette with 1 mL PBS, and the changes in absorbance at 240 nm were monitored. Incorporation of catalase into polyelectrolyte complex resulted in a significant increase of catalase activity in PEG-containing nanozymes, and decrease in non-PEG nanozymes. Values are means ± SEM (N = 8), P<0.05 (*) and P<0.005 (**) compared with naked catalase.
Table 5.
| Formulation | Z ratio | Incubation time |
||
|---|---|---|---|---|
| 50 min | 100 min | 150 min | ||
| Catalase alonec | 0 | 35.1 ± 2 | 6.8 ± 1 | 3.1 ± 0.1 |
| PEI50-PEG/catalase | 1 | 47.4 ± 1 (ns) | 33.7 ± 1 (**) | 15.8 ± 3 (**) |
| 10 | 67.5 ± 4 (**) | 78.9 ± 8 (**) | 77.2 ± 6 (**) | |
| 20 | 68.9 ± 3 (**) | 88.4 ± 3 (**) | 81.4 ± 4 (**) | |
| PL10-PEG/catalase | 1 | 68.2 ± 4 (*) | 61.4 ± 3 (**) | 57.7 ± 4 (**) |
| 10 | 88.2 ± 2 (**) | 89.9 ± 3 (**) | 79.0 ± 3 (**) | |
| 20 | 93.9 ± 6 (**) | 97.4 ± 8 (**) | 91.5 ± 5 (**) | |
| PGLU50-PEG/catalase | 1 | 49.5 ± 2 (ns) | 46.0 ± 3 (**) | 57.9 ± 4 (**) |
| 10 | 85.8 ± 4 (**) | 82.1± 3 (**) | 78.4 ± 3 (**) | |
| 20 | 97.8 ± 5 (**) | 91.2 ± 8 (**) | 80.1 ± 3 (**) | |
Activity of each nanozyme is expressed as a % of residual catalase activity vs. initial activity at 0 time point
Statistical significance is shown by asterisk: p<0.05 (*), and p<0.005 (**) compared with residual activity of catalase alone at the same time point.
Catalase concentration was 250 ng/mL
Finally, the ability of different catalase nanozymes to eliminate ROS produced by activated BMM was examined (Figure 6). BMM incubated with LPS and γ-INF in this experiment was utilized as a model of activated microglia in the brain with PD. The maximal activity of nanozymes was observed for BIC obtained with positively-charged block copolymers: PLs-PEG and PEI50-PEG. Nanozyme based on PGLU50-PEG showed almost the same activity as catalase alone. This suggests that interaction of catalase with positively-charged block copolymers stabilized the enzyme in a cellular system, and as a result, increased its efficiency to deactivate ROS. No effect on the amount of ROS was found for any polymer alone (without catalase). The increased amount of the block copolymer in the BIC (at Z ratios ≥ 2) slightly amplified ROS decomposition rate in activated BMM (Table 3S), probably due to both increasing enzymatic activity and stability of catalase in BIC. In summary, the nanozymes with the highest catalytic activity are those based on positively-charged PEG-containing BIC: PEI50-PEG, PL10-PEG, PL30-PEG, and PL50-PEG, followed in descending order by PGLU50-PEG, and the least, EPL, and PEI50-based nanozymes.
Figure 6.
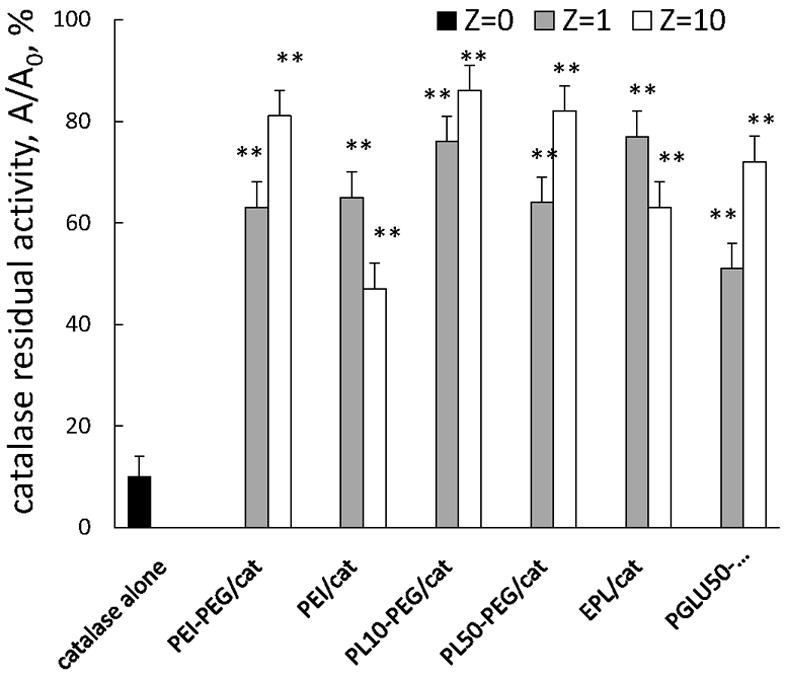
Preservation of catalase enzymatic activity in selected nanozymes. The stability of catalase in BIC was examined upon incubation of different nanozymes (0.5 mg/ml catalase) with trypsin (10-5 M), or pronase (2×10⁻¹ mg/ml) for 3 hours at 37°C. Following incubation, the aliquots were subjected for catalytic activity assessment as described in Figure 4 legend. A residual activity of catalase is expressed as a ratio of enzyme activity after 3h of incubation in the presence of pronase at 37°C to the initial one (at time point 0). Results from N=4 experiments (± SEM) demonstrating that incorporation of catalase into BIC with all studied polymer (with and without PEG) drastically increased stability of catalase against a mixture of proteinases (pronase). Statistical significance is shown by asterisk: P<0.005 (**) compared to “naked” catalase.
Preservation of Catalase Enzymatic Activity in BMM
The ability of various polyion complexes to protect the enzymatic activity of catalase inside the cell-carriers was assayed. Mature mouse BMM (grown on 24-well plates) were loaded with catalase alone or catalase nanozyme (Z = 1, 2, and 5) for 2 hours, then cells were washed with PBS and supplemented with fresh media. Two hours later, the media was collected and the activity of catalase released from BMM was determined by the rate of hydrogen peroxide decomposition (Figure 7). The results clearly indicate that all nanozymes with PEG corona comprising of positively-charged block copolymers showed efficient protection of catalase inside macrophages compared to catalase loaded alone. Increasing the amount of the block copolymer in the BIC leaded to better protection of the enzyme; activity of catalase in the complexes at Z = 5 was greater than at Z = 2 and 1. Interestingly, catalase loaded in a polyion complex with PGLU50-PEG was degraded in BMM to an even greater extent than “naked” enzyme (Figure 7). The most unpredictable effect was obtained with nanozymes based on positively-charged homopolymers PEI50 and EPL without PEG corona. Both of them showed very little, if any, protection of catalase activity. Furthermore, in contrast to PEG-containing nanozymes, increasing the polymer amount in BIC resulted in the decreasing of catalase activity.
Figure 7.
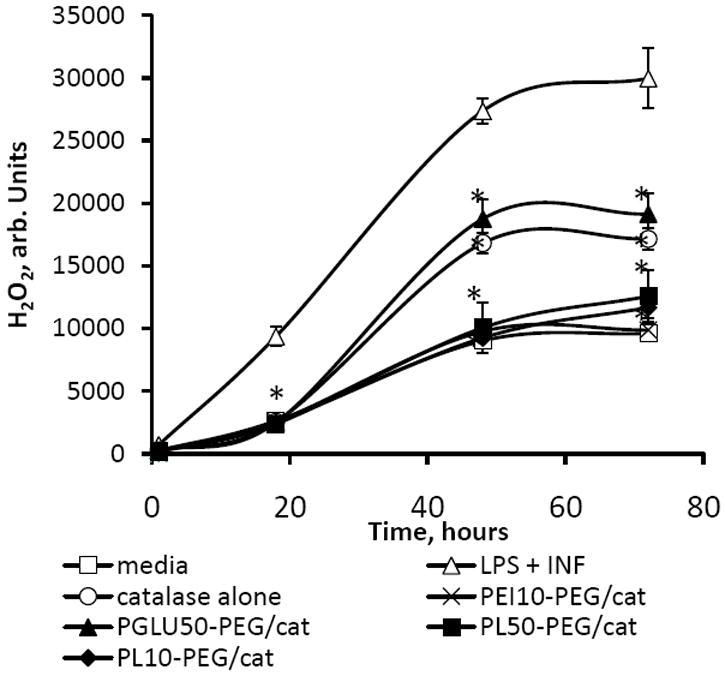
Modulation of BMM-derived ROS by catalase nanozymes (Z = 1). BMM were stimulated with LPS (20 ng/ml) and γ-INF 2 (μg/ml) for 24 hours, and then the media was supplemented with: catalase alone (empty circles); PL50-PEG/catalase (filled squares); PL10-PEG/catalase (filled diamonds); PEI50-PEG (crosses); PGLU50-PEG/catalase (filled triangles); fresh media (empty triangles). Control non-activated BMM were incubated with fresh media (empty squares). Then cell media was supplemented with Amplex Red Dye stock solution (10 U/mL HRP, 10 mM Ampex Red) for 30 minute, and the amount of H2O2 produced by BMM and decomposed by catalase nanozymes was measured by fluorescence at λex=563 nm, λem=587 nm. The maximal activity of nanozymes was observed for BIC obtained with positively-charged block copolymers. Data represent means ± SEM (N = 8). Statistical significance of the amount of H2O2 decomposed by nanozyme or catalase, compared to activated microglia is shown by asterisks: (*) p<0.05, (**) p<0.005.
We hypothesize that the protection of enzymatic activity inside carrier cells may be, at least in part, due to a “proton sponge” effect of block copolymers. An excess of aminogroups on the surface of the nanoparticles buffers acidification of the endocytic compartments in the macrophages, thereby inhibiting proteases activity and consequently decreasing degradation of the drug [33]. In other words, a positively-charged block-copolymer might delay phagosomal maturation and as a result prevent degradation of the enzyme in BMM. Oppositely, PGLU50-PEG block copolymer brings additional protons, further decreasing pH in the endosomes and resulting in even greater proteolysis of catalase. To confirm this hypothesis, we examined the effect of different catalase nanozymes on the intracellular pH in BMM using LysoSensor Yellow/Blue dye by confocal microscopy (Figure 8). This dye exhibits the pH-dependent dual-emission spectra in living cells. In acidic organelles it has predominantly yellow fluorescence, and in less acidic organelles it has blue fluorescence. Mature mouse BMM (grown on slides) were loaded with RITC-labeled catalase alone or nanozymes (Z = 5) for 2 hours, washed with PBS, and stained with LysoSensor dye. The confocal images indicate that PEI50-PEG/catalase, as well as PEI50/catalase (Figures 8 B and C), substantially increased the pH. The PL-containing nanozymes (PL10-PEG/catalase and EPL/catalase, Figures 8 E and F) showed less effect (Figure 8A). Interestingly, loading the cells with PGLU50-PEG/catalase nanozyme (Figure 8D) resulted in further decreases in endosomal pH manifested in bright yellow staining that may result in faster catalase decomposition. This could not explain the lack of the catalase protection in case of non-PEG nanozymes, PEI50/catalase, and EPL/catalase. Hence, decreases in the enzymatic activity of these nanozymes and increases in Km in cell-free system (Figure 4, and Table 2S) might be a reason for this unexpected behavior. Furthermore, the trafficking and intracellular localization of nanoparticles without PEG corona might differ from those with PEG. For example, accumulation of nanozymes in lysosomes would result in greater catalase degradation than in early endosomes. Detailed investigation of the entry and accumulation mechanism for different nanozymes in BMM is ongoing in our lab. In summary, the most efficient protection was demonstrated with positively-charged PEG-containing block copolymers, PEI50-PEG, PL50-PEG, PL30-PEG, and PL10-PEG. The nanozymes based on negatively-charged PGLU50-PEG, as well as homopolymers PEI50 and EPL were less suitable.
Figure 8.
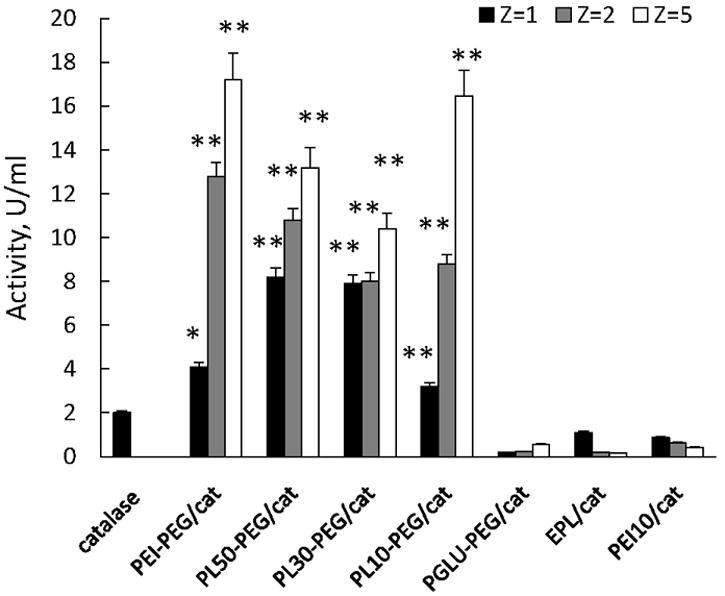
Preservation of enzymatic activity of catalase against degradation in BMM. “Naked” catalase (first bar) or different nanozymes (Z = 1, 2, or 5) were loaded into BMM, cells were washed and incubated with catalase-free media for two hours. Then, the media was collected, and the activity of catalase released from BMM was accounted by spectrophotometry as described in Figure 4 legend. All nanozymes with PEG corona comprising of positively-charged block copolymers showed efficient protection of catalase inside macrophages compared to catalase loaded alone. Increasing of the amount of the block copolymer in the BIC leaded to better protection of the enzyme. In contrast, nanozymes based on positively-charged monopolymers without PEG corona, or negatively-charged block copolymer did not protect catalase inside the host cells. Data represent means ± SEM (N = 4). Statistical significance of nanozyme activity compared to catalase alone is shown by asterisks: (*) p<0.05, (**) p<0.005.
Overall we demonstrate that the structure and composition of protective nanocontainers play a crucial role in the therapeutic efficacy of drug formulations. This is particularly important in the case of cell-mediated drug delivery, when nanoparticles are to be loaded into living cells.
CONCLUSIONS
The best formulations for cell-mediated delivery of nanozymes would have limited cytotoxicity, high loading and release capacities, and efficient preservation of catalase enzymatic activity. To this end, we observed that nanozymes containing a negatively-charged block copolymer (PGLU50-PEG/catalase) demonstrated low toxicity, high loading capacity and release from BMM, however provides limited protection of the enzyme against protease degradation inside cells. In contrast, nanozymes based on positively charged block copolymers, especially the PLs, showed increased cytotoxicity and low loading and release rates, but were highly protective of catalase. Importantly, nanozymes with PEG corona show good stability in water, limited cytoxicity and efficient protection of catalase. Nonetheless, these formulations also demonstrated decreased loading capacity and cell release. Increasing the Z ratio in BIC leads to better protection of catalase enzymatic activity inside BMM, but substantially reduced loadings and release. In addition, nanozymes based on mono-polymer (without PEG corona) have higher loading and release levels, but formation of BIC with these polymers significantly decreased catalase activity in cell-free systems and, especially, inside the macrophages. Taken together, the most optimal nanozyme formulation is one based on positively charged block copolymers (PEI50-PEG/catalase and PL10-PEG/catalase) that demonstrate the most efficient protection of catalase enzymatic activity along with relatively high loading and release rates and limited cytotoxicity. Certainly, animal studies of catalase nanozymes in models of human disease would provide ultimate verification.
Supplementary Material
Figure 9.
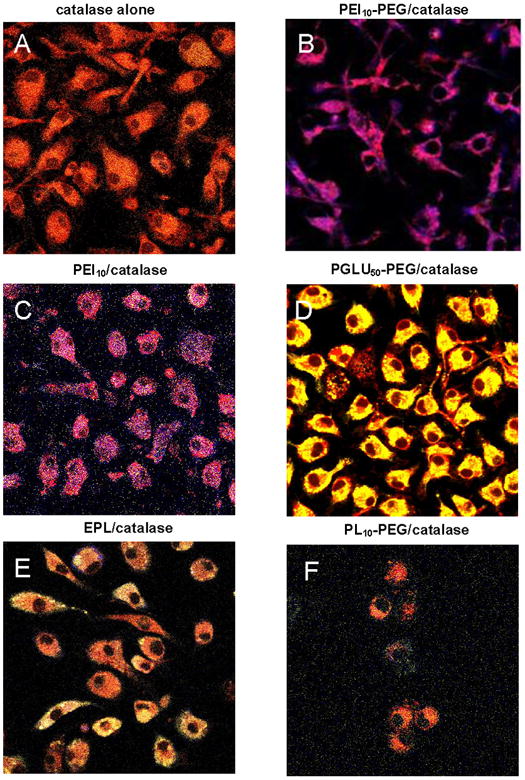
Effect of catalase nanozymes on endosomal acidification in BMM. Mature mouse BMM were loaded with RITC-labeled catalase alone (A) or nanozymes (1 mg/ml, Z = 5); PEI50-PEG/catalase (B); PEI50/catalase (C), PGLU50-PEG/catalase (D), EPL/catalase (E), or PL10-PEG/catalase (F) for two hours, washed with PBS, and stained with 1 μM LysoSensor dye. Confocal images indicate that nanozymes comprising of catalase and positively-charged polymers, especially, with PEI block, substantially increased the pH in the compartments containing catalase. Oppositely, loading of BMM with negatively-charged containing nanozyme resulted in further decreases in endosomal pH compared to “naked” catalase.
Figure 10.
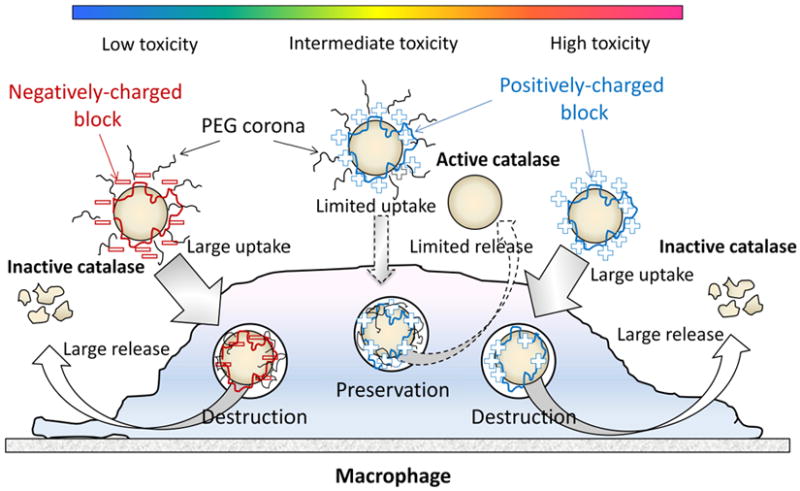
A pictoral scheme for different nanozyme structures evaluated for cell-mediated drug delivery. Three types of catalase nanozymes: Nanozyme I: contaning a negatively cherged block copolymer (with PEG) showed low toxicity, high loading capacity and sustained release from BMMs, but limited enzyme protection inside cell carriers; Nanozyme II: containing positively charged block copolymers (with PEG) showed increased cytotoxicity and low loading and release rates, but high level of nanozyme protection ; Nanozymes III: containing monopolymers (without PEG corona) showed higher loading and release rates, but low enzyme protection inside BMMs along with decreased catalase activity in cell-free system. The optimal nanozyme formulation selected from nanozyme II group is based on positively-charged block copolymers (PEI48-PEG/catalase and PL10-PEG/catalase) that demonstrate efficient protection of catalase enzymatic activity along with relatively high loading and release rates and limited cytotoxicity.
Acknowledgments
This study was supported by the National Institutes of Health grants 1RO1 NS057748 (to EVB), 2R01 NS034239, 2R37 NS36126, P01 NS31492, P20RR 15635, P01 MH64570, P01 NS43985 (to HEG), RR021937 (to AVK), and Russian Ministry of Science and Education grant 02.740.11.5232 (to NLK) . We are grateful to Janice A. Taylor and James R. Talaska (Confocal Laser Scanning Microscope Core Facility, UNMC) for providing assistance with confocal microscopy and the Nebraska Research Initiative and the Eppley Cancer Center for their support of the Core Facility, Lyudmila Shlyakhtenko for assistance with AFM studies, and Tatyana Kasperovich for the text editing.
References
- 1*.Nowacek As, Miller Rl, Mcmillan J, et al. Nanoart synthesis, characterization, uptake, release and toxicology for human monocyte-macrophage drug delivery. Nanomed. 2009;4(8):903–917. doi: 10.2217/nnm.09.71. of interest: This study described characterization of nanoformulated antiretroviral drugs for HIV-1 infection and its application for human cell-mediated drug delivery. [DOI] [PMC free article] [PubMed] [Google Scholar]
- 2.Daleke Dl, Hong K, Papahadjopoulos D. Endocytosis of liposomes by macrophages: Binding, acidification and leakage of liposomes monitored by a new fluorescence assay. Biochim Biophys Acta. 1990;1024(2):352–366. doi: 10.1016/0005-2736(90)90365-u. [DOI] [PubMed] [Google Scholar]
- 3.Fujiwara M, Baldeschwieler Jd, Grubbs Rh. Receptor-mediated endocytosis of poly(acrylic acid)-conjugated liposomes by macrophages. Biochim Biophys Acta. 1996;1278(1):59–67. doi: 10.1016/0005-2736(95)00183-2. [DOI] [PubMed] [Google Scholar]
- 4.Jain S, Mishra V, Singh P, Dubey Pk, Saraf Dk, Vyas Sp. Rgd-anchored magnetic liposomes for monocytes/neutrophils-mediated brain targeting. Int J Pharm. 2003;261(1-2):43–55. doi: 10.1016/s0378-5173(03)00269-2. [DOI] [PubMed] [Google Scholar]
- 5.Khan Ma, Jabeen R, Nasti Th, Mohammad O. Enhanced anticryptococcal activity of chloroquine in phosphatidylserine-containing liposomes in a murine model. J Antimicrob Chemother. 2005;55(2):223–228. doi: 10.1093/jac/dkh522. [DOI] [PubMed] [Google Scholar]
- 6.Perry Vh, Bell Md, Brown Hc, Matyszak Mk. Inflammation in the nervous system. Curr Opin Neurobiol. 1995;5(5):636–641. doi: 10.1016/0959-4388(95)80069-7. [DOI] [PubMed] [Google Scholar]
- 7.Kuby J. Immunology. Freeman, WH. and Co.; New York: 1994. [Google Scholar]
- 8**.Batrakova Ev, Li S, Reynolds Ad, et al. A macrophage-nanozyme delivery system for parkinson’s disease. Bioconjug Chem. 2007;18(5):1498–1506. doi: 10.1021/bc700184b. of considerable interest: This manuscript reported development and characterization of cell-mediated delivery system of antioxidant enzyme, catalase. Loading, release, and protection of enzymatic activity of catalase in bone marrow-derived monocytes (BMM) are evaluated in in vitro model of PD. [DOI] [PMC free article] [PubMed] [Google Scholar]
- 9**.Brynskikh Am, Zhao Y, Mosley Rl, et al. Macrophage delivery of therapeutic nanozymes in a murine model of parkinson’s disease. Nanomedicine (Lond) 2010;5(3):379–396. doi: 10.2217/nnm.10.7. of considerable interest: This study supports the feasibility of cell-mediated drug delivery to the brain by examining i) the nanozyme loading capacity for cell carriers; ii) the effect of nanozymes on cell viability and function; and iii) the neuroprotective activities of BMM-carried nanozyme against MPTP intoxication in in vivo model of PD. [DOI] [PMC free article] [PubMed] [Google Scholar]
- 10.Nguyen Hk, Lemieux P, Vinogradov Sv, et al. Evaluation of polyether-polyethyleneimine graft copolymers as gene transfer agents. Gene Ther. 2000;7(2):126–138. doi: 10.1038/sj.gt.3301052. [DOI] [PubMed] [Google Scholar]
- 11.Vinogradov S, Bronich T, Kabanov A. Self-assembly of polyamine-poly(ethylene glycol) copolymers with phosphorothioate oligonucleotides. Bioconjugate Chemistry. 1998;9(6):805–812. doi: 10.1021/bc980048q. [DOI] [PubMed] [Google Scholar]
- 12.Lyubchenko Yl, Shlyakhtenko Ls, Gall Aa. Atomic force microscopy imaging and probing of DNA, proteins, and protein DNA complexes: Silatrane surface chemistry. Methods Mol Biol. 2009;543:337–351. doi: 10.1007/978-1-60327-015-1_21. [DOI] [PubMed] [Google Scholar]
- 13.Henderson Rm, Schneider S, Li Q, Hornby D, White Sj, Oberleithner H. Imaging romk1 inwardly rectifying atp-sensitive k+ channel protein using atomic force microscopy. Proc Natl Acad Sci U S A. 1996;93(16):8756–8760. doi: 10.1073/pnas.93.16.8756. [DOI] [PMC free article] [PubMed] [Google Scholar]
- 14.Lushnikov Ay, Potaman Vn, Oussatcheva Ea, Sinden Rr, Lyubchenko Yl. DNA strand arrangement within the sfii-DNA complex: Atomic force microscopy analysis. Biochemistry. 2006;45(1):152–158. doi: 10.1021/bi051767c. [DOI] [PMC free article] [PubMed] [Google Scholar]
- 15.Bronich T, Nguyen H, Eisenberg A, Kabanov A. Recognition of DNA topology in reactions between plasmid DNA and cationic copolymers. Journal of American Chemical Society. 2000;122(35):8339–8343. [Google Scholar]
- 16.Vinogradov S, Batrakova E, Kabanov A. Poly(ethylene glycol)-polyethyleneimine nanogel (tm) particles: Novel drug delivery systems for antisense oligonucleotides. Colloids and Surfaces B-Biointerfaces. 1999;16(1-4):291–304. [Google Scholar]
- 17.Dou H, Destache Cj, Morehead Jr, et al. Development of a macrophage-based nanoparticle platform for antiretroviral drug delivery. Blood. 2006;108(8):2827–2835. doi: 10.1182/blood-2006-03-012534. [DOI] [PMC free article] [PubMed] [Google Scholar]
- 18.Srtevenson Hc, Fauci As. Purification of human monocytes by counter-current centrifugation elutriation. Marcel Decker Press; New York: 1981. [Google Scholar]
- 19.Weidenfeller C, Schrot S, Zozulya A, Galla Hj. Murine brain capillary endothelial cells exhibit improved barrier properties under the influence of hydrocortisone. Brain Res. 2005;1053(1-2):162–174. doi: 10.1016/j.brainres.2005.06.049. [DOI] [PubMed] [Google Scholar]
- 20.Batrakova E, Han H, Miller D, Kabanov A. Effects of pluronic p85 unimers and micelles on drug permeability in polarized bbmec and caco-2 cells. Pharm Res. 1998;15(10):1525–1532. doi: 10.1023/a:1011942814300. [DOI] [PubMed] [Google Scholar]
- 21.Ferrari M, Fornasiero M, Isetta A. Mtt colorimetric assay for testing macrophage cytotoxic activity in vitro. J Immunol Methods. 1990;131(2):165–172. doi: 10.1016/0022-1759(90)90187-z. [DOI] [PubMed] [Google Scholar]
- 22.Batrakova Ev, Vinogradov Sv, Robinson Sm, Niehoff Ml, Banks Wa, Kabanov Av. Polypeptide point modifications with fatty acid and amphiphilic block copolymers for enhanced brain delivery. Bioconjug Chem. 2005;16(4):793–802. doi: 10.1021/bc049730c. [DOI] [PMC free article] [PubMed] [Google Scholar]
- 23.Sanchez L. Tca protein precipitation. Protocols on line. 2001 [Google Scholar]
- 24.Nicholls P, Fita I, Loewen Pc. Enzymology and structure of catalases. Adv Inorg Chem. 2001;51:51–106. [Google Scholar]
- 25.Dikalov Si, Dikalova Ae, Bikineyeva At, Schmidt Hh, Harrison Dg, Griendling Kk. Distinct roles of nox1 and nox4 in basal and angiotensin ii-stimulated superoxide and hydrogen peroxide production. Free Radic Biol Med. 2008;45(9):1340–1351. doi: 10.1016/j.freeradbiomed.2008.08.013. [DOI] [PMC free article] [PubMed] [Google Scholar]
- 26.Oh Kt, Bronich Tk, Bromberg L, Hatton Ta, Kabanov Av. Block ionomer complexes as prospective nanocontainers for drug delivery. J Control Release. 2006;115(1):9–17. doi: 10.1016/j.jconrel.2006.06.030. [DOI] [PubMed] [Google Scholar]
- 27.Harpaz Y, Gerstein M, Chothia C. Volume changes on protein folding. Structure. 1994;2(7):641–649. doi: 10.1016/s0969-2126(00)00065-4. [DOI] [PubMed] [Google Scholar]
- 28.Papadopoulos S, Jurgens Kd, Gros G. Protein diffusion in living skeletal muscle fibers: Dependence on protein size, fiber type, and contraction. Biophys J. 2000;79(4):2084–2094. doi: 10.1016/S0006-3495(00)76456-3. [DOI] [PMC free article] [PubMed] [Google Scholar]
- 29.Liu J, Bauer H, Callahan J, Kopeckova P, Pan H, Kopecek J. Endocytic uptake of a large array of hpma copolymers: Elucidation into the dependence on the physicochemical characteristics. J Control Release. 2010;143(1):71–79. doi: 10.1016/j.jconrel.2009.12.022. [DOI] [PMC free article] [PubMed] [Google Scholar]
- 30.Wang G, Siggers K, Zhang S, et al. Preparation of bmp-2 containing bovine serum albumin (bsa) nanoparticles stabilized by polymer coating. Pharm Res. 2008;25(12):2896–2909. doi: 10.1007/s11095-008-9692-2. [DOI] [PubMed] [Google Scholar]
- 31.Yuan X, Harada A, Yamasaki Y, Kataoka K. Stabilization of lysozyme-incorporated polyion complex micelles by the omega-end derivatization of poly(ethylene glycol)-poly(alpha,beta-aspartic acid) block copolymers with hydrophobic groups. Langmuir. 2005;21(7):2668–2674. doi: 10.1021/la0488811. [DOI] [PubMed] [Google Scholar]
- 32.Vlasits J, Jakopitsch C, Schwanninger M, Holubar P, Obinger C. Hydrogen peroxide oxidation by catalase-peroxidase follows a non-scrambling mechanism. FEBS Lett. 2007;581(2):320–324. doi: 10.1016/j.febslet.2006.12.037. [DOI] [PubMed] [Google Scholar]
- 33.Thiele L, Merkle Hp, Walter E. Phagocytosis and phagosomal fate of surface-modified microparticles in dendritic cells and macrophages. Pharm Res. 2003;20(2):221–228. doi: 10.1023/a:1022271020390. [DOI] [PubMed] [Google Scholar]
Associated Data
This section collects any data citations, data availability statements, or supplementary materials included in this article.