Abstract
We develop a thermodynamically consistent phase-field model to simulate the dynamics of multicomponent vesicles. The model accounts for bending stiffness, spontaneous curvature, excess (surface) energy, and a line tension between the coexisting surface phases. Our approach is similar to that recently used by Wang and Du [J. Math. Biol. 56, 347 (2008)] with a key difference. Here, we concentrate on the dynamic evolution and solve the surface mass conservation equation explicitly; this equation was not considered by Wang and Du. The resulting fourth-order strongly coupled system of nonlinear nonlocal equations are solved numerically using an adaptive finite element numerical method. Although the system is valid for three dimensions, we limit our studies here to two dimensions where the vesicle is a curve. Differences between the spontaneous curvatures and the bending rigidities of the surface phases are found numerically to lead to the formation of buds, asymmetric vesicle shapes and vesicle fission even in two dimensions. In addition, simulations of configurations far from equilibrium indicate that phase separation via spinodal decomposition and coarsening not only affect the vesicle shape but also that the vesicle shape affects the phase separation dynamics, especially the coarsening and may lead to lower energy states than might be achieved by evolving initially phase-separated configurations.
I. Introduction
Biomembranes form the basic structural units for compartmentalizing biological systems. Biomembranes are complex structures whose fundamental components include lipids, proteins, and cholesterol. The morphology and structure of membranes play an important role in their biological function [1]. Vesicles are closed biomembranes consisting of different types of lipids and cholesterol and serve as important, but simplified models of more complex cell membranes [2]. Vesicles are liquidlike yet exhibit bending resistance, e.g., Refs. [2,3]. When several types of lipid and choletesterol are present, phase transformations may occur on the membrane leading to the formation of domains or rafts. From a biological point of view, rafts may play significant roles in regulating protein activity since particular proteins may concentrate at or near rafts [4]. This may, in turn, affect signaling and trafficking [5,6]. Rafts may also play a role in the budding and fission processes during endocytosis and exocytosis [7] as well as in membrane adhesion and fusion [8].
Recent experiments on giant unilamellar vesicles containing ternary mixtures of lipid components and cholesterol have provided evidence of phase separation under a variety of different driving mechanisms such as temperature and magnetic fields, light, polymer anchorage, osmotic pressures, and chemical variations. See, for example, Refs. [9–19]. The different phases coexist in the membrane (e.g., liquid-ordered and/or liquid-disordered phases) forming domains rich in one phase and poor in the other. Spinodal decomposition, coarsening, viscous fingering, vesicle budding, and fission are observed with concomitant changes in membrane morphology.
By exploiting the scale difference between the bilayer thickness (nm range) and the vesicle size (μm range), mathematical models have been developed in which the vesicle is treated as an elastic surface [20]. While there have been many theoretical and numerical studies of homogeneous vesicles using discrete and continuum models (e.g., see the reviews [3,21–24], the recent papers [25–36] and the references therein), there are far fewer studies of inhomogeneous systems although there has been an increasing focus on the inhomogeneous vesicles in the past ten years.
Phase separation is a well-studied process in bulk phases. However, the dynamics of spinodal decomposition into separated phases and their subsequent coarsening in multicomponent vesicles is much richer than its materials science counterpart in alloys. In vesicles, the phase separation process is strongly coupled to the shape dynamics and curvature effects can dynamically influence the phase separation and vice versa. Using discrete approaches such as Monte Carlo methods, dissipative particle dynamics, and molecular dynamics, the dynamics of phase separation and domain formation, vesicle fission and fusion have been simulated numerically. See, for example, Refs. [37–48]. Such atomistic simulations however are limited by computational cost in the length and time scales they are able to achieve.
Continuum methods provide a good modeling alternative to reach larger length and time scales. Continuum models are also easier to analyze and parametrize. Phase separation processes in the bulk have been successfully studied by continuum models. The continuum approach is based on the generalized bending energy proposed by Helfrich [20] supplemented by a line energy associated with the energy cost for the domain boundaries on the vesicle, see Lipowsky [49], Seifert [50], and Julicher and Lipowsky [51,52]. In the continuum description, budding and vesicle fission can be understood as a mechanism to reduce the line energy of a multicomponent vesicle. Until recently, studies of multicomponent vesicles have been limited to equilibrium investigations (e.g., Refs. [18,50,52–61]) or dynamical simulations limited to small deformations or special shapes (e.g., [62–66]) due to the difficulty in coupling phase separation and domain formation to highly nonlinear surface evolution.
Very recently, phase-field models developed for single-component vesicles (e.g., see [25–32]) have been extended to the multicomponent case [67,68]. In this approach, which we follow here, the vesicle is defined implicitly as the level set of an auxiliary phase field variable that varies smoothly, but rapidly, across the membrane. Accordingly, the membrane has a small but finite thickness and thus this is also known as a diffuse-interface method. The generalized Helfrich bending energy and the line tension are reformulated using a phase-field approximation. Evolution equations for the phase-field variable follow, roughly speaking, from gradient descent of this energy. This approach eliminates the need for introducing and evolving a surface mesh for the vesicle. Further, topological transitions such as vessel fission or fusion are straightforwardly captured via changes in the level set topology. However, further work is needed to interpret such changes since the details of vesicle fission or fusion go beyond the level of description contained in the Helfrich model.
In the context of multicomponent vesicles, Campelo and Hernandez-Machado [67,69] developed a phase-field framework to simulate pearling instabilities driven by polymers anchored to a tubular membrane. Accordingly a local polymer density is introduced and is coupled to the spontaneous curvature. However, only homogeneous polymer distributions were used.
A fuller coupling of membrane and surface phases was recently developed by Wang and Du [68] in order to simulate equilibrium states. In this work, a pair of phase-field variables were introduced such that one variable characterizes the vesicle (via a level set) while the other describes the distribution of the surface phases. The bending stiffness and spontaneous curvatures may depend on the surface phase distribution. Equations for both phase-field variables follow from a gradient descent algorithm where penalty terms are added to the system energy to enforce the conservation of the surface phase masses (which is sufficient for finding equilibrium states), surface area conservation and the conservation of the volume enclosed by the vesicle. The three-dimensional results obtained demonstrate the effectiveness of using phase-field methods to simulate highly complex vesicle and surface phase equilibrium morphologies that are qualitatively consistent with experiments.
In this paper, we develop a thermodynamically consistent phase-field model to simulate the dynamics of multicomponent vesicles. The model accounts for bending stiffness, spontaneous curvature, excess (surface) energy, and a line tension between the coexisting surface phases. Our approach is similar to that used by Wang and Du [68] with a key difference. Here, we solve the surface mass conservation equation explicitly. This equation was not considered in [68]. The equation for the vesicle phase-field variable follows from an energy dissipation principle (second law of thermodynamics [70]) while taking into account the mass conservation equation for the surface phases. This results in a fourth-order strongly coupled system of nonlinear nonlocal equations. Although the system is valid for three dimensions, we limit our studies here to two dimensions where the vesicle is a curve. The equations are solved numerically using an adaptive finite element numerical method, implemented using the adaptive finite element method (FEM) toolbox AMDiS [71], together with a semi-implicit time-stepping algorithm which removes high-order time step constraints. We perform a study of the dynamics of two-dimensional vesicles containing two surface phases (i.e., liquid-ordered and liquid-disordered phases). We find that differences between the spontaneous curvatures and the bending rigidities of the surface phases may lead to the formation of buds, asymmetric vesicle shapes, and vesicle fission even in two dimensions. In addition, simulations of configurations far from equilibrium indicate that phase decomposition via spinodal decomposition and coarsening not only affect the vesicle shape but also that the vesicle shape affects the phase-separation dynamics and may lead to lower energy states than might be achieved by evolving initially phase-separated configurations.
The paper is organized as follows. We first review the sharp-interface framework. We then derive the thermodynamically consistent phase-field model. The adaptive finite element method is briefly presented, followed by numerical results that demonstrate the strong coupling between surface phase composition and the vesicle shape during evolution. Finally, conclusions are discussed together with plans for future work. An appendix provides some details regarding the sharp-interface energy variations.
II. Energy and Dynamic Evolution: Sharp-Interface Framework
The starting point for membrane modeling in the sharp interface context has traditionally been the generalized bending energy proposed by Helfrich [20] in the single component case and by Lipowsky [49], Seifert [50], and Julicher and Lipowsky [51,52] for phase-separated multicomponent membranes. When the phases are not separated, a more general energy may be formulated, e.g., see [62–64,72] for special cases with limited phenomenological coupling between the surface phases and the membrane geometry and parameters. Here, we briefly summarize a general sharp-interface formulation [73] as it provides a motivation and guide for the phase-field model considered in the next section.
Consider a two-component system with mass density ρA and ρB for components A and B, respectively. The concentration variable is defined as u = (ρA − ρB)/(ρA + ρB). Note that in most examples, the two components correspond to liquid-ordered and liquid-disordered surface phases, e.g., Refs. [10,11,74]. Assuming that the membrane parameters depend on u, the energy to be minimized is the sum of the following contributions:
-
The normal bending energy
-
the Gaussian bending energy
-
the excess energy associated with the presence of the membrane
-
the line energy
where Γ is the membrane surface (assumed to have zero thickness), H is the total curvature (twice the mean curvature), H0(u) is the spontaneous curvature, K the Gaussian curvature, bN(u) is the normal bending stiffness, bG(u) is the Gaussian bending stiffness, and γ(u) is the surface tension (excess energy associated with the membrane surface). Further, σ is the line tension, W(u) = 1/4(1 − u)2(1 + u)2 is a double well potential that describes the tendency of the two surface components to phase separate and δ is a small parameter that effectively describes the thickness of the transition layer on the membrane that separates the A and B components. Hereafter, we will take σ = 1 which corresponds to rescaling all the energies by the line tension.
For constant bG the Gaussian bending energy is proportional to the Euler characteristic of the membrane (Gauss-Bonnet theorem, e.g., Ref. [75]) and so changes in shape, which preserve the topology, do not change the energy. The Gauss modulus, however, influences membrane processes that change topology such as vesicle fission or fusion. Further, recent work [18,60,76] suggests that differences in the Gauss moduli of coexisting surface phases may explain the vesicle shape and surface phase distribution in experiments, especially in the neighborhood of a neck. Here, for simplicity, we will omit the possible dependency of bG on u, thus we will not consider contributions of the Gaussian bending energy. These will be incorporated in a future work.
In [73] a thermodynamically consistent sharp-interface model for the evolution of a multicomponent vesicle is derived from the total energy E[Γ, u] = EB + ES + ET. Taking the time derivative of the energy we obtain
| (1) |
where δE/δu and δE/δΓ are the variational derivatives of the total energy E[Γ, u] with respect to Γ and u, respectively. Further, v is the velocity of Γ. For completeness, the variational derivatives are defined in the Appendix. Note that we have implicitly assumed that u is extended off Γ such that the derivative in the normal direction ∂u/∂n = 0 in the neighborhood of Γ [73].
The surface mass conservation equation for u is
| (2) |
where v = Vn + T and q is a surface mass flux. The simplest thermodynamically consistent system of equations for u and Γ, without constraints on the volume or the surface area (e.g., required for conservation of these quantities), is obtained by taking to yield [73]
| (3) |
| (4) |
| (5) |
where n is the unit outward normal to Γ and ξu, ξV, and ξT are non-negative mobility coefficients. The incorporation of constraints on the volume and surface area for conservation can easily be done using Lagrange multipliers or by adding penalty terms to the total energy. The first equation is a Cahn-Hilliard type equation on an evolving surface, the second equation accounts for the evolution of the surface in normal direction is related to the Willmore flow problem, and the third equation models the tangential movement. For more details on the model we refer to [73].
III. Phase-Field Approximation
Next we derive a thermodynamically consistent phase-field model which approximates the sharp-interface description of vesicle evolution described in the previous section. Our approach is similar to that used by Wang and Du [68] with the key difference being how we treat the surface phase concentration u which we point out below. In this approach, the vesicle membrane is defined implicitly through a phase-field variable ϕ such that ϕ = 1 inside the vesicle, ϕ = 0 outside the vesicle with a smooth, but rapid transition across the vesicle Γ = {x ∈ Ω: ϕ(x) = 1/2}, where Ω ⊂ ℝ2,3 is a volume domain with Γ(t) ⊂ Ω for t ∈ [0, T]. The membrane is characterized by a diffuse transition layer with a small but finite thickness ε. This eliminates the need for introducing and evolving a surface mesh for the membrane. Further, topological transitions such as vessel fission are straightforwardly captured via changes in the ϕ = 1/2 level set topology. The evolution equations are extended off the membrane Γ and the phase-field equations are solved in Ω. Accordingly, the phase concentration u is now interpreted as an extended variable which is defined not only on Γ but also in Ω.
A. Model derivation
The phase-field equations are derived using an energy variation approach together with a surface mass conservation equation for u. The free energy functional of the system is defined to be F[ϕ, u]. We defer the specific definition of F until later in this section when we consider the different constituent components, e.g., the bending and surface energies, line tension, etc.
To satisfy energy dissipation, and hence the second law of thermodynamics (assuming a constant temperature) [70], we require
| (6) |
where and denote variational derivatives of F with respect to ϕ and u, respectively. To make further progress, we derive and use the mass conservation equation for u in Eq. (6).
In the phase-field framework, it can be shown that if G(ϕ) is a double-well potential, i.e., G(ϕ) = 36ϕ2(1 − ϕ)2, and ε is a small parameter, i.e., the interface thickness, then
| (7) |
where C is a constant that depends on the specific form of G (equal to 1 for the specific choice of G given above) and δΓ is the surface δ function. See [25,71,77,78] for example. We note that there are other diffuse-interface approximations of the surface δ function. Since −1 ≤ u ≤ 1, we may define the total mass difference between the surface phases in an arbitrary domain Ωa ⊂ Ω as
| (8) |
i.e., M ≈ MA − MB, where MA and MB are the masses of the A and B phases in Ωa. Then, conservation of mass follows from
where Ωa is assumed to be independent of time with boundary ∂Ωa. We may also assume that Ωa ∩ Γ(t) ≠ ∅. The flux j denotes the net flux of mass and m the normal on ∂Ωa. Arguing that this equation holds for arbitrary Ωa, we thus obtain the local mass conservation equation
| (9) |
Multiplying by μ, with μ defined by
| (10) |
we obtain
| (11) |
It remains now to determine the flux mass flux j consistent with the decrease of the free energy. Using Eq. (11) in Eq. (6), we obtain
If we now define
| (12) |
| (13) |
where B(ϕ) is a non-negative mobility function that is localized near the interface, e.g., B(ϕ) = 36ϕ2(1 − ϕ)2, which is introduced to ensure that the mass flux is localized near the interface. Further, βu and βϕ are non-negative mobility coefficients and the scaling in ε is chosen such that the equations are consistent with the sharp interface limit as ε → 0. With these choices, we obtain
| (14) |
where we have assumed the natural boundary condition ∇μ · n = 0 holds on ∂Ω. Finally, using the identity εu∇ϕ · ∇∂tϕ − ε∇ · (u∂tϕ∇ϕ) = −ε∇ · (u∇ϕ)∂tϕ and the definition of j from Eq. (13) in Eq. (9), the governing equations can be written as
| (15) |
| (16) |
| (17) |
At this point, several remarks are in order. This system differs from that considered by Wang and Du [68] in that Eq. (17) follows from mass conservation and energy dissipation whereas in Ref. [68] both the ϕ and u equations were derived by energy variation only. In Ref. [68], mass conservation of the surface phase was only approximately enforced by introducing a corresponding penalty term in the system energy and the surface phase conservation equation was not considered.
In the region near the membrane, an asymptotic analysis of the equations (not shown) would roughly speaking give ∂tϕ ∼ −V/ε and ε−1G′(ϕ) − εΔϕ ∼ H. From these results, it can be seen that the structure of Eqs. (15)–(17) is analogous to the sharp interface model in Eqs. (3)–(5). We note that a general treatment of partial differential equations on surfaces within a phase field approximation is discussed in [79,80].
We next present the specific form of the free energy F[ϕ, u] by considering the phase-field representation of the normal bending energy, the excess (surface) energy associated with the membrane and the line energy associated with the presence of different surface phases.
B. Phase-field representation of energy terms
1. Normal bending energy
Consider the phase-field approximation of the sharp-interface normal bending energy EB. If bN(u) = 1 and H0(u) = 0 the problem reduces to the classical Willmore energy, for which phase-field approximations are known. In one approach [29,30,32], the curvature of the vesicle is obtained directly by H ∼ ∇ · (∇ϕ/|∇ϕ|) and |∇ϕ| is used to approximate the surface δ function. Thus, the phase-field approximation of the bending energy (in the absence of spontaneous curvature) is the integral of the product of these functions. This approach is easily generalized to nonzero spontaneous curvature. An alternative approach [81–83], which we follow here, is related to a conjecture of DiGiorgi [77,83]. The corresponding phase-field bending energy is
with G(ϕ) = 36ϕ2(1 − ϕ)2 being the double well potential. The variational derivative δFB/δϕ is
In the more general case the energy is [25]
and the variational derivative becomes
Note that for bN = 1 and H0 = 0 both the free energy and the variational derivatives reduce to the special case mentioned above.
2. Excess energy
Consider the phase-field approximation of the sharp-interface excess (surface) energy ES. If γ(u) = 1 the phase-field approximation is also well known [84,85] and is given by
The variational derivative is
With γ(u) the energy was extended in [80] to
which yields the variational derivatives
Again if γ = 1 both the free energy and the variational derivatives reduce to the classical results.
3. Line energy
Consider next the phase-field approximation of the sharp-interface line energy EL. An appropriate energy was introduced in [79] and was used later by Wang and Du [68]. The phase-field energy is given by
with the variational derivatives given by
4. Volume and surface area constraints
Following [25,68], we introduce penalty terms to enforce volume and surface area conservation for evolving vesicles. Alternatively, we note that Lagrange multipliers could be used to conserve volume and total vesicle surface area [25,26] or local surface area [29–31]. The use of Lagrange multipliers in our approach is straightforward and is currently under study. Here, we use the following phase-field approximation of the volume of the vesicle:
| (18) |
and introduce the penalty term
| (19) |
where V0 is a prescribed volume and MV is a large positive constant. The functional derivative δFV/δϕ is
| (20) |
Similarly, we consider the phase-field approximation of the surface area
| (21) |
and the corresponding penalty functional
| (22) |
where A0 is the prescribed area and MA is a large positive constant. The corresponding function derivative is
| (23) |
Note that the functional derivatives in Eq. (20) and Eq. (23) lead to nonlocal terms in the evolution equations.
5. Total energy
The total energy free energy F[ϕ, u] of the vesicle model consists of the sum of all the effects considered,
| (24) |
Correspondingly, the functional derivatives with respect to ϕ and u sum up to
and
Note that . Incorporating these functional derivatives in the evolution equations (15)–(17) yields a fourth-order strongly coupled system of nonlinear nonlocal equations.
We note that in the system considered by Wang and Du [68], an additional penalty term was added to enforce ∇u · ∇ϕ ≈ 0 (i.e., the normal derivative ∂u/∂n ≈ 0). This was not found to be necessary here because this condition is automatically enforced by having u satisfy the mass conservation equation (17). For example, it can be seen that the leading term in an asymptotic expansion near the vesicle membrane arises from the line tension term δFL/δu and implies that ∂u/∂n = 0 to leading order.
IV. Finite Element Discretization
In this section we briefly describe the finite element discretization for the fourth-order system of nonlinear nonlocal equations (15)–(17) implemented using the adaptive FEM toolbox AMDiS [71]. First, we consider the time discretization, where we split the time interval [0, T] into discrete time increments 0 = t0 < t1 < … and associated time steps Δtk ≔ tk+1 − tk, with k = 0, 1, …. To discretize the equations in time, we use a semi-implicit algorithm in which only the nonlocal terms V[ϕ] and A[ϕ] are treated explicitly. This allows us to overcome the severe time step restrictions (Δtk ∼ Δx4, where Δx is the smallest mesh spacing) required for stability by explicit methods and the high costs associated with solving coupled nonlinear systems that arise from fully implicit time discretizations.
To discretize in space, let be a conforming triangulation of Ω at time t = tm. Denote the set of polynomials of degree 1 by ℙ1 and define the finite element space of globally continuous, piecewise linear elements by , where X is an appropriate function space. Let (ψi)i be the standard nodal basis of and take , , and . Then, taking the inner product of Eqs. (15)–(17) with ψk, we obtain a linear system of equations for , , , and .
In order to reduce the computational cost the mesh is locally adapted using a bisection algorithm (see [71] and references therein) such that a fine mesh is used near the vesicle membrane and a coarse mesh is used elsewhere. For local mesh adaptation, we use an L2-like error indicator based on a jump residual [71,86] for the phase-field variable ϕ; see Fig. 1 for an example of an adaptively refined mesh. The number of elements in the simulations is in the order of 100 000. Within the diffuse interface we use approximately five grid points. Furthermore a simple strategy of time adaptivity is used, where the time step is inversely proportional to the maximum of the normal or intrinsic normal velocity of the interfaces, leading to time steps Δtk ∈ [10−5, 10−4].
FIG. 1.
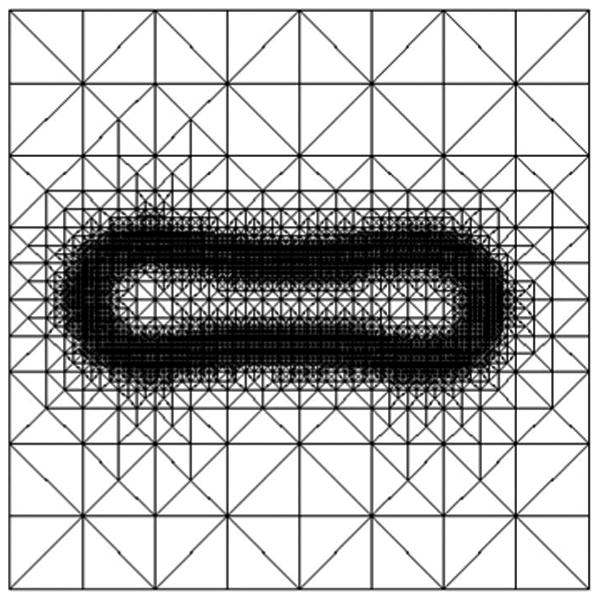
Typical adaptively refined mesh. The mesh corresponds to the simulation of spinodal decomposition at t = 0.0406 shown in Fig. 9.
V. Numerical Results
Next, we consider the application of the model and numerical algorithm to simulate the dynamics of multicomponent lipid membranes in two dimensions. Take, for example, ternary lipid mixtures which involve cholesterol long-chain and short-chain lipids as studied in [11,60]. The long-chain lipids enrich a liquid-ordered L0 phase while the short-chain lipids enrich a liquid-disordered Ld phase. The concentration u thus represents the rescaled relative concentration of the two phases.
An accurate determination of all the material parameters involved is a challenging problem. In principle, the parameters can be estimated by matching experimentally measured membrane and computed shapes, e.g., see [52] for single-component membranes and [18,60,76] for ternary liquid ordered and/or disordered systems, although this approach may not yield a unique set of parameters.
For membranes containing coexisting surface phases only values for selected average compositions are known [11]. According to Ref. [14] no attempts have been made to measure the normal elastic rigidity in phase-separated membranes. Measurements of the line tension can be found in [14,16] and are found to strongly depend on cholesterol concentration.
Here, we present a study in which we examine the influence of the spontaneous curvature H0 and the normal bending stiffness bN. We do not consider the effects of a variable surface energy γ as this is deferred to future work. Recall that the energy is rescaled by the line tension and thus this parameter is fixed. The kinetic coefficients βu and βϕ are also fixed and set to 1. This is the simplest possible situation. More complicated choices, e.g., a functional dependency of βu on u, clearly will influence the dynamics. Indeed, in [87], the dynamics was found to strongly depend on the cholesterol concentration. However, little is known about the magnitude and functional dependence of these kinetic parameters which is why we focus on the other parameters here and defer a more detailed study of βu to a future study.
In order to demonstrate the effect of the dependency of H0, bN, and γ upon u, we assume a generic function h (i.e., h = H0, bN, γ)
where h−1 and h1 are the values for constant composition. Note that because the polynomial energy W(u) is used, u may fall slightly outside the range of −1 to 1 by an amount that is O(δ). In addition, this higher order interpolation is needed in order to assign values of the parameters, within the diffuse interface that separates the surface domains, in an appropriate way. In particular, a higher order interpolation yields more accurate results as the difference between h−1 and h1 increases.
In addition, we consider the domain Ω ≔ (−1, 1)2 and use periodic boundary conditions. For all the simulations presented here, we took the penalty parameters to be MV = 104 and MA = 103 which were found by numerical experimentation to give good results for volume and surface area conservation. The widths of the diffuse interfaces separating the interior and exterior of the vesicle (e.g., diffuse membrane) and separating the surface phase domains are controlled by the parameters ε and δ which are set to be 0.1 and 0.01, respectively; these choices are also a result of numerical experimentation and are similar to the parameters used in [79] in which a Cahn-Hilliard equation is solved on implicitly described surfaces. We use the same parameter set for all simulations. We note that with these parameters, our simulations indicate that all structure remains tangential to the interface and no structure forms normal to the interface within the diffuse layer. Furthermore, we introduce a parameter εB > 0 in order to regularize the degenerate mobility function B ⇝ εB + B (see also [79,88]), and we use εB = 10−4 here. Finally, in all the simulations, the initial vesicle shape is an ellipse. In particular, the level-set {x∣ϕ(x, 0) = 1/2} is an ellipse and the initial phase-field variable ϕ(x, 0) = ϕ0 is given by
where rh(x) is a discrete approximation of the signed distance function of an ellipse.
A. Symmetric shapes
We begin by considering the effect of only the line tension. In particular, we take the spontaneous curvature H0(u) = 3.25 and the normal bending rigidity bN(u) = 1 to be constant as well as γ(u) = 0. The initial concentration u0 is symmetrically distributed with u0 = −1 (blue) on the left half of the initial ellipse and u0 = 1 on the right half (red), as seen in Fig. 2. Away from the ellipse, u0 tends smoothly, and rapidly to 0. Note that other smooth extensions away from the interface could be used. The diffuse interface separating the two surface domains is clearly seen. In the figure, u is plotted on the isocontours of ϕ from ϕ = 0.4 to ϕ = 0.6. Note that the membrane is characterized by the level-set {x∣ϕ(x, t) = 1/2}.
FIG. 2.
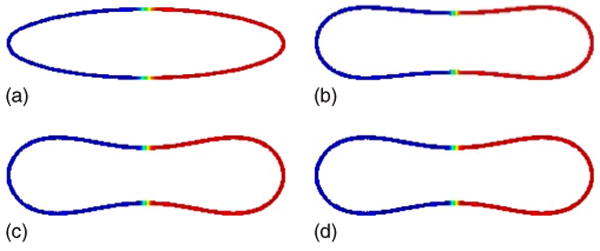
(Color online) Evolution of the concentration u on the isocontours of ϕ from ϕ = 0.4 to ϕ = 0.6 is shown at times t = 0 (a), t = 0.0006 (b), t = 0.0024 (c), and t = 0.0120 (d); H0(−1) = H0(1) = 3.25, bN(−1) = bN(1) = 1.
As the vesicle relaxes to reduce its energy, buds form at the vessel tips and a neck of negative curvature develops at the vesicle center. This reflects the competition between the tendency to reduce the bending energy and decrease the vesicle curvature while at the same time maintaining constant vesicle volume and surface area. The resulting discocyte shape is a common shape for homogeneous vesicles. Here, because the bending rigidity and spontaneous curvature are independent of u, the surface phases evolve symmetrically with the transition between the two confined being confined to the vesicle center. The line tension tends to reinforce the discocyte shape, although since the simulation is two dimensional there is not a significant advantage, as there would be for axisymmetric and three-dimensional vesicles, for having the transition between the two surface phases occurring at the minimum neck radius.
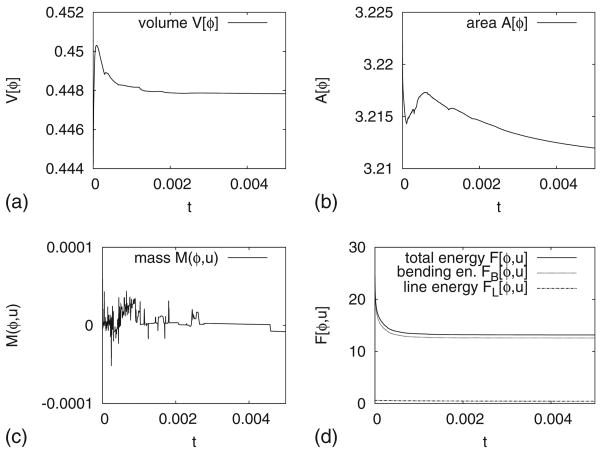
In Fig. 3 we present the evolution of the volume V[ϕ], the surface area A[ϕ], the mass difference M(ϕ, u), and the total energy F[ϕ, u] and its components, the bending energy FB, and the line tension FL, throughout the simulation. The maximal relative deviation of the volume compared to its initial value is ≈0.2%. For the surface area, the relative deviation is ≈0.07%, and for the mass difference, the absolute deviation is ≈5 × 10⁻⁵. The bending energy (dotted) dominates the total energy (solid) and thus the decrease in total energy is due primarily to the reduction in bending energy. The line energy (dotted-dashed line) is approximately constant throughout the simulation since the interface layers separating the two surface phases are nearly equilibrated.
FIG. 3.
(a) The volume, (b) surface area, (c) mass, and (d) the total energy F[ϕ, u] (solid), the bending energy FB[ϕ, u] (dotted), and the line energy FL[ϕ, u] (dotted-dashed line) for the simulation shown in Fig. 2.
B. Asymmetric shapes
We next consider the effects of differences in spontaneous curvatures and bending energies between the two phases. We also consider asymmetric initial surface phase distributions.
1. Asymmetric spontaneous curvature
We begin with a case such that the two phases have different spontaneous curvatures: H(−1) = 2 and H(1) = 5. For simplicity, we take a constant normal bending rigidity bN(u) = 1 and we take a symmetric initial concentration u0. The evolution towards an asymmetric discocyte vesicle shape is shown in Fig. 4. As the vesicle relaxes to equilibrium, the curvature of the u = 1 phase decreases while that of the u = −1 phase increases. This occurs because in each surface phase, the vesicle curvature tends toward the appropriate spontaneous curvature. Correspondingly, the surface phase concentration also becomes asymmetric. Not only are the u = −1 and u = 1 phases located at the corresponding vesicle ends but the u = −1 phase also nearly covers the neck region. This is a consequence of volume, surface area, and mass conservation. A check of these theoretically conserved quantities indicates that deviations from their initial values in the simulation are similar to that described previously for the symmetric vesicle. Indeed, this is the case for all the simulations presented hereafter.
FIG. 4.
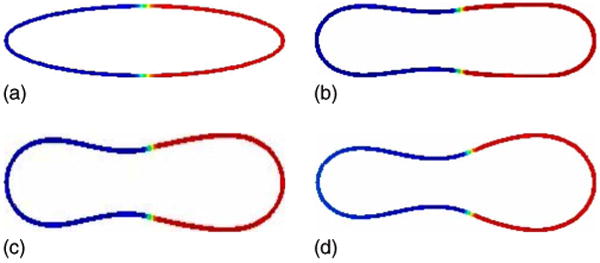
(Color online) Evolution of the concentration u on the isocontours of ϕ from ϕ = 0.4 to ϕ = 0.6 is shown at times t = 0 (a), t = 0.0005 (b), t = 0.001 (c), and t = 0.02 (d); H0(−1) = 2, H0(1) = 5, bN(−1) = bN(1) = 1.
As an additional comparison, we repeat the previous simulation using an asymmetric initial surface phase distribution. In particular, there is now more u = −1 phase. The simulation is shown in Fig. 5. Not surprisingly, the results are similar and the u = −1 phase now fully covers the neck region of the asymmetric discocyte.
FIG. 5.
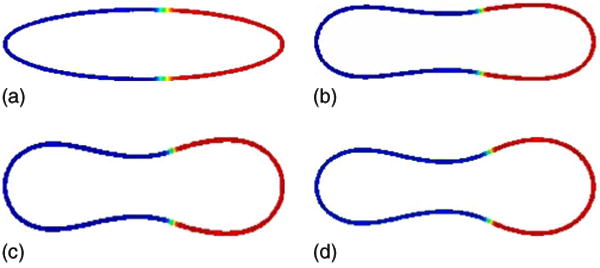
(Color online) Evolution of an asymmetric concentration u on the isocontours of ϕ from ϕ = 0.4 to ϕ = 0.6 is shown at times t = 0 (a), t = 0.0005 (b), t = 0.001 (c), and t = 0.02 (d); H0(−1) = 2, H0(1) = 5, bN(−1) = bN(1) = 1.
2. Asymmetric normal bending rigidity
We next consider a case in which the normal bending rigidities are different in the two surface phases. We correspondingly take bN(−1) = 1/2 and bN(1) = 5. For simplicity, a constant spontaneous curvature H0(u) = 3.25 is used and the initial surface phase distribution is symmetric. The results are shown in Fig. 6. As the vesicle relaxes towards equilibrium, a large nearly circular bud develops in the u = 1 phase in response to the large bending rigidity. The u = −1 phase is pulled entirely through the neck region and a much smaller bud forms in the u = −1 phase. Because of the large difference between the bending rigidities, bN(1)/bN(−1) = 10, the discocyte shape is highly distorted.
FIG. 6.
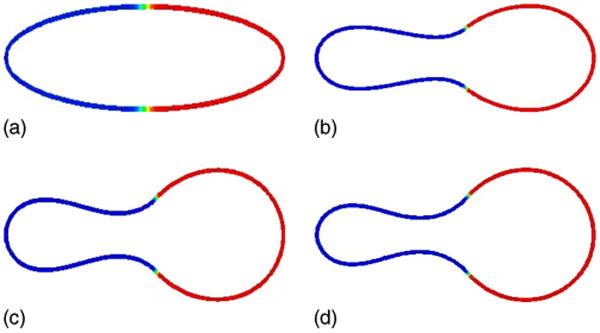
(Color online) Evolution of the concentration u on the isocontours of ϕ from ϕ = 0.4 to ϕ = 0.6 is shown at times t = 0 (a), t = 0.0005 (b), t = 0.0010 (c), and t = 0.0100 (d); H0(−1) = H0(1) = 3.25, bN(−1) = 1/2, bN(1) = 5.
In Fig. 7, we now repeat the above simulation but with the initially asymmetric surface phase, used previously in Fig. 5 such that there is more u = −1 phase present. In this case, there is not enough u = 1 phase to form a large bud. Instead, a large bud forms in the plentiful u = −1 phase which is attached to a small bud in the u = 1 phase by a narrow neck. As the evolution proceeds, the neck narrows leading to vesicle fission which results in the formation of a large vesicle consisting mostly of the u = −1 phase and a u = 1 rich small vesicle. Because the u = 1 phase spans the neck region before pinchoff, the large vesicle has a small region rich in the u = 1 phase while the small vesicle contains essentially no u = −1 phase.
FIG. 7.
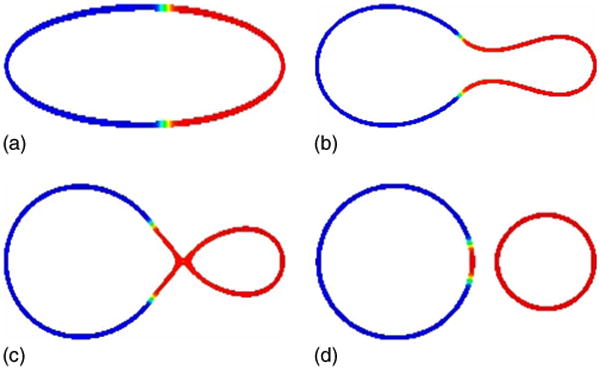
(Color online) Fission of a vesicle. The evolution of the asymmetric concentration u on the isocontours of ϕ from ϕ = 0.4 to ϕ = 0.6 is shown at times t = 0 (a), t = 0.0010 (b), t = 0.0020 (c), and t = 0.0161 (d); H0(−1) = H0(1) = 3.25, bN(−1) = 1/2, bN(1) = 5.
It is important to note that the neck of a vesicle in three dimensions has a different character than that of the vesicle simulated here since in a two-dimensional vesicle in three dimensions, the mean curvature may be very small in magnitude because the two principle curvatures have opposite signs. Here, the one-dimensional vesicle in two dimensions has large curvature in the neck. In addition, in three dimensions, the line tension strongly favors fission. Thus, it is interesting that we obtain fission even in two dimensions.
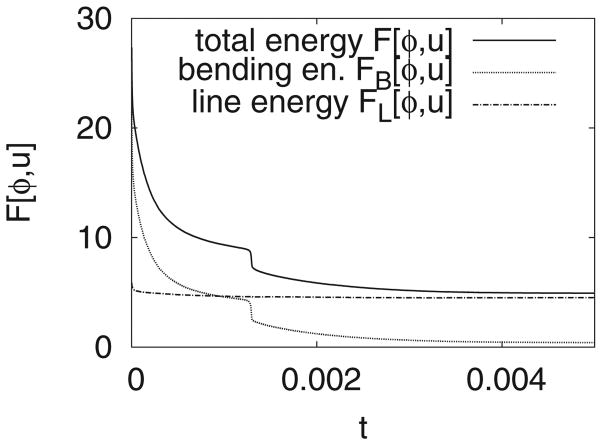
The corresponding total F[ϕ, u] (solid), bending FB[ϕ, u] (dotted), and line F[ϕ, u] (dotted-dashed line) energies are shown in Fig. 8. At early times, the total energy is dominated by the bending energy which decreases to the level of the line energy. As these effects compete, the vesicle fissions and there is a rapid drop in the bending energy with a concomitant drop in the total energy. The line energy slightly decreases at early times associated with the equilibration of the interface layers separating the surface phases. After this initial decrease, the line energy becomes roughly constant as the structure of the interface layers equilibrates.
FIG 8.
The total energy F[ϕ, u] (solid), the bending energy FB[ϕ, u] (dotted), and the line energy FL[ϕ, u] (dotted-dashed line) for the simulation shown in Fig. 7.
C. Spinodal decomposition and coarsening
To further investigate the coupling between the motion of the interface—given by the phase-field variable ϕ—with the evolution of the lipid concentration u, we take an initial surface phase distribution far from equilibrium. We let u0 take random values around u = 0 in [−1, 1]. The corresponding initial mass is M[ϕ, u] (t = 0) = −0.029 997 3.
The initial condition and subsequent spinodal decomposition and surface phase coarsening is shown in Fig. 9. The parameters are listed in the figure caption. As can be seen in the figure, not only does the surface phase affect the shape of the interface but the shape of the interface affects the spinodal decomposition and coarsening. In particular, observe that the u = 1 phase, which is associated with a larger spontaneous curvature, forms preferentially in regions of large curvature.
FIG. 9.
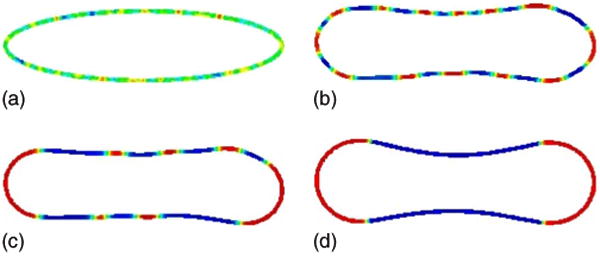
(Color online) Spinodal decomposition. The evolution of the concentration u(x, t) on the isocontours of ϕ from ϕ = 0.4 to ϕ = 0.6 is shown at times t = 0 (a), t = 0.001 (b), t = 0.01 (c), and t = 0.04 (d), H0(−1) = 2, H0(1) = 5, bN(−1) = bN(1) = 1.
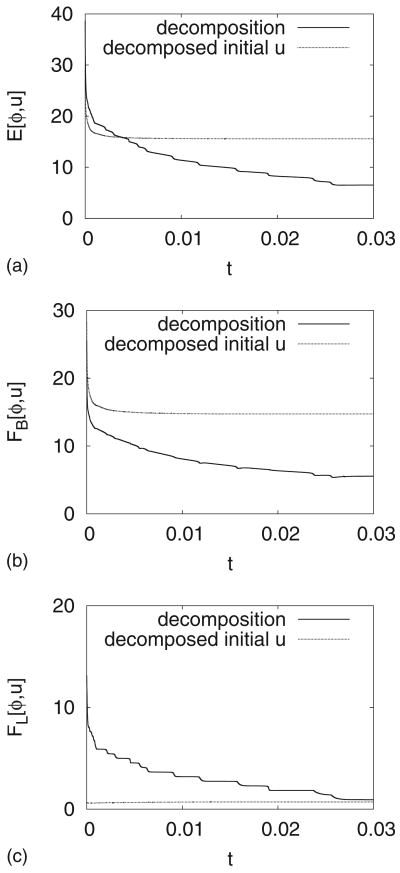
Interestingly, the nearly equilibrium configuration shown in Fig. 9(d) is quite different than that obtained when the initial condition is already decomposed into large regions of u = −1 and u = 1 phases. Recalling Fig. 4, we note that when the vesicle is divided into two surface phases, u = −1 and u = 1, buds form on the corresponding sides of the vesicle. In contrast, when the decomposition occurs freely as in Fig. 9, the u = 1 phases comprise the large curvature regions while the u = −1 phases are located in regions of small curvature. This is an energetically more favorable configuration as seen in Figs. 10(a)–10(c). We observe that while both the bending [Fig. 10(b)] and line [Fig. 10(c)] energies decrease in time, the line energy for the simulation in Fig. 9 is strictly larger than that for the simulation in Fig. 4 because in Fig. 9 there are ultimately four interface layers that separate the surface domains while in Fig. 4 there are only two such interface layers. It is thus the large reduction in bending energy, associated with having the u = 1 and u = −1 phases in the regions of large and small curvature, respectively, that is responsible for the fact that the total energy [Fig. 10(a)] is smaller for the configuration from Fig. 9(d) than that from Fig. 4(d). Thus, phase separation via spinodal decomposition and coarsening not only affects the vesicle shape but also the vesicle shape affects the phase separation dynamics.
FIG. 10.
A comparison of the total energies (a), the bending energies (b), and the line energies (c) for the simulations in Fig. 4 (labeled “decomposed initial u”) and Fig. 9 (labeled “decomposition”).
VI. Discussion
We have developed a phase-field model to simulate the dynamics of multicomponent vesicles. The model is derived using an energy variation approach together with the conservation of the masses of the surface phases and accounts for bending stiffness, spontaneous curvature, excess (surface) energy, and a line tension between the coexisting surface phases. The phase-field model extends the sharp-interface description of the vesicle dynamics, eliminates the need for introducing a surface mesh to track the membrane, and allows topology changes, such as vesicle fission, to occur smoothly.
The model consists of a coupled system of fourth-order nonlinear nonlocal equations for a variable ϕ that characterizes the vesicle membrane (as a level set of ϕ) and a variable u that describes the concentration of the surface phases. The constraints of volume and surface area conservation are implemented using a penalty approach which is the source of the nonlocal terms in the system. The model is closely related to the phase-field model recently introduced by Wang and Du [68] for simulating equilibrium states with the key difference being that in [68] surface mass conservation was only approximately enforced using a penalty approach and the surface mass conservation equation was not considered; this equation plays an essential role in our model. Although the system is valid for three dimensions, we limited our studies here to two dimensions where the vesicle is a curve.
To solve the model equations efficiently and accurately, an adaptive finite element method is utilized together with a semi-implicit time discretization which removes high order time step constraints. We then performed a study of the dynamics of two-dimensional vesicles containing two surface phases (i.e., liquid-ordered and liquid-disordered phases). We found that differences between the spontaneous curvatures and the bending rigidities of the surface phases led to the formation of buds and asymmetric vesicle shapes. We also presented an example of asymmetric spontaneous curvature-induced vesicle fission. In this example, two asymmetric daughter vesicles are produced with each daughter vesicle being rich in one of the surface phases. However, we observe that asymmetries in the neck region before fission takes place can create a small domain of the other phase in a daughter vesicle. Finally, we considered a configuration far from equilibrium and observed that not only does the spinodal decomposition and coarsening of the surface phases affect the vesicle shape but also that the vesicle shape affects spinodal decomposition. In particular, for the parameters used here, it is energetically more favorable for the surface phase with smaller spontaneous curvature to form in the neck regions of the vesicle even though this configuration has a larger line energy than if the surface phase boundaries were at the neck (i.e., four interface layers in Fig. 9 versus two interface layers in Fig. 4).
The phase-field approach and the associated numerical method described here provides a general framework for studying the dynamics of multicomponent vesicles and biomembranes. Although they were not considered in this work, the effects of surface energy and Gaussian bending stiffness differences between the surface phases will be incorporated in a future work. Recent studies have shown, for example, that differences in the Gaussian bending stiffness may play an important role in the vesicle dynamics and equilibrium shapes [18,60]. While the techniques described in [89,90] can be used for calculating the Gaussian curvature in phase-field models, there may be other more straightforward approaches.
The model presented here can be straightforwardly extended to systems with more surface components and more realistic thermodynamics, e.g., Refs. [13,91,92] and to vesicles in three dimensions. The presence of a fluid flow may also induce surface-phase separation, budding, and vesicle fission, e.g., Ref. [47], and can be incorporated within this framework by coupling the phase-field model with the Stokes or Navier-Stokes equations for fluid flow, e.g., see [27,29,30,32] for such coupling for homogeneous vesicles. The presence of membrane proteins within the phases can also have an important influence on the vesicle shape and surface phase distribution, e.g., Refs. [52,93], and can be modeled by incorporating the concentration(s) of membrane proteins in the phase-field model described here via an additional protein energy and introducing coupling between the protein and the bending rigidity and spontaneous curvature, e.g., see [94–96]. Vesicle-vesicle and vesicle-substrate adhesion can also be modeled by introducing adhesion potentials in the phase-field framework, e.g., Refs. [97,98].
After reviewing we became aware of another approach in which adaptive finite elements are used to solve a phase-field model of vesicle deformation [99], in which a one-component model is used.
Acknowledgments
J.S.L. is grateful to Shuwang Li for valuable discussions. J.S.L. acknowledges partial support from the National Science Foundation through Grant No. DMS-0612878 and from the National Institutes of Health through Grant No. P50GM76516 for a Center of Excellence in Systems Biology at the University of California, Irvine. A.V. acknowledges partial support from the German Science Foundation through Grant No. Vo899/6-1.
Appendix: Sharp-Interface Energy Variation
The total energy in the sharp-interface model presented in Sec. II is E[Γ, u] = EB + ES + ET. The variational derivatives and are given by
where [73]
K is the Gaussian curvature, and
Contributor Information
John S. Lowengrub, Department of Mathematics, University of California, Irvine, California 92697-3875, USA.
Andreas Rätz, Insitut für Wissenschaftliches Rechnen, Technische Universität Dresden, Zellescher Weg 12-14, 01062 Dresden, Germany.
Axel Voigt, Insitut für Wissenschaftliches Rechnen, Technische Universität Dresden, Zellescher Weg 12-14, 01062 Dresden, Germany.
References
- 1.McMahon H, Gallop J. Nature (London) 2005;438:590. doi: 10.1038/nature04396. [DOI] [PubMed] [Google Scholar]
- 2.Seifert U. Adv Phys. 1997;46:13. [Google Scholar]
- 3.Lipowsky R. Nature (London) 1991;349:475. doi: 10.1038/349475a0. [DOI] [PubMed] [Google Scholar]
- 4.Hess S, Kumar M, Verma A, Farrington J, Kenworthy A, Zimmerberg J. J Cell Biol. 2005;169:965. doi: 10.1083/jcb.200412058. [DOI] [PMC free article] [PubMed] [Google Scholar]
- 5.Simons K, Ikonen E. Nature (London) 1997;387:569. doi: 10.1038/42408. [DOI] [PubMed] [Google Scholar]
- 6.van Meer G, Sprong H. Curr Opin Cell Biol. 2004;16:373. doi: 10.1016/j.ceb.2004.06.004. [DOI] [PubMed] [Google Scholar]
- 7.Rauch C, Farge E. Biophys J. 2000;78:3036. doi: 10.1016/S0006-3495(00)76842-1. [DOI] [PMC free article] [PubMed] [Google Scholar]
- 8.Takeda M, Leser G, Russell C, Lamb R. Proc Natl Acad Sci U S A. 2003;100:14610. doi: 10.1073/pnas.2235620100. [DOI] [PMC free article] [PubMed] [Google Scholar]
- 9.Tsafrir I, Sagi D, Arzi T, Guedeau-Boudeville MA, Frette V, Kandel D, Stavans J. Phys Rev Lett. 2001;86:1138. doi: 10.1103/PhysRevLett.86.1138. [DOI] [PubMed] [Google Scholar]
- 10.Veatch S, Keller S. Biophys J. 2003;85:3074. doi: 10.1016/S0006-3495(03)74726-2. [DOI] [PMC free article] [PubMed] [Google Scholar]
- 11.Baumgart T, Hess S, Webb W. Nature (London) 2003;425:821. doi: 10.1038/nature02013. [DOI] [PubMed] [Google Scholar]
- 12.D'Onofrio TG, Hatzor A, Counterman A, Heetderks J, Sandel M, Weiss P. Langmuir. 2003;19:1618. [Google Scholar]
- 13.Beattie M, Veatch S, Stottrip B, Keller S. Biophys J. 2005;89:1760. doi: 10.1529/biophysj.104.049635. [DOI] [PMC free article] [PubMed] [Google Scholar]
- 14.Tian A, Johnson C, Wang W, Baumgart T. Phys Rev Lett. 2007;98:208102. doi: 10.1103/PhysRevLett.98.208102. [DOI] [PubMed] [Google Scholar]
- 15.Dutta S, Ray DS. Phys Rev E. 2007;75:016205. doi: 10.1103/PhysRevE.75.016205. [DOI] [PubMed] [Google Scholar]
- 16.Garcia-Saz A, Chiantia S, Schwille P. J Biol Chem. 2007;282:33537. doi: 10.1074/jbc.M706162200. [DOI] [PubMed] [Google Scholar]
- 17.Yuan J, Hira S, Strouse G, Hirst L. J Am Chem Soc. 2008;130:2067. doi: 10.1021/ja710305c. [DOI] [PubMed] [Google Scholar]
- 18.Semrau S, Idema T, Holtzer L, Schmidt T, Storm C. Phys Rev Lett. 2008;100:088101. doi: 10.1103/PhysRevLett.100.088101. [DOI] [PubMed] [Google Scholar]
- 19.Ayuyan A, Cohen F. Biophys J. 2008;94:2654. doi: 10.1529/biophysj.107.118596. [DOI] [PMC free article] [PubMed] [Google Scholar]
- 20.Helfrich W. Z Naturforsch C. 1973;28:693. doi: 10.1515/znc-1973-11-1209. [DOI] [PubMed] [Google Scholar]
- 21.Nelson D, Piran T, Weinberg S, editors. Statistical Mechanics of Membranes and Surfaces. World Scientific; Singapore: 2004. [Google Scholar]
- 22.Lipowsky R, Sackman E, editors. Structure and Dynamics of Membranes—From Cells to Vesicles. A/B Vol. 1. Elsevier; Amsterdam: 1995. [Google Scholar]
- 23.Pozrikidis C. J Comput Phys. 2001;169:250. [Google Scholar]
- 24.Pozrikidis C. Boundary Integral and Singularity Methods for Linearized Viscous Flow. Cambridge University Press; Cambridge: 1992. [Google Scholar]
- 25.Du Q, Liu C, Wang X. J Comput Phys. 2004;198:450. [Google Scholar]
- 26.Du Q, Liu C, Wang X. J Comput Phys. 2006;212:757. [Google Scholar]
- 27.Du Q, Li M, Liu C. (B).Discrete Contin Dyn Syst. 2007;8:539. [Google Scholar]
- 28.Campelo F, Hernandez-Machado A. Eur Phys J E. 2006;20:37. doi: 10.1140/epje/i2005-10079-5. [DOI] [PubMed] [Google Scholar]
- 29.Biben T, Misbah C. Phys Rev E. 2003;67:031908. doi: 10.1103/PhysRevE.67.031908. [DOI] [PubMed] [Google Scholar]
- 30.Biben T, Kassner K, Misbah C. Phys Rev E. 2005;72:041921. doi: 10.1103/PhysRevE.72.041921. [DOI] [PubMed] [Google Scholar]
- 31.Jamet D, Misbah C. Phys Rev E. 2007;76:051907. doi: 10.1103/PhysRevE.76.051907. [DOI] [PubMed] [Google Scholar]
- 32.Jamet D, Misbah C. Phys Rev E. 2008;78:031902. doi: 10.1103/PhysRevE.78.031902. [DOI] [PubMed] [Google Scholar]
- 33.Kaoui B, Ristow GH, Cantat I, Misbah C, Zimmermann W. Phys Rev E. 2008;77:021903. doi: 10.1103/PhysRevE.77.021903. [DOI] [PubMed] [Google Scholar]
- 34.Barrett J, Garcke H, Nürnberg R. SIAM J Sci Comput (USA) 2008;31:225. [Google Scholar]
- 35.Veerapaneni S, Gueyffier D, Zorin D, Biros G. J Comput Phys. 2009;228:2334. [Google Scholar]
- 36.Song P, Hu D, Zhang P. Comm Comp Phys. 2008;3:794. [Google Scholar]
- 37.Kumar P, Gompper G, Lipowsky R. Phys Rev Lett. 2001;86:3911. doi: 10.1103/PhysRevLett.86.3911. [DOI] [PubMed] [Google Scholar]
- 38.Laradji M, Sunil Kumar PB. Phys Rev Lett. 2004;93:198105. doi: 10.1103/PhysRevLett.93.198105. [DOI] [PubMed] [Google Scholar]
- 39.Shillcock J, Lipowsky R. Nature Mater. 2005;4:225. doi: 10.1038/nmat1333. [DOI] [PubMed] [Google Scholar]
- 40.Wallace EJ, Hooper NM, Olmsted PD. Biophys J. 2005;88:4072. doi: 10.1529/biophysj.104.054288. [DOI] [PMC free article] [PubMed] [Google Scholar]
- 41.Noguchi H, Gompper G. Phys Rev E. 2006;73:021903. doi: 10.1103/PhysRevE.73.021903. [DOI] [PubMed] [Google Scholar]
- 42.Huang K, Mukhopadhyay R, Wingreen N. PLOS Comput Biol. 2006;2:e151. doi: 10.1371/journal.pcbi.0020151. [DOI] [PMC free article] [PubMed] [Google Scholar]
- 43.Laraddji M, Kumar P. J Chem Phys. 2006;123:224902. [Google Scholar]
- 44.Gau L, Shillcock J, Lipowsky R. J Chem Phys. 2007;126:015101. doi: 10.1063/1.2424698. [DOI] [PubMed] [Google Scholar]
- 45.Markvoort A, Smeijers A, Pieterse K, van Santen R, Hilbers P. J Phys Chem B. 2007;111:5719. doi: 10.1021/jp068277u. [DOI] [PubMed] [Google Scholar]
- 46.Grafmuller A, Shillcock J, Lipowsky R. Phys Rev Lett. 2007;98:218101. doi: 10.1103/PhysRevLett.98.218101. [DOI] [PubMed] [Google Scholar]
- 47.Smith K, Upsal W. J Chem Phys. 2007;126:075102. [Google Scholar]
- 48.Gao L, Lipowsky R, Shillcock J. Soft Matter. 2008;4:1208. doi: 10.1039/b801407h. [DOI] [PubMed] [Google Scholar]
- 49.Lipowsky R. J Phys II. 1992;2:1825. [Google Scholar]
- 50.Seifert U. Phys Rev Lett. 1993;70:1335. doi: 10.1103/PhysRevLett.70.1335. [DOI] [PubMed] [Google Scholar]
- 51.Jülicher F, Lipowsky R. Phys Rev Lett. 1993;70:2964. doi: 10.1103/PhysRevLett.70.2964. [DOI] [PubMed] [Google Scholar]
- 52.Jülicher F, Lipowsky R. Phys Rev E. 1996;53:2670. doi: 10.1103/physreve.53.2670. [DOI] [PubMed] [Google Scholar]
- 53.Andelman D, Kawakatsu T, Kawasaki K. Europhys Lett. 1992;19:57. [Google Scholar]
- 54.Kawakatsu T, Kawasaki K, Andelman D, Taniguchi T. J Phys II. 1993;3:971. [Google Scholar]
- 55.Taniguchi T, Kawasaki K, Andelman D, Kawakatsu T. J Phys II. 1994;4:1333. [Google Scholar]
- 56.Harden J, MacKintosh F. Europhys Lett. 1994;28:495. [Google Scholar]
- 57.Gozdz WT, Gompper G. Phys Rev E. 1999;59:4305. [Google Scholar]
- 58.Gozdz WT, Gompper G. Europhys Lett. 2001;55:587. [Google Scholar]
- 59.Harden JL, MacKintosh FC, Olmsted PD. Phys Rev E. 2005;72:011903. doi: 10.1103/PhysRevE.72.011903. [DOI] [PubMed] [Google Scholar]
- 60.Baumgart T, Das S, Webb W, Jenkins J. Biophys J. 2005;89:1067. doi: 10.1529/biophysj.104.049692. [DOI] [PMC free article] [PubMed] [Google Scholar]
- 61.Solis F, Funkhouser C, Thornton K. Europhys Lett. 2008;82:38001. [Google Scholar]
- 62.Taniguchi T. Phys Rev Lett. 1996;76:4444. doi: 10.1103/PhysRevLett.76.4444. [DOI] [PubMed] [Google Scholar]
- 63.Jiang Y, Lookman T, Saxena A. Phys Rev E. 2000;61:R57. doi: 10.1103/physreve.61.r57. [DOI] [PubMed] [Google Scholar]
- 64.McWhirter J, Ayton G, Voth G. Biophys J. 2004;87:3242. doi: 10.1529/biophysj.104.045716. [DOI] [PMC free article] [PubMed] [Google Scholar]
- 65.Lowengrub J, Xu JJ, Voigt A. Fluid Dyn Mater Process. 2007;3:1. [Google Scholar]
- 66.Funkhouser CM, Solis FJ, Thornton K. Phys Rev E. 2007;76:011912. doi: 10.1103/PhysRevE.76.011912. [DOI] [PubMed] [Google Scholar]
- 67.Campelo F, Hernandez-Machado A. Phys Rev Lett. 2007;99:088101. doi: 10.1103/PhysRevLett.99.088101. [DOI] [PubMed] [Google Scholar]
- 68.Wang X, Du Q. J Math Biol. 2008;56:347. doi: 10.1007/s00285-007-0118-2. [DOI] [PubMed] [Google Scholar]
- 69.Campelo F, Hernandez-Machado A. Phys Rev Lett. 2008;100:158103. doi: 10.1103/PhysRevLett.100.158103. [DOI] [PubMed] [Google Scholar]
- 70.Landau L. Statistical Physics. Butterworth-Heinemann; Oxford: 1984. [Google Scholar]
- 71.Vey S, Voigt A. Comput Visualization Sci. 2007;10:57. [Google Scholar]
- 72.Ayton G, McWhirter J, McMurtry P, Voth G. Biophys J. 2005;88:3855. doi: 10.1529/biophysj.105.059436. [DOI] [PMC free article] [PubMed] [Google Scholar]
- 73.F. Haußer, J. Lowengrub, A. Rätz, and A. Voigt (unpublished).
- 74.Mukherjee S, Maxfield S. Annu Rev Cell Dev Biol. 2004;20:839. doi: 10.1146/annurev.cellbio.20.010403.095451. [DOI] [PubMed] [Google Scholar]
- 75.Guillemin V, Pollack A. Differential Topology. Prentice-Hall; Englewood Cliffs, NJ: 1974. [Google Scholar]
- 76.Das S, Jenkins J. J Fluid Mech. 2008;597:429. [Google Scholar]
- 77.de Giorgi E. Progress in Nonlinear Differential Equations and their Applications: Composite Media and Homogenization Theory. Vol. 5. Springer; New York: 1991. p. 135. [Google Scholar]
- 78.Lowengrub J, Truskinovsky L. Proc R Soc London, Ser A. 1998;454:2617. [Google Scholar]
- 79.Rätz A, Voigt A. Commun Math Sci. 2006;4:575. doi: 10.4310/cms.2009.v7.n1.a4. [DOI] [PMC free article] [PubMed] [Google Scholar]
- 80.Rätz A, Voigt A. Nonlinearity. 2007;20:177. [Google Scholar]
- 81.Loreti P, March R. Eur J Appl Math. 2000;11:203. [Google Scholar]
- 82.Du Q, Liu C, Ryham R, Wang X. Nonlinearity. 2005;18:1249. [Google Scholar]
- 83.Röger M, Schätzle R. Math Z. 2006;254:675. [Google Scholar]
- 84.Cahn J, Hilliard J. J Chem Phys. 1958;28:258. [Google Scholar]
- 85.Allen S, Cahn J. Acta Metall. 1979;27:1085. [Google Scholar]
- 86.Verfürth R. A Review of A Posteriori Error Estimation and Adaptive Mesh-Refinement Techniques. Wiley-Teubner; Stuttgart: 1996. p. 127. (Wiley-Teubner Series Advances in Numerical Mathematics). [Google Scholar]
- 87.Kahya N, Scherfeld D, Bacia K, Poolman B, Schwille P. J Biol Chem. 2003;278:28109. doi: 10.1074/jbc.M302969200. [DOI] [PubMed] [Google Scholar]
- 88.Rätz A, Ribalta A, Voigt A. J Comput Phys. 2006;214:187. [Google Scholar]
- 89.Du Q, Liu C, Wang X. SIAM J Appl Math. 2005;65:1913. doi: 10.1137/S0036139903433219. [DOI] [PMC free article] [PubMed] [Google Scholar]
- 90.Du Q, Liu C, Ryham R, Wang X. Commun Math Sci. 2007;5:23. [Google Scholar]
- 91.Ruiz-Arguello M, Goni F, Alonso A. J Biol Chem. 1998;273:22977. doi: 10.1074/jbc.273.36.22977. [DOI] [PubMed] [Google Scholar]
- 92.Stottrip B, Stevens D, Keller S. Biophys J. 2005;88:269. doi: 10.1529/biophysj.104.048439. [DOI] [PMC free article] [PubMed] [Google Scholar]
- 93.Long M, Cans AS, Keating K. J Am Chem Soc. 2008;130:756. doi: 10.1021/ja077439c. [DOI] [PubMed] [Google Scholar]
- 94.Leibler S. J Phys (France) 1986;47:507. [Google Scholar]
- 95.Allain JM, Ben Amar M. Physica A. 2004;337:531. [Google Scholar]
- 96.Allain JM, Ben Amar M. Eur Phys J E. 2006;20:409. doi: 10.1140/epje/i2006-10030-4. [DOI] [PubMed] [Google Scholar]
- 97.Shi W, Feng XQ, Gao H. Acta Mech Sin. 2006;22:529. [Google Scholar]
- 98.Das S, Du Q. Phys Rev E. 2008;77:011907. doi: 10.1103/PhysRevE.77.011907. [DOI] [PubMed] [Google Scholar]
- 99.Du Q, Zhang J. SIAM J Sci Comput (USA) 2008;30:1634. [Google Scholar]


