

Abstract
We examined sustained attention deficits in bipolar disorder and associated changes in brain activation assessed by functional MRI. We hypothesized that relative to healthy participants, those with mania or mixed mania would (1) exhibit incremental decrements in sustained attention over time, (2) overactivate brain regions required for emotional processing, and (3) progressively underactivate attentional regions of prefrontal cortex. Fifty participants with manic/mixed bipolar disorder (BP group) and 34 healthy comparison subjects (HC group) received a functional MRI scan while performing a 15-min Continuous Performance Task (CPT). The data were divided into three consecutive 5-min vigilance periods to analyze sustained attention. Composite brain activation maps indicated that both groups activated dorsal and ventral regions of an anterior-limbic network, but the BP group exhibited less activation over time relative to baseline. Consistent with hypotheses 1 and 2, the BP group demonstrated a marginally greater behavioral CPT sustained attention decrement and more bilateral amygdala activation than the HC group, respectively. Instead of differential activation in prefrontal cortex over time as predicted in hypothesis 3, the BP group progressively decreased activation in subcortical regions of striatum and thalamus relative to the HC group. These results suggest that regional activation decrements in dorsolateral prefrontal cortex accompany sustained attention decrements in both bipolar and healthy individuals. Stable amygdala overactivation across prolonged vigils may interfere with sustained attention and exacerbate attentional deficits in bipolar disorder. Differential striatal and thalamic deactivation in bipolar disorder is interpreted as a loss of amygdala (emotional brain) modulation by the ventrolateral prefrontal-subcortical circuit, which interferes with attentional maintenance.
Keywords: amygdala, attention, bipolar disorder, CPT, fMRI, frontal lobe
Introduction
Manic episodes of bipolar disorder are characterized by impaired sustained attention or vigilance among other cognitive and affective symptoms1–5. As affective symptoms resolve and patients approach euthymia, attentional deficits improve, but often not to healthy performance levels6,7. The incremental decrement of attention over time that defines impaired sustained attention is especially relevant to functional outcomes in bipolar disorder. This decrement likely impedes social, school, and work activities that require lengthy attention spans, thereby preventing full assimilation back into society and contributing to the high morbidity rate in bipolar disorder8.
An anterior-limbic network responsible for modulating emotional-social behavior is thought to function abnormally in bipolar disorder producing mood symptoms9–10. The anterior-limbic network primarily consists of the ventrolateral prefrontal-subcortical circuit11,12 that further modulates amygdala and midline cerebellum required for emotional and motor expression. The ventrolateral prefrontal cortex (VLPFC) receives processed multisensory and visceral information to produce emotional responses and forms a feedback loop with striatum and thalamus as effector mechanisms for psychomotor responses13. The VLPFC plays an important role in monitoring limbic input, and lesions in this region can produce behavioral disinhibition and emotional lability14. Recent evidence also indicates that the VLPFC subserves effortful processing in healthy individuals15.
Beyond the anterior-limbic network per se, the anterior cingulate integrates VLPFC with “cognitive control” regions of dorsolateral prefrontal cortex (DLPFC)16 required for sustained attention17. Dysfunction within the primarily emotional anterior-limbic network may therefore lead to cognitive symptoms such as inattention. These regions work in concert to monitor internal and external sensory information to iteratively modulate behavior and, ultimately, maintain emotional and cognitive homeostasis11,12.
Functional magnetic resonance imaging (fMRI) and Positron Emission Tomography (PET) studies indicate that attention deficits in bipolar disorder may arise from abnormalities within portions of the anterior-limbic network and related structures10,18–21. Altered attentional activation patterns, particularly in prefrontal cortex and amygdala, have been associated with acute mania. During mania, the amygdala, and associated subcortical structures involved in emotional processing are overactivated20,22, but VLPFC activation is blunted18,23, possibly indicating a functional frontosubcortical “disconnection syndrome.” Indeed, abnormal functional connectivity between regions of frontal cortex and amygdala during emotional processing has been reported in bipolar disorder24,25, suggesting a possible disconnect in frontosubcortical coordination. This abnormal functional response may normalize with treatment25 and has been related to structural changes in white matter connectivity between frontal cortex and amygdala24. During euthymia VLPFC activation has been shown to be enhanced in the context of normalized sustained attention performance21. This effect may indicate a compensatory functional process by which VLPFC is recruited to help restrain emotional input and sustain attention through the cortical control of effort, and/or greater structural white matter connectivity with the amygdala.
The present study is based on the general hypothesis that activation decreases in cognitive regions of prefrontal cortex (e.g., DLPFC) in relation to performance decrements over an extended vigil. Performance decrements result when increasing competition for limited attentional capacity is not overcome by effortful control mechanisms of prefrontal cortex (e.g., VLPFC)26,27. Although a vigilance decrement occurs in healthy individuals, people with bipolar disorder show a much greater than normal loss of attention across even relatively short vigils2,6. The inability to allocate attention during extended performance could arise from competition for attentional resources by unmodulated affective processes. Neurophysiologically, this may be reflected in underactivation of prefrontal cortex (i.e., a loss of cortical control of attention) and overactivation in emotional brain regions. To our knowledge, the relationship between worsening attentional performance over an extended vigil and temporal (i.e., time-limited) changes in brain activation within the anterior-limbic network has not been examined using fMRI.
With the above considerations in mind, we examined associations between sustained attention performance and fMRI brain activation over an extended 15-min vigil using a non-emotional Continuous Performance Task-Identical Pairs (CPT-IP) version28. The study groups consisted of participants with manic or mixed bipolar disorder (BP group) and demographically similar healthy comparison participants (HC group). Relative to the HC group, we predicted that the BP group would exhibit (1) a disproportionate sustained attention decrement over time; (2) general overactivation of the amygdala (i.e., increased emotional input); and (3) less activation in prefrontal cortex over time (i.e., a progressive loss of cortical control of attention). The first and third prediction would be supported by the presence of a significant Group x Time interaction for CPT-IP sensitivity, and inferior frontal gyrus (IFG) or superior frontal gyrus (SFG) activation, respectively. The second prediction would be supported by a main effect of Group for amygdala activation. We also examined temporal relationships between brain activation and sustained attention performance to further characterize the above predictions.
Materials and methods
Participants
Adults with bipolar disorder (n=61) were recruited from the University Hospital inpatient psychiatry units. Participants with bipolar disorder were included if they met DSM-IV criteria for bipolar I disorder, current episode manic or mixed and had a Young Mania Rating Scale (YMRS)29 score ≥ 20. Demographically matched healthy adults (n = 37) were also recruited; these participants had no history of mood or psychotic disorders themselves or in any first-degree relative. A family history of Axis I psychopathology was evaluated during a demographic and medical overview with each healthy participant. All participants were between 18 and 50 years old, were physically and neurologically healthy and, if female, had a negative urine pregnancy test. Other exclusion criteria included any lifetime substance dependence or substance abuse within the previous three months, any chronic medical illness, any lifetime neurological illness, any known endocrine abnormality, loss of consciousness greater than five minutes, contraindications to receiving an MRI (e.g., metal implants), and diagnosis of mental retardation or documented full scale IQ < 85.
Participants were excluded from the statistical analysis if they had a CPT-IP sensitivity score less than 0.75 at Vigilance Period 1 (the first 5-min period), indicating an inability to perform the task or follow directions. Eight participants with bipolar disorder and one healthy participant were removed from further analysis by not meeting this minimum criterion. The eight participants with bipolar disorder who were excluded for poor performance did not significantly differ from the remaining participants with bipolar disorder on any demographic or clinical variable (p > 0.05). Additionally, three bipolar participants were excluded from analysis due to uncorrectable motion artifact in the imaging data. Two healthy participants were excluded due to missing behavioral data from a malfunction involving the response box. After excluding these 11 bipolar (18%) and three healthy participants (8%), the final sample was reduced to n = 50 (40 manic and 10 mixed) and 34 in the bipolar and healthy groups, respectively.
Forty (80%) bipolar participants were receiving at least one psychotropic medication and 10 (20%) were not receiving a psychotropic medication. Of those receiving medications, 10 (25%) were prescribed atypical antipsychotic monotherapy, eight (20%) were prescribed either lithium or antiepileptic monotherapy, one (3%) was prescribed antidepressant monotherapy, 3 (8%) were prescribed benzodiazepine monotherapy, 12 (30%) were prescribed an atypical antipsychotic and either lithium or an antiepileptic adjunctively, four (10%) were prescribed an atypical antipsychotic and antidepressant adjunctively, and 2 (5%) were in blinded clinical drug trials (possibly receiving placebo or active medication). Among the bipolar participants not receiving medications, all medications were self-discontinued at least 48 hrs prior to participation in this study. Healthy participants were not receiving psychotropic medications. All participants provided written informed consent prior to study participation after study procedures were fully explained. This study was approved by the medical Institutional Review Board of the University of Cincinnati.
Clinical assessments
Diagnoses were made using the mood (module A), psychosis (module B), psychotic differential (module C), mood differential (module D), and substance use (module E) modules of the Structured Clinical Interview for DSM-IV Axis I Disorders, Patient version (SCID-I/P)30, by investigators extensively trained in the use of this instrument with excellent established interrater reliability (kappa>0.90)31. Healthy participants were also evaluated using the SCID-I/P, as were first-degree relatives with suspected Axis I psychopathology with the research participant as the source of information. Diagnoses of current or past substance use disorders were established with the SCID-I/P and the Addiction Severity Index (ASI)32 to document specific drug and alcohol use during the previous month as well as lifetime years of use. Depressive and manic symptoms were evaluated using the Montgomery-Åsberg Depression Rating Scale (MADRS)33 and YMRS29, respectively.
Cognitive tasks
A Continuous Performance Test-Identical Pairs version (CPT-IP)28 was designed using E-Prime software (Psychology Software Tools Inc., Pittsburgh, PA) to explore the integrity of brain substrates involved in sustained attention. The CPT-IP involves continual monitoring of information through visual attention and bridging successive scenes registered in visual sensory memory (connecting trial n-1 information with trial n). The need to monitor performance across trials through visual attention produces performance decrements over shorter vigilance periods than simpler CPT versions, thereby reducing ceiling effects for behavioral data collected over a limited time period.
An extended CPT-IP task was presented on a personal computer using an event-related design. Stimuli were projected to the center of the visual field using nonferromagnetic goggles that provided a 30° field-of-view and obscured the peripheral visual field (Resonance Technologies Inc., Northridge, CA). Two 30-sec long passive visual control epochs immediately preceded and followed the experimental CPT-IP epoch to gauge baseline activation and scanner drift, respectively. The experimental epoch was administered over 15 min, between the control epochs, and was subsequently divided into thirds for the purpose of analysis6. There was no further alternation between experimental and control epochs so brain activation would not return to baseline between epochs, allowing observations of the continuous performance decrement over time. The CPT-IP and control tasks were practiced prior to scanning to insure compliance with the task instructions.
For each of two passive visual control epochs, participants were presented with a fixed stream of numbers beginning with number 30 and progressing in backward order through number 1 (i.e., 30, 29, 28…1). The one- or two-digit numbers were presented for 750 msec each with an inter-trial interval of 250 msec that incorporated a stimulus mask (i.e., ####). There was a total of 30 trials/30-sec epoch. Participants were simply instructed to monitor the numbers passively and that upon reaching number 1 the CPT-IP would begin (or the scanning session would end after the second countdown).
Figure 1 depicts the timing of the experimental CPT-IP trials. For the experimental trials, participants were presented with a pseudorandom stream of four-digit numbers (e.g., 5892) timed identical to the control trials (i.e., 750 msec presentations with inter-trial intervals of 250 msec incorporating a stimulus mask, for a total of 1000 msec/trial). There was a total of 900 trials/15-min epoch. Participants were instructed to respond as quickly and accurately as possible with a button press using the thumb of their right hand each time the same number appeared in two consecutive trials. Responses were recorded using a MRI-compatible button box. Target stimuli occurred on 15% of the total experimental trials (i.e., 135 trials/15-min epoch). The entire functional imaging protocol required 16.25 min of scanning time.
Figure 1.
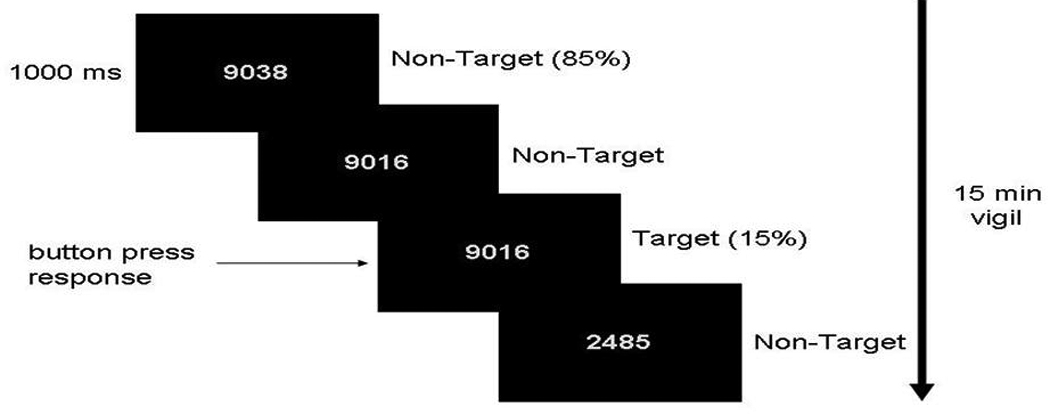
Trial progression of the CPT-IP. Participants were presented with a pseudorandom stream of four-digit numbers for 750 msec each with an inter-trial interval of 250 msec incorporating a stimulus mask (####, not shown), for a total of 1000 msec/trial. Target stimuli occurred on 15% of the total experimental trials.
Cognitive variables included the nonparametric signal detection indices of sensitivity (A′) and response bias (β″). Perceptual sensitivity is purported to measure the ability to discriminate between signal (targets) and noise (non-targets). Increased sensitivity typically involves a high hit rate and low false alarm rate. Response bias is purported to measure constructs other than sensitivity such as effort and motivation and reflects the degree to which “responses” or “non-responses” predominate. A positive response bias involves a relatively low hit and false alarm rate (a conservative tendency towards non-response) while a negative bias involves a high hit and false alarm rate (a liberal tendency towards response). For the proposed study, hit and false alarm rates were collected and used to calculate nonparametric signal-detection indices of A′ and β″, where x = probability of a false alarm and y = probability of a hit:
In addition to signal detection indices, hit reaction time (RT) was obtained on “go” trials as a measure of psychomotor processing speed for correct responses. The proportion of correct rejections (correct non-responses to non-target stimuli) was also obtained for each participant for direct comparison with event-related imaging analysis.
Image acquisition and post processing
All participants were scanned at the University of Cincinnati College of Medicine Center for Imaging Research using a 4.0 Tesla Varian Unity INOVA Whole Body MRI/MRS system (Varian Inc., Palo Alto, CA). During scan sessions, participants reclined in a supine position on the scanner bed and a radio-frequency coil was placed over the participant’s head and goggles were positioned over their eyes. Padding was inserted around each participant’s head to minimize movement. Following a three-plane gradient echo scan for alignment and brain localization, a shim procedure was performed to generate a homogeneous magnetic field. To provide anatomical localization for activation maps, a high-resolution, T1-weighted, 3-D brain scan was obtained using a modified driven equilibrium Fourier transform (MDEFT) sequence (TMD=1.1 sec, TR=13 msec, TE=6 msec, FOV=25.6×19.2×19.2 cm, matrix=256×192×96 pixels, flip angle=20°). A midsagittal reference scan was obtained to place 30 contiguous 5 mm axial slices extending from the inferior cerebellum to encompass the entire brain. Participants then completed an fMRI session in which scans were acquired while performing the CPT-IP task using a T2*-weighted gradient-echo echoplanar imaging (EPI) pulse sequence (TR/TE=2000/30 msec, FOV=25.6×25.6 cm, matrix=64×64 pixels, slice-thickness=5 mm, flip angle=75°).
Imaging data were processed and analyzed using AFNI (Analysis of Functional NeuroImages; http://afni.nimh.nih.gov/afni). Following image data acquisition, the MRI images were reconstructed using in-house software developed in Interactive Display Language (IDL), which converts the raw data into AFNI format. In AFNI, MDEFT (structural) and EPI (functional) images were coregistered using scanner coordinates. The EPI data were then motion-corrected to an early volume in the fMRI run.
Due to the duration of the CPT-IP, we employed several procedures to minimize movement artifact. Functional images were corrected for motion using a six-parameter rigid body transformation34. We used motion correction parameters to calculate the total motion in six directions of rotation and translation from the beginning of each run. The maximum motion of any participant included in the analysis was <4 mm. The average total displacement for all participants was <1 mm. Additionally, each volume was inspected for signal artifact using a semi-automated algorithm in AFNI to identify questionable TRs. These volumes were removed from further analysis if visual inspection indicated uncorrectable head movement, i.e., within-TR head motion, or >30% of voxels were >2 SDs from the mean signal intensity. On average we removed <5% of the volumes from each run using these procedures. Finally, motion correction parameters were included as regressors of no interest in the deconvolution step described below.
Using tools in AFNI35, anatomical and functional maps were transformed into stereotactic Talairach space using the ICBM452 template and spatially smoothed using a Gaussian filter of 6 mm full-width-at-half-maximum. Binary masking was applied to each image to remove voxels outside the brain. Individual activation maps were then created for each participant using a deconvolution algorithm that compares the actual hemodynamic response to a canonical hemodynamic response function (e.g., gamma function), creating voxel-wise t-statistic maps. This process generates an estimate of the ‘fit coefficient,’ i.e., beta weight at each voxel position, in AFNI which defines the magnitude of the hemodynamic response relative to the average signal intensity. This beta-weight or its average across a defined ROI is the primary variable of interest in calculations and represents the change in activation from the baseline task, i.e., non-response to the visual count down condition, 30 sec at both the beginning and end of the CPT-IP. Event-related hemodynamic response functions were calculated for each possible event (hits, misses, false alarms, and correct rejections).
Figure 2 depicts an anterior-limbic network region-of-interest (ROI) mask created based on our definition of this network. The ROI mask was applied to each individual’s fMRI data in order to obtain the average activation within an ROIs. The anterior-limbic ROIs included bilateral IFG (analogous to VLPFC), striatum (including caudate and putamen), globus pallidus, thalamus, amygdala, and midline cerebellum (i.e., cerebellar vermis). We adopted the anatomical regions defined36 on the Montreal Neurological Institute single-subject template brain,37 except for the cerebellar ROI, which was created in the vermis as an 8 mm radius sphere centered on coordinate x=5 mm left, y=53 mm posterior, and z=34 mm inferior to the anterior commissure. Additionally, we included a bilateral SFG ROI (analogous to DLPFC) because this region is implicated for CPT measures of sustained attention.17 A SFG mask was created based on the boundaries of Yamasaki et al.16 and Jha and McCarthy38 and spanned 10–33 mm anterior to the anterior commissure. The average activation within each ROI was extracted from each participant’s fMRI deconvolution results and used as input to the statistical analyses of brain activation described below. Although only group differences in frontal cortex and amygdala were hypothesized, we included other subcortical ROIs with direct connections to these structures to provide a network approach to the analysis.
Figure 2.
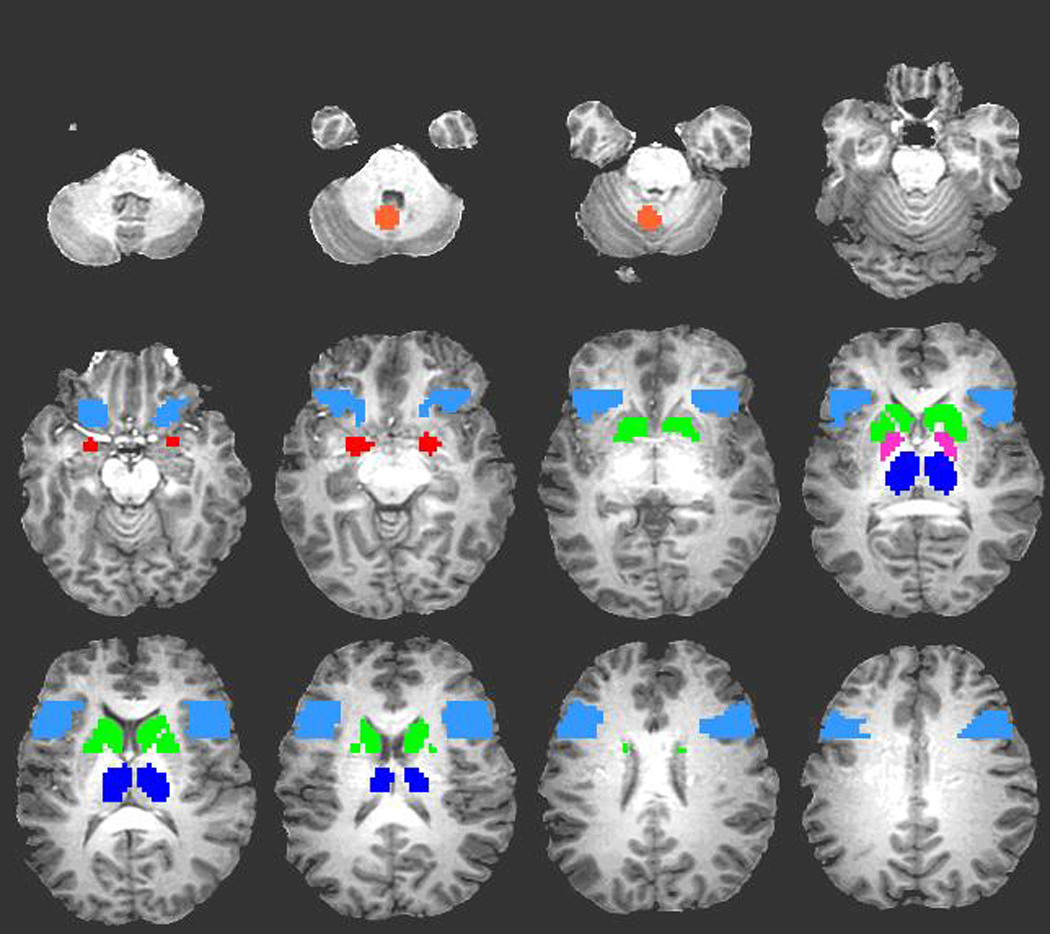
Regions of the anterior-limbic network mask overlaid on T1-weighted anatomic image. Colors represent eleven regions of interest (ROI) including midline cerebellum (orange), bilateral amygdala (red), bilateral inferior frontal gyrus (light blue), bilateral striatum (green), bilateral globus pallidus (pink), and bilateral thalamus (dark blue). Not shown is bilateral superior frontal gyrus representing the final two ROIs.
Statistical analysis
The demographic, clinical, cognitive, and ROI variables were analyzed using SPSS (Statistical Package for the Social Sciences, Chicago, IL). Group comparisons of the demographic, clinical, and secondary cognitive variables (i.e., β″ and Hit RT) were made using independent sample t-tests and χ2-tests for continuous and nominal variables, respectively. Effect size estimates were also calculated for continuous and nominal variables using d and Cramer’s V, respectively. Sensitivity (A′) and the proportion of correct rejections were the cognitive variables of primary interest because A′ is the best estimate of signal detection39 and correct rejections were the trials modeled in the imaging analysis. For each of these two variables a 2 (Group: bipolar, control) x 3 (Time: vigilance period 1, 2, 3) mixed analysis of covariance (ANCOVA) was conducted controlling for education and IQ. In the presence of a significant omnibus effect or interaction, post-hoc comparisons were made using Tukey HSD tests.
For the fMRI analysis, General Linear Model tests were performed for each participant to determine contrasts of correct rejections against the combination of hits, misses, and false alarms. We chose to model correct rejections because these trials most closely approximate our theoretical model of sustained attention as the ability to maintain attention in the context of continual extended monitoring of primarily non-target stimuli and non-response40,41. Individual activation maps were used as the data for the final event-related analysis. In AFNI, we initially performed voxel-wise analyses to visualize general patterns of task-related activation relative to baseline activation across the entire brain. One sample t-tests were performed for each voxel across participants within each group to create group specific composite images at each time interval. A conservative combination of activation threshold level (p<0.01) and voxel cluster size (≥100 contiguous voxels) was used to control for multiple comparisons (corrected p<0.0001). Corrected p-values were determined using Monte Carlo simulation tools in AFNI.
Region-of-interest analyses were then conducted using the anterior-limbic network mask. Initially, one sample t-tests were performed for each ROI at each vigilance period relative to zero activation to determine the extent of task-related activation for each group independently. Significant results are reported at p<0.004 after Bonferroni correction for multiple comparisons. Next, each anterior-limbic network ROI was entered into a 2 (Group: bipolar vs. healthy) x 3 (Time: vigilance period 1, 2, 3) mixed model ANCOVA (controlling for education, IQ, and CPT-IP correct rejections) to examine interaction terms.
Within-group partial Pearson correlations, controlling for education, IQ, and CPT-IP correct rejections, were also conducted between cognitive performance (A′) and brain activation (within pre-identified ROIs) in both study groups, and between symptom scores (YMRS, MADRS) and brain activation in the BP group. For these analyses, difference scores in A′ and ROIs between vigilance periods 1 and 3 were used as the data to estimate temporal relationships. All activation values used for these analyses represented average activation within the predefined ROIs.
Finally, potential medication effects were examined by contrasting the 40 patients receiving medications with the 10 patients off medications using a 2 (Medication Status: on vs. off) x 3 (Time: vigilance period 1, 2, 3) mixed model ANCOVA (controlling for education, IQ, and CPT-IP correct rejections). For all analyses, results are only reported for statistically significant effects at p < 0.05 and marginally significant effects at p = 0.06.
Results
Demographic, clinical, and general cognitive characteristics
Table 1 provides statistical comparisons for a variety of demographic, clinical, and cognitive characteristics between the HC and BP study groups. The groups were matched on all demographic variables with the exception of years of formal education [t(82)=3.01, p<0.01] and full-scale IQ [t(82)=3.59, p<0.01], estimated using the American modification of the National Adult Reading Test (ANART)42. These two variables were included as covariates in the primary behavioral and ROI imaging analyses. As expected based on the inclusion/exclusion criteria, the BP group was rated as significantly more manic and depressed relative to the HC group [t(82)=28.22, p<0.001 and t(82)=10.14, p<0.001, respectively].
Table 1.
Demographic, clinical, and cognitive characteristics of the study groups.
| Healthy subjects | Bipolar patients | Effect size | |||
|---|---|---|---|---|---|
| Characteristic | (n = 34) | (n = 50) | d / V | ||
| Age, years (SD) | 31 | (9) | 30 | (10) | 0.1 |
| Sex, n (%) women | 20 | (59) | 35 | (70) | 0.1 |
| Ethnicity, n (%) white | 30 | (88) | 40 | (80) | 0.1 |
| Education, years (SD) a | 15 | (2) | 13 | (2) | 1.0 |
| ANART, IQ score (SD) b | 113 | (5) | 106 | (10) | 0.8 |
| Handedness, n (%) right c | 31 | (91) | 40 | (93) | 0.1 |
| YMRS, total score (SD) d | 1 | (1) | 25 | (5) | 6.1 |
| MADRS, total score (SD) e | 1 | (1) | 14 | (8) | 2.1 |
| Response Bias, β″, (SD) | 0.70 | (0.15) | 0.65 | (0.21) | 0.3 |
| Hit reaction time, msec, (SD) | 697 | (75) | 676 | (73) | 0.3 |
t(82) = 3.01, p < 0.01.
t(82) = 3.59, p < 0.01.
Bipolar patient n = 43.
t(82) = 28.22, p < 0.001.
t(82) = 10.14, p < 0.001.
CPT-IP performance
As seen in Table 1, the HC and BP groups performed the CPT-IP with similar response styles and speeds as indicated by statistically similar β″ and Hit RT scores, respectively. With respect to the primary sensitivity variable, while the HC group evidenced a decreasing sensitivity function across vigilance periods 1, 2, and 3 (0.91±0.05, 0.89±0.06, 0.88±0.07, respectively), the decrement was steeper in the BP group (0.89±0.06, 0.85±0.08, 0.83±0.08, respectively). This pattern suggests that the BP group was less able to discriminate targets from non-targets relative to the HC group, especially later in the vigil, consistent with a sustained attention deficit. However, the existence of a sustained attention deficit was only partially supported by ANCOVA, which demonstrated a significant main effect of Group [F(1,80)=6.54, p<0.05], but that was qualified by a marginal Time x Group interaction [F(2,160)=2.89, p=0.06]. Between-group comparisons indicated that the HC group outperformed the BP group at vigilance periods 2 and 3 [F(1,80)=6.74, p<0.05; F(1,80)=7.06, p<0.01], accounting for the near interaction.
The behavioral analysis of correct rejection trials indicated that the HC group outperformed the BP group overall (0.97±.005 vs. 0.95±.004), but that Time had little overall influence. This impression was confirmed by ANCOVA yielding only a significant main effect of Group [F(1,80)=4.16, p<0.05]. A null Time x Group interaction [F(2,160)=0.06, p=0.95] is a good indication that the two groups processed correct rejections in similar fashion. Due to the significant Group effect, however, correct rejections were included as covariates in the primary ROI analysis.
Voxel-wise brain activation relative to baseline
In order to visualize the overall pattern of task-related activation relative to baseline across the entire brain, we generated composite within-group, voxel-wise activation maps for each 5-min vigilance period of CPT-IP performance. As illustrated in Figure 3, activation patterns were qualitatively similar in each group at vigilance period 1. At period 1, both groups demonstrated peak activation (yellow) in SFG and portions of bilateral IFG, along with bilateral activation in posterior brain regions outside of the anterior-limbic network. The HC group activated midline cerebellum while the BP group demonstrated thalamic activation. Peak deactivation (light blue) was concentrated around right anterior cingulate in both groups. The HC group evidenced additional areas of deactivation in left posterior cingulate and right angular gyrus consistent with other studies of visual attention41. Note the lack of deactivation (blue scale) in either study group beyond vigilance period 1, and the stability of peak activation across time in the HC group relative to the precipitous drop in activation in the BP group beyond period 1 (direct group comparisons follow). Although the amygdala did not evidence significant activation/deactivation in either group in this voxel-wise analysis, the cluster size employed was relatively conservative without small volume correction.
Figure 3.
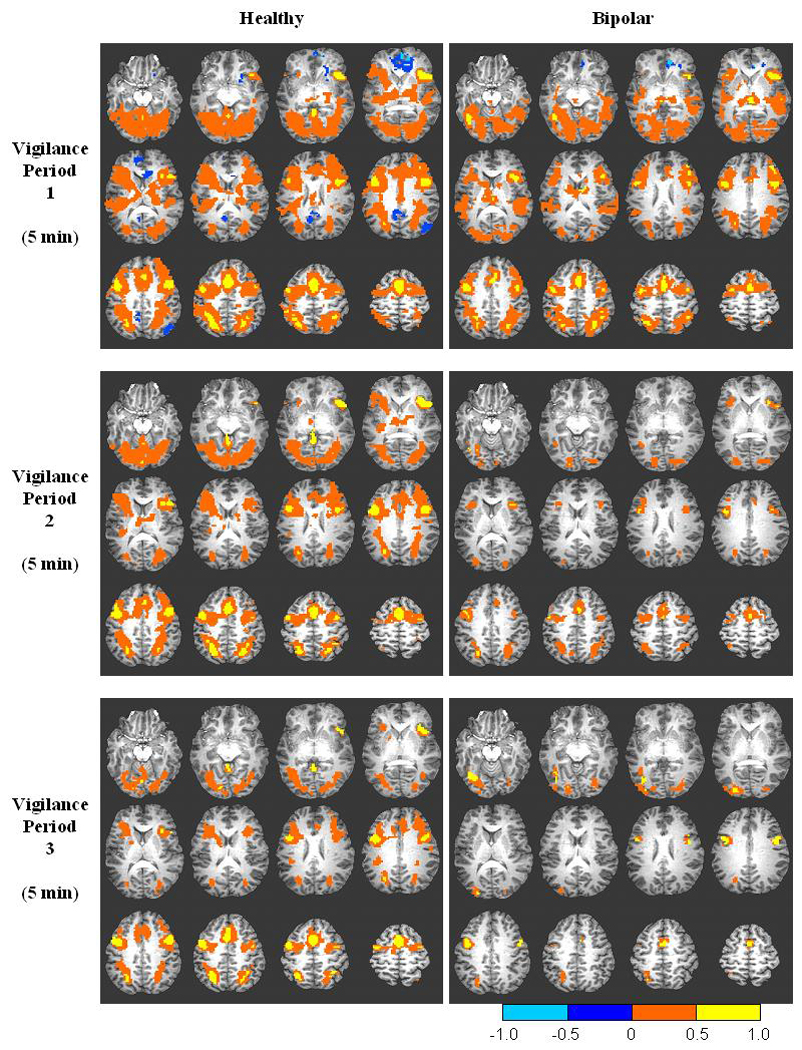
Composite functional brain maps of CPT-IP activation for correctly rejected trials in each successive vigilance period overlaid on T1-weighted anatomic image for the healthy and bipolar groups. Significant activation is defined as threshold p < 0.01 with voxel cluster size ≥ 100 to control for multiple comparisons (corrected p < 0.0001). Orange and blue scales represent activation and deactivation, respectively, relative to a zero activation baseline.
ROI brain activation relative to baseline
We also examined task-related activation relative to baseline within our a priori defined ROIs. At vigilance period 1, CPT-IP performance activated regions of frontal cortex consistent with expectations for a test of sustained attention. Right SFG and bilateral IFG were strongly activated relative to baseline in both the HC [t(33)=4.92, p<0.001, t(33)=6.71, p<0.001, t(33)=7.72, p<0.001, respectively] and BP groups [t(49)=3.97, p<0.001, t(49)=4.52, p<0.001, t(49)=4.82, p<0.001, respectively]. The HC group also activated bilateral thalamus and midline cerebellum significantly above baseline levels [t(33)=3.91, p<0.001, t(33)=3.43, p<0.002, t(33)=4.59, p<0.001, respectively] while the BP group activated left thalamus above baseline [t(49)=3.71, p<0.001] at period 1.
Beyond vigilance period 1, the HC group continued to significantly activate bilateral IFG [t(33)=4.99, p<0.001, t(33)=5.81, p<0.001] along with left thalamus [t(33)=3.30, p<0.002] and midline cerebellum [t(33)=3.08, p<0.004] above baseline at vigilance period 2. Moreover, strong right IFG activation continued at vigilance period 3 in the HC group [t(33)=3.77, p<0.001]. The BP group failed to activate any ROI relative to baseline beyond vigilance period 1, and neither group evidenced significant deactivation relative to baseline after statistical correction for multiple comparisons (although the HC group demonstrated a consistent pattern of deactivation in bilateral amygdala).
Group x Time analysis within each ROI
Mixed ANCOVAs on the average MR signal intensity within a priori defined ROIs were conducted to examine potential Group x Time interactions. Within left SFG there was a significant reduction in activation across vigilance period 1 (0.0018±0.0005), 2 (0.0014±0.0007), and 3 (0.0013±0.0008) that was similar in each study group. This impression was confirmed by a significant main effect of Time [F(2,154)=3.94, p<0.05].
As depicted in Figure 4, the groups differentially activated left striatum over time. Within this structure the BP group demonstrated decreasing activation over time while the HC group demonstrated increasing activation. This impression was partially confirmed by a marginally significant Group x Time crossover interaction [F(2,154)=2.90, p=0.06].
Figure 4.
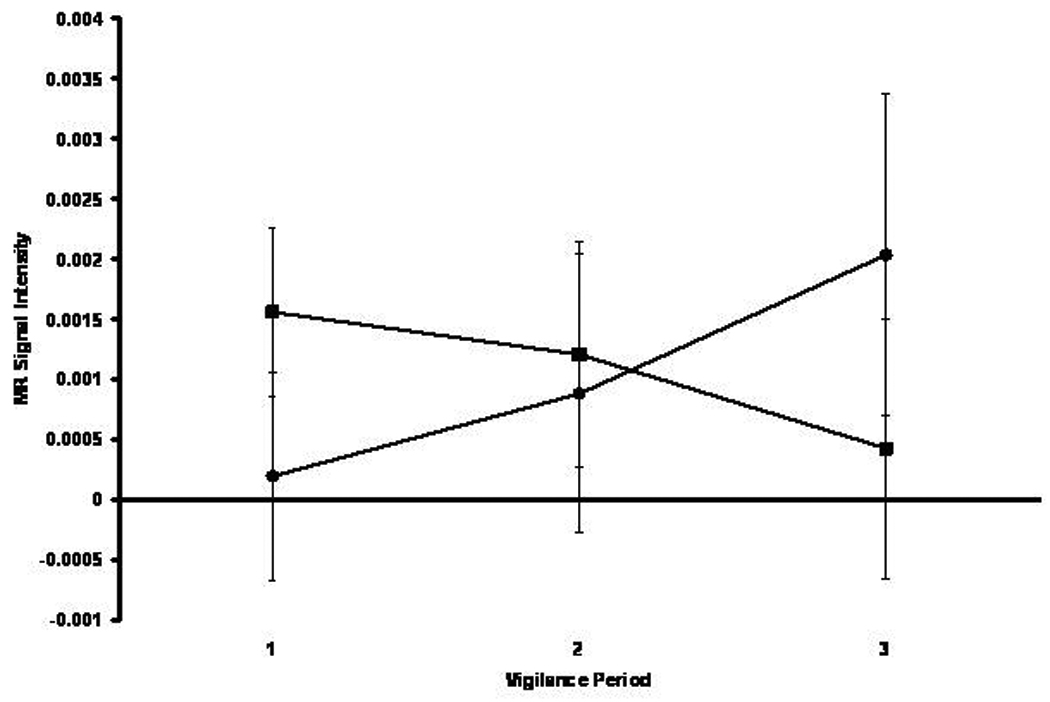
Mean MR signal intensity in left striatum for the healthy comparison (black circle) and bipolar (black square) groups across three successive 5-min vigilance periods corresponding to performance early, intermediate, and late in the 15-min vigil.
As depicted in Figure 5, the groups also differentially activated left thalamus over time. Within this structure the BP group demonstrated decreasing activation over time while the HC group’s function was essentially flat. This impression was confirmed by a significant Group x Time interaction [F(2,154)=4.06, p<0.05]. A similar pattern of interaction (not pictured) was also identified in right thalamus [F(2,154)=3.29, p<0.05].
Figure 5.
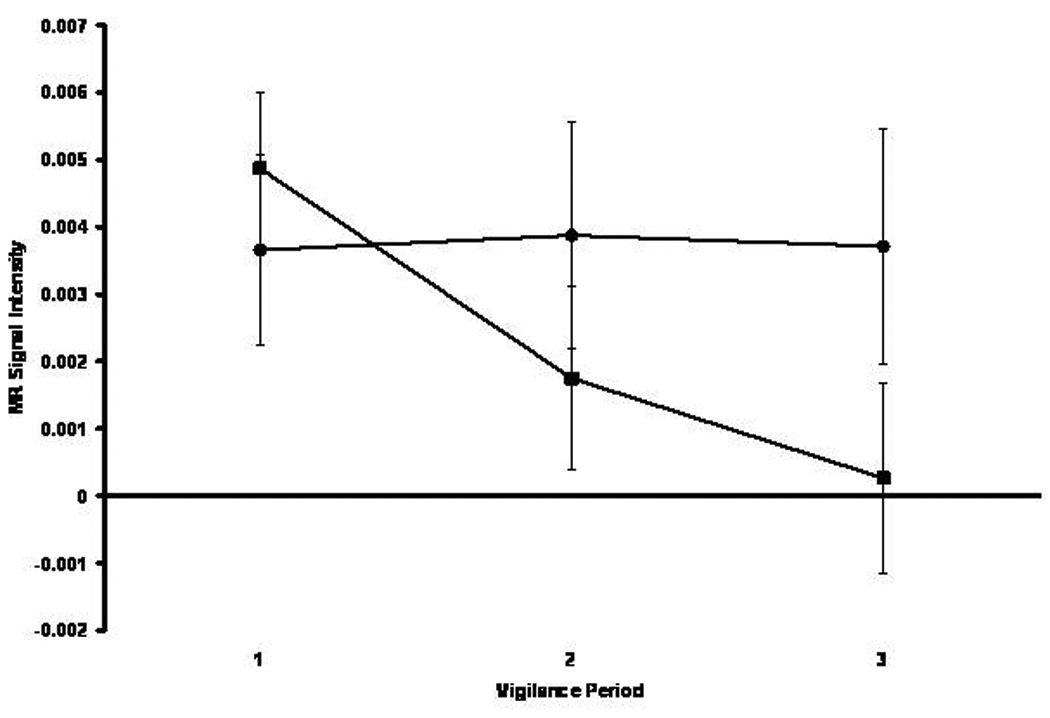
Mean MR signal intensity in left thalamus for the healthy comparison (black circle) and bipolar (black square) groups across three successive 5-min vigilance periods corresponding to performance early, intermediate, and late in the 15-min vigil.
The BP group significantly activated (0.0015±0.0015) left amygdala relative to the HC group who deactivated this structure (−0.0036±0.0019). This impression was confirmed by a significant main effect of Time [F(1,77)=4.04, p<0.05]. As depicted in Figure 6, the study groups differentially activated right amygdala over time. The BP group showed less activation over time and the HC group showed less deactivation over time. This impression was confirmed by a significant Group x Time interaction [F(2,154)=3.17, p<0.05]. Note that the BP and HC groups significantly activated and deactivated amygdala, respectively. No other ROI evidenced a significant main effect or interaction.
Figure 6.
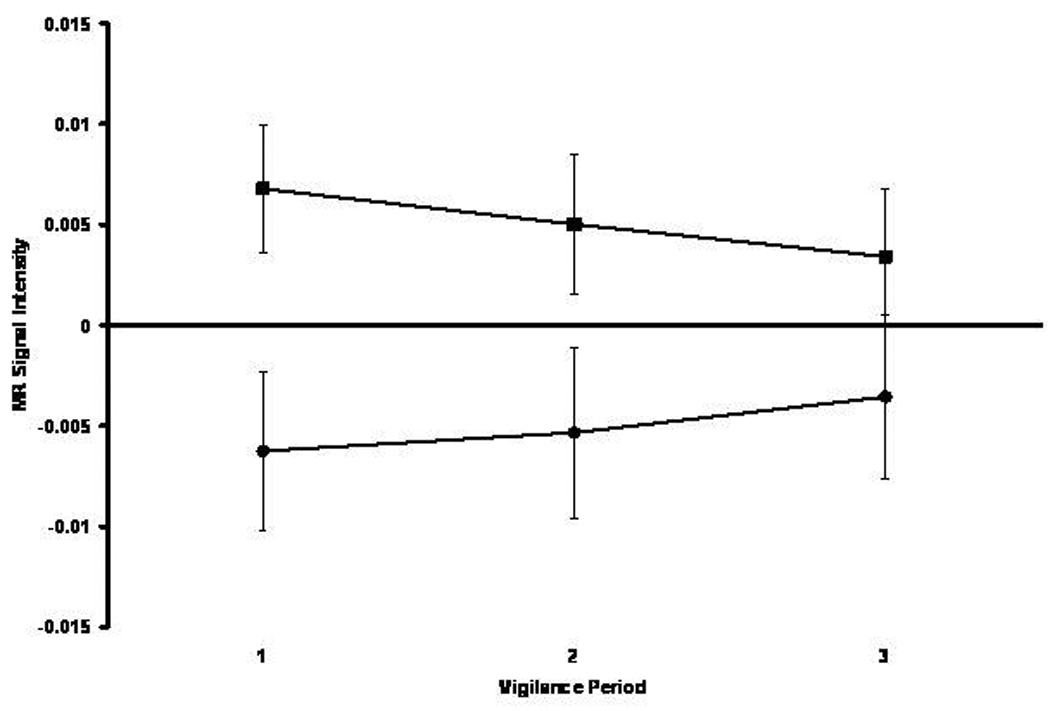
Mean MR signal intensity in right amygdala for the healthy comparison (black circle) and bipolar (black square) groups across three successive 5-min vigilance periods corresponding to performance early, intermediate, and late in the 15-min vigil.
Mood and performance associations with ROIs
No significant mood symptom/ROI relationships were identified within the BP group. Furthermore, no significant cognitive performance/ROI relationships were identified within either the BP or HC group.
Medication influences
Forty patient participants were receiving psychotropic medications either as monotherapy or adjunctive therapy while 10 had not received psychotropic medications for at least 48 hrs prior to testing. To examine the influence of medication on neurophysiology we conducted mixed 2 (Group: medicated vs. unmedicated) x 3 (Vigilance Period: 1, 2, 3) ANCOVAs on all ROIs. Significant main effects of Group were identified for both right IFG and midline cerebellum [F(1,43)=4.51, p<0.05; F(1,43)=6.56, p<0.05]. Activation was significantly reduced in the medicated group relative to the unmedicated group for both right IFG (0.0106±0.0035 vs. 0.0002±0.0017) and cerebellum (0.0084±0.0025 vs. 0.0023 ±0.0012). A post-hoc analysis was also conducted in which the two patient participants in blinded clinical drug trials were removed from the medicated group (adjusted n=38) with no impact on the level of statistical significance (Group effects for right IFG and cerebellum, p<0.05).
Discussion
This study evaluated brain activity over a 15-min CPT-IP vigil in manic/mixed patients with bipolar disorder and healthy individuals. As predicted, the BP group evidenced a decrement in CPT-IP sensitivity over time that was steeper than in the HC group. Consistent with the previous literature2,6, the BP group suffered from an increasingly pronounced sustained attention deficit despite relatively good baseline performance. However, the effect was only partially confirmed by a marginally significant Group x Time interaction, so despite consistency with the previous literature, this result should be considered preliminary until it can be further replicated. This deficit was not the result of group differences in response bias, which is sensitive to fatigue and motivation, or response speed2.
The CPT-IP initially activated prefrontal cortex as demonstrated in voxel-wise analysis and confirmed in ROI analysis relative to baseline activation. As expected for a CPT, regions of DLPFC (SFG and IFG) were strongly activated in both study groups at vigilance period 1. Beyond vigilance period 1, the HC group continued to activate IFG at vigilance periods 2 and 3, while the BP group failed to activate frontal cortex relative to baseline levels. These results suggest that while both groups initially activated frontal control mechanisms early in the vigil this activation rapidly diminished in the BP group after five minutes.
Consistent with the second prediction, the BP group not only overactivated bilateral amygdala relative to the HC group as in previous studies22, but the HC group deactivated amygdala, suggesting that patients with bipolar disorder have functional abnormalities in both the magnitude and direction of activation. The amygdala was the only structure demonstrating bilateral Group effects (BP>HC) and the only structure in which activation consistently differed relative to baseline (BP>baseline>HC). This finding may represent abnormally increased emotional input to the anterior-limbic network in bipolar disorder. Although the Group effect was also qualified by an interaction with Time in right amygdala, even here the group effect was obvious and significant.
Unlike the first and second prediction, the third prediction was only partially confirmed. Although both study groups demonstrated less left SFG activation over time, the BP group showed no less activation than the HC group as evidenced by the lack of an interaction. Additionally, no significant interactions were identified for IFG. These findings suggest that left SFG activation, in particular, decreases over extended vigils, implicating dorsolateral prefrontal cortex in the CPT performance of both healthy and psychiatric samples17.
Although no distinct differences in prefrontal cortical activation were identified between the groups as expected on the rationale that the BP group would have less cortical control of attention as a consequence of increased emotional input to the system by amygdala overactivation, other regions within the VLPFC-subcortical circuit showed differential group activation over time. In particular, both left striatum and bilateral thalamic activation differed by group over time as indicated by significant or marginally significant interactions. Within the striatum, the BP and HC groups progressively decreased and increased activation over time, respectively. Within the thalamus, the BP group decreased activation over time relative to a flat temporal pattern in the HC group. Blumberg et al.19 also reported striatal (i.e., putamen) and thalamic dysfunction in adolescents in a primarily depressed state of bipolar disorder on a test of selective attention (i.e., a Stroop task), but activation was increased relative to healthy controls, possibly indicating a differential effect of mood state (depression vs. mania) or attentional task (Stroop vs. CPT-IP), or a developmental change from adolescence to adulthood19. Although the significance of these findings is uncertain, they may suggest that subcortical structures within the VLPFC-subcortical circuit, and anterior-limbic network more generally, are the primary regions of abnormal attentional activation across adolescence and early adulthood during acute states of bipolar disorder. It is also possible that there is a specific loss of prefrontal control of subcortical iterations in bipolar disorder as previously demonstrated by attenuated activation in ventral prefrontal cortices relative to healthy controls18 that the CPT-IP is less sensitive to than are some other tasks.
In the BP group subcortical activation decrements occurred as attention waned, while in the HC group activation was more stable or even increased over time, possibly representing a compensatory mechanism to maintain attention. Perhaps, in the absence of increased VLPFC activation to monitor and regulate emotional output by the amygdala as demonstrated in euthymia21, subcortical attentional processing is compromised. In other words, a lack of prefrontal lobe activation to compensate for emotional dysregulation in mania may result in subcortical activation/cognitive decrements over time.
It is unlikely that these findings are substantially influenced by confounding factors. The study groups were well matched on most demographic and clinical variables, with the exception of years of education and IQ scores. Despite these differences, on average, members of both groups had college-level educations and were of average intelligence. Based on previous research and published normative data for clinical CPTs, we expect few performance differences in individuals within these education and IQ ranges44. Additionally, these factors were statistically controlled in the primary cognitive and imaging analyses. With respect to performance, even at vigilance period 3 the BP group performed well above chance, indicating that they continued to give good effort throughout the task. Moreover, although the HC group outperformed the BP group on the proportion of CPT-IP correct rejections, the null Time x Group interaction is a good indication that the two groups processed correct rejections in similar fashion. To be conservative, as this was the performance variable of interest in the primary ROI analyses, correct rejections were included (along with education and IQ) as covariates.
As with any clinical study, a number of limitations should be considered when interpreting the results. Foremost, the results of this study are somewhat limited by variations in the medication status of the BP group. A direct comparison indicated that activation was reduced in medicated relative to unmedicated patients in both right IFG and midline cerebellum. The relative lack of activation in IFG, in particular, in medicated patients may help explain why this region was not implicated in any of the primary imaging analyses as expected. However, in that IFG and cerebellar effects were null in the primary analysis, it is unlikely that medication status influenced the obtained results directly. The effect of medication on distal portions of the anterior-limbic network through direct IFG and cerebellar activity, though less likely, cannot be ruled out. This sub-analysis should be interpreted cautiously, however, due to the small sample of unmedicated patient participants (n=10) and the possibility that unmedicated patients are simply healthier. Future studies using larger samples and functional connectivity approaches could help flesh out medication effects.
A second limitation is the inclusion of participants with past alcohol or substance abuse which might also have influenced the results and be considered a limitation. However, patient participants with a history of past alcohol abuse did not have outlying values (i.e., scores > 2 SD from the group mean or scores < the 5th or > the 95th percentile) on any cognitive or activation measure. Previous research demonstrates that the three month time frame we used to define abuse remission is sufficient for structural abnormalities in primary alcoholism to return to healthy volumetric values45. Third, unmedicated patients were required to have not taken psychotropic medications for at least 48 hours, but certain antipsychotic and antidepressant agents may require longer washout periods. Although the actual time frame was not determined due to the difficulty in getting accurate estimates, it should be noted that participants in the unmedicated group generally consisted of inpatients admitted for an acute exacerbation of mania due to medication non-adherence. Therefore, it is likely that the medication-free period would have been greater than two days. Finally, anxiety disorders were not assessed on the SCID-I/P. Although all participants with bipolar disorder in the present study were hospitalized and treated for primary mood symptoms, the possible influence of concurrent anxiety disorders on the findings, and the lifetime incidence of anxiety disorders, is unknown.
The present study suggests that sustained attention deficits characterizing manic patients with bipolar disorder have measurable neurophysiological correlates. The findings indicate that amygdala overactivation characterizes manic bipolar disorder, even on the emotionally neutral CPT-IP version, and is independent of time in left amygdala. Superior frontal gyrus activation, on the other hand, occurs similarly in both bipolar and healthy individuals, and appears to represent the primary neurophysiological response to sustained attention in general. The greatest differential impact of sustained attention processing is on subcortical structures, including striatal structures (caudate and putamen) and thalamus. The extent to which these abnormalities represent a failure of cortical constraint on amygdala overactivation requires investigations of patients with bipolar disorder across mood states. During mania, the amygdala has been shown to be overactivated20,22, while during euthymia VLPFC activation is enhanced 21, possibly as a compensatory process to help restrain emotional input and sustain attention through the cortical control of effort. Although we are undertaking projects including both manic and euthymic groups to address this issue, the present findings provide the first evidence that acute mania involves a sustained attention decrement associated with differential neurophysiological processing over time.
Acknowledgements
This work was supported in part by National Institute of Mental Health grants MH070849 (DEF) and MH58170 (SMS).
References
- 1.Addington J, Addington D. Attentional vulnerability indicators in schizophrenia and bipolar disorder. Schizophr Res. 1997;23:197–204. doi: 10.1016/s0920-9964(96)00105-3. [DOI] [PubMed] [Google Scholar]
- 2.Fleck DE, Sax KW, Strakowski SM. Reaction time measures of sustained attention differentiate bipolar disorder from schizophrenia. Schizophr Res. 2001;52:251–259. doi: 10.1016/s0920-9964(01)00170-0. [DOI] [PubMed] [Google Scholar]
- 3.Liu SK, Chiu CH, Chang CJ, Hwang TJ, Hwu HG, Chen WJ. Deficits in sustained attention in schizophrenia and affective disorders: Stable versus state-dependent markers. Am J Psychiatry. 2002;159:975–982. doi: 10.1176/appi.ajp.159.6.975. [DOI] [PubMed] [Google Scholar]
- 4.Nuechterlein KH, Dawson ME, Ventura J, Miklowitz D, Konishi G. Information processing anomalies in the early course of schizophrenia and bipolar disorder. Schizophr Res. 1991;5:195–196. doi: 10.1016/0920-9964(91)90069-4. [DOI] [PubMed] [Google Scholar]
- 5.Sax KW, Strakowski SM, McElroy SL, Keck PE, Jr, West SA. Attention and formal thought disorder in mixed and pure mania. Biol Psychiatry. 1995;37:420–423. doi: 10.1016/0006-3223(95)00310-D. [DOI] [PubMed] [Google Scholar]
- 6.Fleck DE, Shear PK, Strakowski SM. Processing efficiency and sustained attention in bipolar disorder. J Int Neuropsychol Soc. 2005;11:49–57. doi: 10.1017/S1355617705050071. [DOI] [PubMed] [Google Scholar]
- 7.Wilder-Willis KE, Sax KW, Rosenberg HL, Fleck DE, Shear PK, Strakowski SM. Persistent attentional dysfunction in remitted bipolar disorder. Bipolar Disord. 2001;3:58–62. doi: 10.1034/j.1399-5618.2001.030202.x. [DOI] [PubMed] [Google Scholar]
- 8.Goodwin FK, Jamison KR. Manic-Depressive Illness. New York: Oxford University Press; 1990. [Google Scholar]
- 9.Ketter TA, Wang PW, Dieckmann NF, et al. Brain anatomic circuits and the pathophysiology of affective disorders. In: Soars JC, editor. Brain Imaging and Affective Disorders. New York: Marcel Dekker; 2002. pp. 79–118. [Google Scholar]
- 10.Strakowski SM, DelBello MP, Adler CM. The functional neuroanatomy of bipolar disorder: A review of neuroimaging findings. Mol Psychiatry. 2005;10:105–116. doi: 10.1038/sj.mp.4001585. [DOI] [PubMed] [Google Scholar]
- 11.Nauta WJH. The problem of the frontal lobe: A reinterpretation. J Psychiatr Res. 1971;8:167–187. doi: 10.1016/0022-3956(71)90017-3. [DOI] [PubMed] [Google Scholar]
- 12.Ongur D, Price JL. The organization of networks within the orbital and medial prefrontal cortex of rats, monkeys, and humans. Cereb Cortex. 2000;10:206–219. doi: 10.1093/cercor/10.3.206. [DOI] [PubMed] [Google Scholar]
- 13.Lichter DG, Cummings JL. Introduction and overview. In: Lichter DG, Cummings JL, editors. Frontal-Subcortical Circuits in Psychiatric and Neurological Disorders. New York: The Guilford Press; 2001. pp. 1–43. [Google Scholar]
- 14.Eslinger PJ, Damasio AR. Severe disturbance of higher cognition after bilateral frontal lobe ablation: Patient E.V.R. Neurology. 1985;35:228–230. doi: 10.1212/wnl.35.12.1731. [DOI] [PubMed] [Google Scholar]
- 15.Jansma JM, Ramsey NF, deZwart JA, van Gelderen P, Duyn JH. fMRI study of effort and information processing in a working memory task. Hum Brain Map. 2007;28:431–440. doi: 10.1002/hbm.20297. [DOI] [PMC free article] [PubMed] [Google Scholar]
- 16.Yamasaki H, LaBar KS, McCarthy G. Dissociable prefrontal brain systems for attention and emotion. Proc Natl Acad Sci USA. 2002;99:11447–11451. doi: 10.1073/pnas.182176499. [DOI] [PMC free article] [PubMed] [Google Scholar]
- 17.Braver TS, Cohen JD, Barch DM. The role of prefrontal cortex in normal and disordered cognitive control: A cognitive neuroscience perspective. In: Stuss DT, Knight RT, editors. Princoiples of Frontal Lobe function. Oxford: Oxford University Press; 2002. pp. 428–447. [Google Scholar]
- 18.Blumberg HP, Leung HC, Skudlarski P, Lacadie CM, Fredericks CA, Harris BC, et al. A functional magnetic resonance imaging study of bipolar disorder: State- and trait-relate dysfunction in ventral prefrontal cortices. Arch Gen Psychiatry. 2003;60:601–609. doi: 10.1001/archpsyc.60.6.601. [DOI] [PubMed] [Google Scholar]
- 19.Blumberg HP, Martin A, Kaufman J, Leung HC, Skudlarski P, Lacadie C, et al. Frontostriatal abnormalities in adolescents with bipolar disorder: Preliminary observations from functional MRI. Am J Psychiatry. 2003;160:1345–1347. doi: 10.1176/appi.ajp.160.7.1345. [DOI] [PubMed] [Google Scholar]
- 20.Blumberg HP, Stern E, Martinez D, Ricketts S, de Asis J, White T, et al. Increased anterior cingulate and caudate activity in bipolar mania. Biol Psychiatry. 2000;48:1045–1052. doi: 10.1016/s0006-3223(00)00962-8. [DOI] [PubMed] [Google Scholar]
- 21.Strakowski SM, Adler CM, Holland SK, Mills N, DelBello MP. A preliminary fMRI study of sustained attention in euthymic, unmedicated bipolar disorder. Neuropsychopharmacology. 2004;29:1734–1740. doi: 10.1038/sj.npp.1300492. [DOI] [PubMed] [Google Scholar]
- 22.Altshuler L, Bookheimer S, Proenza MA, Townsend J, Sabb F, Firestine A, et al. Increased amygdala activation during mania: A functional magnetic resonance imaging study. Am J Psychiatry. 2005;162:1211–1213. doi: 10.1176/appi.ajp.162.6.1211. [DOI] [PubMed] [Google Scholar]
- 23.Altshuler LL, Bookheimer SY, Townsend J, Proenza MA, Eisenberger N, Sabb F, et al. Blunted activation in orbitofrontal cortex during mania: A functional magnetic resonance imaging study. Biol Psychiatry. 2005;58:763–769. doi: 10.1016/j.biopsych.2005.09.012. [DOI] [PubMed] [Google Scholar]
- 24.Versace A, Thompson WK, Zhou D, Almeida JR, Hassel S, Klein CR, et al. Abnormal left and right amygdala-orbitofrontal cortical functional connectivity to emotional faces: State versus trait vulnerability markers of depression in bipolar disorder. Biol Psychiatry. 2010;67:422–431. doi: 10.1016/j.biopsych.2009.11.025. [DOI] [PMC free article] [PubMed] [Google Scholar]
- 25.Wang F, Kalmar JH, He Y, Jackowski M, Chepenik LG, Edmiston EE, et al. Functional and structural connectivity between the perigenual anterior cingulate and amygdala in bipolar disorder. Biol Psychiatry. 2009;66:516–521. doi: 10.1016/j.biopsych.2009.03.023. [DOI] [PMC free article] [PubMed] [Google Scholar]
- 26.Baddeley A. Working Memory. Science. 1992;255:556–559. doi: 10.1126/science.1736359. [DOI] [PubMed] [Google Scholar]
- 27.Norman DA, Shallice T. Attention to action: Willed and automatic control of behavior. In: Davidson RJ, Schwartz GE, Shapiro D, editors. Consciousness and Self-Regulation, volume 4. New York: Plenum Press; 1986. pp. 1–18. [Google Scholar]
- 28.Cornblatt BA, Risch NJ, Faris G, Friedman D, Erlenmeyer-Kimling L. The Continuous Performance Test, identical pairs version (CPT-IP): I. New findings about sustained attention in normal families. Psychiatry Res. 1988;26:223–238. doi: 10.1016/0165-1781(88)90076-5. [DOI] [PubMed] [Google Scholar]
- 29.Young RC, Biggs JT, Ziegler VE, Meyer DA. A rating scale for mania: reliability, validity, and sensitivity. Br J Psychiatry. 1978;133:429–435. doi: 10.1192/bjp.133.5.429. [DOI] [PubMed] [Google Scholar]
- 30.First MB, Spitzer RL, Gibbon M, Williams JBW. Structured Clinical Interview for DSM-IV Axis I Disorders - Patient Editions (SCID-I/P) New York: Biometrics Research Department, New York State Psychiatric Institute; 1995. [Google Scholar]
- 31.Strakowski SM, Williams JR, Fleck DE, DelBello MP. Eight-month functional outcome for mania following a first psychiatric hospitalization. J Psychiatr Res. 2000;34:193–200. doi: 10.1016/s0022-3956(00)00015-7. [DOI] [PubMed] [Google Scholar]
- 32.McClellan AT, Kushner H, Metzger D, Peters R, Smith I, Grissom G, et al. The fifth edition of the Addiction Severity Index. J Sub Abuse Treatment. 1992;9:199–213. doi: 10.1016/0740-5472(92)90062-s. [DOI] [PubMed] [Google Scholar]
- 33.Montgomery SA, Åsberg M. A new depression scale designed to be sensitive to change. Br J Psychiatry. 1979;134:382–389. doi: 10.1192/bjp.134.4.382. [DOI] [PubMed] [Google Scholar]
- 34.Cox RW, Jesmanowicz A. Real-time 3D image registration for functional MRI. Magn Reson Med. 1999;42:1014–1018. doi: 10.1002/(sici)1522-2594(199912)42:6<1014::aid-mrm4>3.0.co;2-f. [DOI] [PubMed] [Google Scholar]
- 35.Cox RW. AFNI: Software for analysis and visualization of functional magnetic resonance neuroimages. Comput Biomed Res. 1996;29:162–173. doi: 10.1006/cbmr.1996.0014. [DOI] [PubMed] [Google Scholar]
- 36.Tzourio-Mazoyer N, Landeau B, Papathanassiou D, Crivello F, Etard O, Delcroix N, et al. Automated anatomical labeling of activations in SPM using a macroscopic anatomical parcellation of the MNI MRI single-subject brain. Neuroimage. 2002;15:273–289. doi: 10.1006/nimg.2001.0978. [DOI] [PubMed] [Google Scholar]
- 37.Collins DL, Zijdenbos AP, Kollokian V, Sled JG, Kabani NJ, Holmes CJ, et al. Design and construction of a realistic digital brain phantom. IEEE Trans Med Imaging. 1998;17:463–468. doi: 10.1109/42.712135. [DOI] [PubMed] [Google Scholar]
- 38.Jha AP, McCarthy G. The influence of memory load upon delay-interval activity in a working-memory task: an event-related functional MRI study. J Cogn Neurosci. 2000;12:90–105. doi: 10.1162/089892900564091. [DOI] [PubMed] [Google Scholar]
- 39.Grier JB. Nonparametric indexes for sensitivity and bias. Psychol Bull. 1971;75:424–429. doi: 10.1037/h0031246. [DOI] [PubMed] [Google Scholar]
- 40.Mackworth NH. The breakdown of vigilance during prolonged visual search. Q J Exp Psychol A. 1948;1:6–21. [Google Scholar]
- 41.Parasuraman R. Sustained attention in detection and discrimination. In: Parasuraman R, Davies DR, editors. Varieties of Attention. Orlando, FL: Academic Press; 1984. pp. 243–271. [Google Scholar]
- 42.Nelson HE. The National Adult Reading Test (NART): Test manual. Berks, UK: Windsor; 1982. [Google Scholar]
- 43.Tomasi D, Ernst T, Caparelli EC, Chang L. Common deactivation patterns during working memory and visual attention tasks: An intra-subject fMRI study at 4 Tesla. Hum Brian Map. 2006;27:694–705. doi: 10.1002/hbm.20211. [DOI] [PMC free article] [PubMed] [Google Scholar]
- 44.Seidel WT, Joschko M. Assessment of attention in children. Clin Neuropsychol. 1991;5:53–66. [Google Scholar]
- 45.Shear PK, Jernigan TL, Butters N. Volumetric magnetic resonance imaging quantification of longitudinal brain changes in abstinent alcoholics. Alcohol Clin Exp Res. 1994;18:172–176. doi: 10.1111/j.1530-0277.1994.tb00899.x. [DOI] [PubMed] [Google Scholar]