Abstract
It has been hypothesized that the formation of G-quadruplex structures in the DNA of gene promoters may be functionally linked to transcription and consequently that small molecules that interact with such G-quadruplexes may modulate transcription. We previously reported that triarylpyridines are a class of small molecules that selectively interact with G-quadruplex DNA. Here we describe an unexpected property of one such ligand that was found to disrupt the structure of two different DNA G-quadruplex structures, each derived from sequence motifs in the promoter of the proto-oncogene c-kit. Furthermore, cell-based experiments in a cell line that expresses c-kit (HGC-27) showed that the same ligand increased the expression of c-kit. This contrasts with G-quadruplex-inducing ligands that have been previously found to inhibit gene expression. It would thus appear that the functional consequence of small molecule ligands interacting with G-quadruplex structures may depend on the specific mode of interaction. These observations provide further evidence to suggest that G-quadruplex forming sequence motifs play a role that relates to transcription.
Introduction
G-quadruplexes are stable nucleic acid secondary structures formed from guanine-rich sequences comprising a planar arrangement of four guanines, stabilized by Hoogsteen hydrogen bonding and monovalent cations.1 Sequences which can form G-quadruplexes are found throughout the genome2 in the telomeres at the ends of chromosomes3 and are also enriched in gene promoters,4 suggestive of functionality that may relate to gene transcription. Promoter G-quadruplexes have been studied for several proto-oncogenes including c-MYC,5 VEGF,6 bcl-2,7 KRAS,8 and c-kit.9 The general hypothesis relating G-quadruplex formation in gene promoters to transcription has stimulated research activity aimed at the chemical intervention of gene expression using small molecule ligands. Indeed, there are a growing number of examples of G-quadruplex interactive small molecules that modulate gene expression. For example, TmPyP410 and quindoline11 derivatives have been shown to inhibit gene expression in c-MYC, TmPyP412 has also been shown to inhibit KRAS gene expression, and isoalloxazines have been demonstrated to reduce c-kit expression.13 For each of the cited cases, it has been proposed that such compounds inhibit transcription via a mechanism involving the induction or stabilization of G-quadruplex structures with a consequential reduction in gene expression. Herein, we describe the case of a small molecule that disrupts the native structure of G-quadruplex DNA and enhances transcription of c-kit.
Results and Discussion
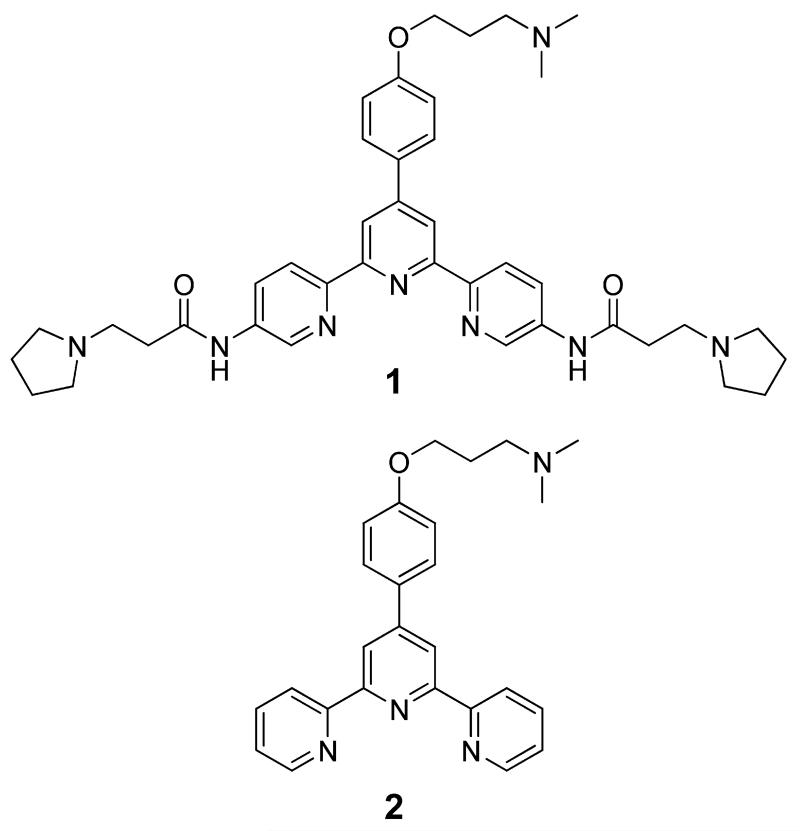
The triarylpyridine ligand family (TAPs, Figure 1) has been shown to have a general capacity to interact with G-quadruplex DNA sequences.14 To further explore the properties of TAPs and their interaction with G-quadruplex DNA, we utilized circular dichroism (CD) spectroscopy to study how such ligands may affect the fold of the DNA. We employed oligonucleotides based on two G-quadruplex forming DNA sequences found in the promoter of c-kit, a proto-oncogene that encodes a tyrosine kinase receptor for cytokine stem cell factor which controls cell growth and plays a role in control of differentiation.15 We previously reported that the c-kit promoter contains two quadruplex forming sequences we have called c-kit 19a and c-kit 29b each located within the minimal promoter (Figure 2).
Figure 1.
Structures of the TAPs used in this study.
Figure 2.
Sequences of the c-kit 1 and c-kit 2 G-quadruplex forming sequences and their location within the minimal c-kit promoter, shown with respect to the +1 transcriptional start site.
Circular Dichroism Spectroscopic Studies
We used CD spectroscopy to elucidate the effects of two high-affinity triarylpyridines on the folded conformations of c-kit 1 and c-kit 2 G-quadruplex DNA. We chose to explore TAPs 1 and 2 in detail as they both share a similar central core but possess some differences in chemical structure (1 has three side chains, whereas 2 only has one). Furthermore, both compounds showed contrasting biophysical properties with respect to their interaction with c-kit 2:14 1 displayed a moderate Kd of 11 μM but a high stabilization potential (ΔTm = 23 °C at 1 μM), whereas 2 showed a higher affinity (Kd = 0.4 μM) but much lower stabilization potential (ΔTm = 4 °C at 1 μM).
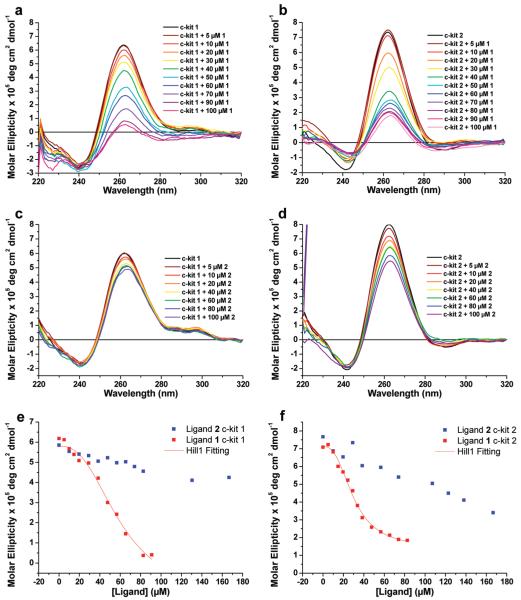
The CD spectra of c-kit 1 and c-kit 2 each suggest mainly parallel quadruplex populations as indicated by a strong positive band at 260 nm and a negative band at 240 nm.16 We titrated the respective ligand into a pre-annealed solution of G-quadruplex in buffer containing 100 mM KCl and 10 mM Tris·HCl at pH 7.4, mixed thoroughly, and acquired a CD spectrum immediately throughout the titration series (Figures 3a-3d). Upon titration of up to 10 μM 1 into a solution of c-kit 2, there was no significant change in the intensity of the CD signal (Figure 3b). However, upon addition of higher concentrations of 1, the CD signal intensity at 260 nm was found to decrease in a dose-dependent fashion until a point at ~100 μM beyond which no further reduction in the molar ellipticity was observed.17 The decrease in the CD signal suggested ligand-dependent disruption of the stacking between the bases of the G-quadruplex tetrads, consistent with an apparent unfolding effect.18 A similar effect was observed when 1 was titrated into c-kit 1 (Figure 3a). In contrast, ligand 2 showed relatively little change in the CD spectra of c-kit 1 or c-kit 2; rather, the c-kit G-quadruplex populations seemed relatively stable in the presence of up to 100 μM of ligand (Figure 3c,d).19 A plot of molar ellipticity against concentration of 1 gave a sigmoidal-shaped curve (red squares, Figure 3e,f), indicative of a co-operative effect,20 where the binding of 1 at one site increases the affinity for ligand binding at another site. Given that G-quadruplex DNA potentially has more than one binding site, we considered the possibility that 1, at higher concentrations, may bind at multiple sites and thus start to remodel the secondary structure. By fitting the sigmoidal-shaped curves to the Hill 1 equation using Origin 8.0 (see the Supporting Information), we obtained Hill coefficients (n) of 2.6 ± 0.7 and 2.6 ± 0.3 for 1 binding to c-kit 1 and c-kit 2, respectively. This reveals that the binding of 1 exhibits positive cooperativity (n > 1) for both c-kit 1 and c-kit 2. Additionally, the concentrations of 1 that are required to reach 50% reduction of the molar ellipticity, [D]50%, are estimated to be 60 ± 11 μM and 30 ± 1 μM for c-kit 1 and c-kit 2, respectively. From the [D]50% values, it is therefore possible to see the cooperative effect is more pronounced in c-kit 2. The data for 2 (blue squares, Figure 3e,f) did not show evidence of cooperativity; rather, the corresponding binding curves showed a linear response.
Figure 3.
CD spectra of titration experiments of 0–100 μM of ligand with 10 μM DNA: (a) 1 and c-kit 1; (b) 1 and c-kit 2; (c) 2 and c-kit 1; (d) 2 and c-kit 2; CD plots of molar ellipticity of c-kit 1 (e) and c-kit 2 (f) against the concentration of ligands 1 (red squares) and 2 (blue squares).
UV Absorption by the Ligand
We considered the possibility that 1 might first self-aggregate at high concentrations, which on binding could facilitate unfolding of the DNA secondary structure. Thus, we looked at the UV absorption of 1 in water at different concentrations up to 45 μM, for which the data obeyed the Beer–Lambert law and did not deviate, which ruled out the possibility of self-aggregation (see the Supporting Information). Higher concentrations were not possible as the absorption exceeded that detectable in the UV; however, much of the unfolding phenomenon observed in the CD experiments occurs below 45 μM, and thus, it can be deduced that ligand aggregation does not occur prior to binding to the DNA. Analogous experiments performed in the presence of 10 μM of c-kit 2 in buffer containing 100 mM KCl and 10 mM Tris·HCl at pH 7.4 also showed a linear correlation, indicating that ligand aggregation does not occur in the presence of DNA.
NMR Spectroscopic Study
The G-quadruplex unfolding by ligand 1 was more pronounced (from the [D]50% values) with c-kit 2 and was chosen for further study. To further elucidate the apparent ligand-induced unfolding of G-quadruplex structure we employed 1D 1H NMR spectroscopy.
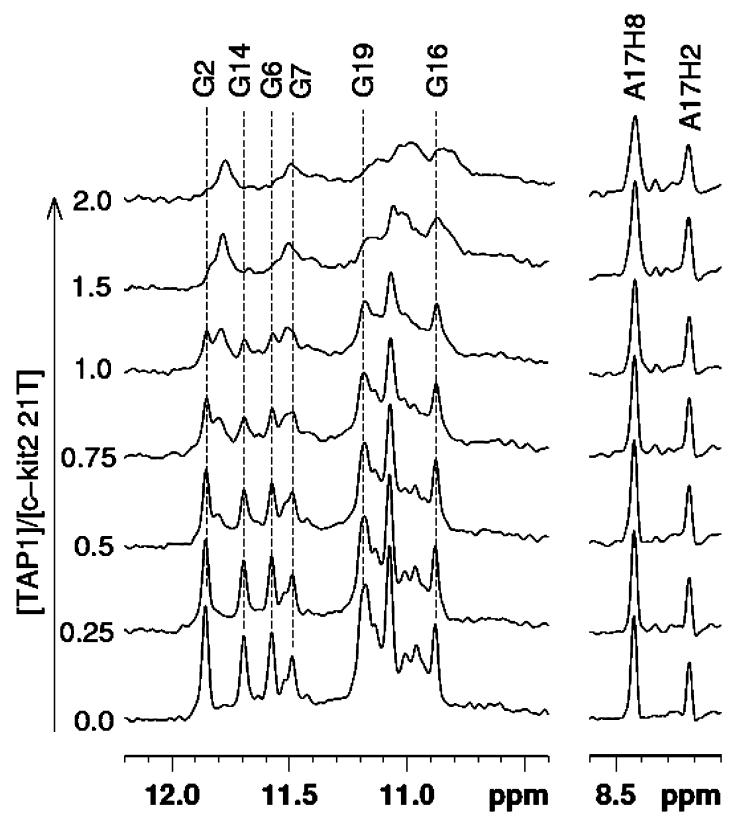
The imino protons from Hoogsteen hydrogen bonding between guanines in the tetrads in G-quadruplex give rise to signals visible between 10 and 12 ppm. We have previously shown that the wild-type c-kit 2 sequence exhibits structural polymorphism in solution by 1D 1H NMR spectroscopy9b and that a single nucleotide replacement, G to T (the 21T mutant), leads to the stabilization of a predominantly parallel conformation in the presence of potassium phosphate with well-resolved imino proton resonances (Figure 4, 21T trace).20 The NMR from the 21T mutant gives rise to a well-resolved 1H spectrum whereby individual imino-protons can be assigned (unpublished data), whereas the spectrum from the wild-type sequence shows broad, unresolved resonances caused by structural inhomogeneity.9b For this reason, we chose to continue our study with the 21T mutant. Similar to the wild type c-kit2, the 21T mutant also showed a dose-dependent reduction in the CD signal at 260 nm addition of ligand 1 (see the Supporting Information). For each concentration of ligand, we titrated 1 into folded c-kit 2 21T, mixed thoroughly, and acquired a 1D 1H NMR spectrum immediately throughout the titration series (Figure 4).21 The overall intensity of the imino proton resonance envelope (integrated over 10–12 ppm) decreases with increasing ligand concentration, and the remaining resonances are shifted upfield relative to the initial spectrum (in the absence of 1). The reduction of imino proton signals can be rationalized by the loss of hydrogen bonding, i.e., more pronounced solvent exchange, leading to increased conformational heterogeneity as manifested by the subtle but significant line broadening of the nonexchangeable aromatic protons of A17 H2 and H8 (Figure 4) as well as those of other residues that are not resolved in the 1D 1H spectrum (Supporting Information). This is substantiated by the reduction of the apparent transverse relaxation time (T2) of the observed imino proton resonances by about 57 ± 8% (from 37 ± 2 ms in the free form to 16 ± 1 ms in the presence of 1 equiv of ligand 1) that we have attributed to an overall increase in conformational heterogeneity, i.e., exchanging process (Supporting Information). We have also compared the apparent hydrodynamic radius of c-kit 2 21T in the presence and absence of ligand 1 by means of diffusion measurements using pulse field gradient NMR spectroscopy (Supporting Information). There is no indication of oligomerization of c-kit 2 21T upon binding to ligand 1, confirming that the reduced relaxation time is predominately caused by conformational heterogeneity. Taken together, we have concluded that ligand 1 binding disrupts the structural integrity of the G-tetrads leading to weakening of the hydrogen bonding thereof.
Figure 4.
Stacked NMR spectra of c-kit 2 21T (190 μM, 10 mM potassium phosphate buffer) and results from titration of 0–2 equiv (0–380 μM) of ligand 1. The assignments of individual imino proton resonances have been achieved by site-specific 15N enrichment, the details which will be published elsewhere.
Detailed analyses of peak intensities of all resolved G-tetrad imino proton resonances (normalized with respect to the nonexchangeable aromatic protons of A17, H2, and H8 as internal references, Figure 4) reveals a general trend of intensity drop similar to the overall integral upon addition of ligand 1 (Figure 5). Specifically, those of G2, G14, and G6, which form part of the top G-tetrad, are most susceptible to disruption by ligand 1.22 Intriguingly, one can also identify the emergence of a distinct population that gives rise to a resolved imino proton resonance between to the most downfield shifted imino protons of G2 and G14 along the titration series (Figure 4), indicating conformational rearrangements.
Figure 5.
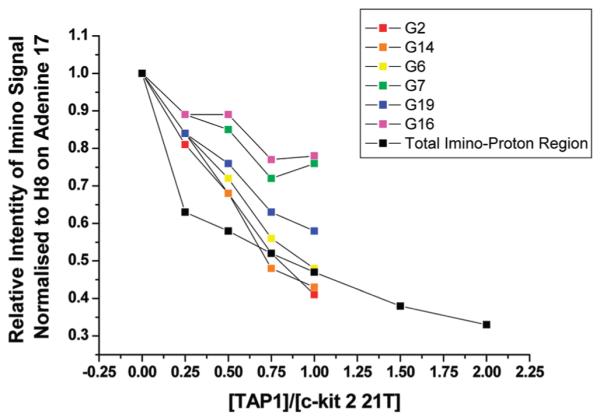
Plot of [1]/[c-kit2], the number of equivalents of 1 added, against the relative intensity of specific imino protons, normalized with respect to the H8 on adenine 17, of c-kit 2 on addition of multiple equivalents of 1.
Under the NMR conditions, evidence of structural alteration was observed at <1 equiv of ligand, compared to that in the CD experiments where the structural change occurred after addition of 1 equiv. However, the concentrations of both the DNA and ligand are 20 times higher than those for the CD experiments. Further additions of ligand result in a broadening in the imino-proton signals such that it was no longer possible to assign individual protons (Figure 4). Nevertheless, the loss of the imino-proton resonances is consistent with the CD experiments indicating an apparent disruption of the G-tetrads within the c-kit 2 quadruplex.
The capacity of 1 to cause conformational rearrangements as observed at high concentration in both the CD and NMR experiments complements our previous observations with surface plasmon resonance (SPR), where the use of concentrations higher than 25 μM was not possible due an apparent aggregation phenomenon on the streptavadin-coated sensor chip.14 Such experiments also rely on the assumption that the ligand binds the folded G-quadruplex form, but it is possible that the structure is remodeled in situ by the ligand interaction to an alternative secondary structure,23 which may not necessarily be a G-quadruplex. Likewise, FRET melting experiments can give rise to false positives if the ligand interacts with the fluorophores.24 A fluorescence titration of ligand 1 with the dual-labeled c-kit 2 oligonucleotide suggested the ligand interacts with the TAMRA fluorophore (see the Supporting Information). This could explain the observation of a high ΔTm (23 °C at 1 μM) but moderate Kd (11 μM) which suggests that any structural interpretation of the FRET-determined ΔTm should be made with due caution and reflects an inherent limitation with the technique. CD and NMR provide a more direct way to monitor ligand G-quadruplex interactions using signals which are specific to G-quadruplex secondary structure, and both techniques have indicated that there is significant disruption and weakening of the G-tetrads, the core feature of the G-quadruplex secondary structure, on addition of ligand 1. By analogy, we have noted with interest that there have been examples of small molecules that unfold protein secondary structure.25 In particular, the structures of some synthetic agents are based on an aromatic core attached to flexible side chains with the potential for free-rotation, somewhat comparable to the structure of 1 in the present study. Furthermore, it has been reported that while the porphyrin TMPyP4 stabilizes the human telomeric G-quadruplex forming sequence, it can disrupt the tetraplex structures in the fragile X syndrome sequence d(CGG)n26 and was recently found to increase the translation efficiency of the fragile X premutation mRNA by a mechanism suggested to involve unfolding of G-quadruplex RNA.27
Gene Expression Analysis
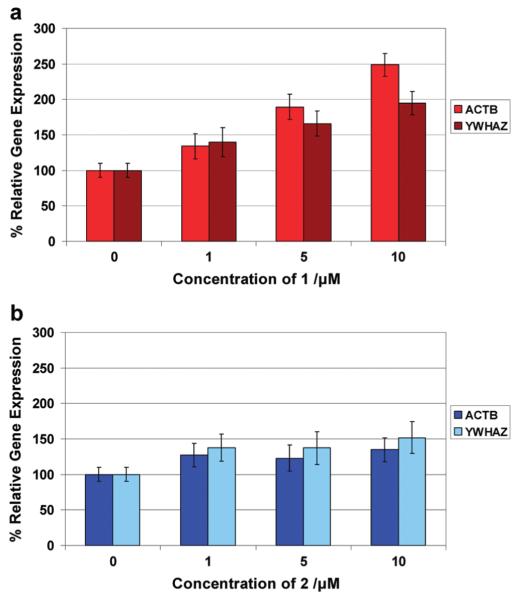
Given the apparent disruptive effect on the G-quadruplexes in c-kit, we were interested in exploring what effect such ligands would have on the expression of the c-kit gene, particularly in view of the fact that G-quadruplex stabilizing and inducing ligands have previously been shown to cause a decrease in gene expression.10-13 To evaluate the influence of G-quadruplex ligands 1 and 2 on c-kit gene expression, they were each incubated with HGC-27 cells, which overexpress c-kit, at varying concentrations for 3 h. The resultant changes in relative gene expression were measured using quantitative real-time (QRT) PCR compared to two independent control house-keeping genes, β-actin (ACTB) and tyrosine 3-monooxygenase/tryptophan 5-monooxygenase activation protein, ζ-polypeptide (YWHAZ), both of which were stably expressed during our experimental conditions. Expression data for c-kit relative to ACTB and YWHAZ is given in Figure 6. For ligand 1 we observed a general increase in c-kit gene expression (Figure 6a) relative to both control genes. A dose–response relationship can be seen on treatment with 1, resulting in a significant increase in gene expression by 40%, 90%, and 150% relative to ACTB for 1, 5, and 10 μM, respectively (p < 0.05, ANOVA). We were unable to measure the response at concentrations above 10 μM because the ligands were found to affect cell viability at higher concentrations.28 Treatment with 2 showed no significant changes in gene expression.
Figure 6.
Relative gene expression, where the response is normalized to the control 0 μM, of c-kit compared to two control genes ACTB and YWHAZ when incubated with 1 (a) and 2 (b) for 3 h. The error bars represent the standard error from triplicates of three separate experiments on three different days.
The expression data taken together with the biophysical data show a correlation between the G-quadruplex disrupting ability of 1 and the increase in gene expression in cells. In contrast, ligand 2, which did not show strong G-quadruplex unfolding, folding, or stabilization properties, correspondingly did not alter the expression of c-kit, thereby serving as a good biological control in this context. This contrasts with our previous observations for a different G-quadruplex-stabilizing ligand series, the isoalloxazines, that showed inhibition of gene expression.13 Thus, a ligand that can alter and disrupt G-quadruplex appears to exert the contrary effect on gene expression compared to a ligand which stabilizes the G-quadruplex.
Conclusions
We have studied an example of a small molecule that can remodel G-quadruplex DNA in a concentration-dependent manner and also increase the level of gene expression in cells. This is the first example of induction of gene expression by a G-quadruplex interacting ligand that we are aware of and it provides some fundamental insights into the potential complexity of ligand G-quadruplex interactions and how they might influence cellular function. The outcomes of the study also provide further chemical biology data to support a functional link between G-quadruplex DNA structures and gene transcription.
Experimental Section
Circular Dichroism (CD)
CD spectra were recorded on a Chirascan spectropolarimeter (Applied Photophysics Ltd., UK) using a 1 mm path length quartz cuvette. C-kit 1 ([GGGAGGGCGCTGGGAGGAGGG], 10μM)andc-kit2([GGGCGGGCGCGAGGGAGGGG], 10 μM) were dissolved in a buffer containing Tris·HCl (10 mM, pH 7.4) and KCl (100 mM) to achieve a total volume of 200 μL and were annealed by heating at 95 °C for 5 min and then cooling to room temperature at 0.1 °C per minute. The scans were performed at 20 °C over a wavelength range of 220–320 nm with a scanning speed of 100 nm/min, a response time of 0.5 s, 1 nm pitch, and 1 nm bandwidth. A blank sample containing only buffer was treated in the same manner and subtracted from the collected data. Aliquots of ligand (1 mM in water) were added in steps to achieve the desired equivalent proportions. The ligands alone did not show any significant bands in the CD. The CD spectra represent an average of three scans and were smoothed and zero corrected (at 320 nm). Final analysis and manipulation of the data was carried out using Origin 8.0 (OriginLab Corp., Northampton, MA).
NMR
1H NMR spectra of c-kit 2 were recorded at 298 K using a 700 MHz Bruker Avance spectrometer equipped with a cryogenic TCI probe, with the jump-and-return water suppression scheme to minimize saturation of labile proton signals.29 The titration experiments started with 190 μL of 190 μM c-kit 2 DNA G-quadruplex d[CGGGCGGGCGCGAGGGAGGGT] in 10 mM potassium phosphate buffer, pH 7.0. Aliquots of 1 (10 mM in water) were added in steps to yield 0–2 equiv portions and mixed thoroughly. NMR spectra were recorded immediately after individual titration steps.
Apparent imino proton transverse relaxation times (T2) were estimated using 1D jump-return Hahn echo spectra to obtain peak intensities as a function of echo delays ranging from 1.5 to 40 ms, which were then analyzed using eq 1 as described previously30
| (1) |
where τi and τj are the echo delays of experiments i and j and Ii and Ij are the resonance intensities of the nuclei of interest in experiments i and j.
In order to compare the hydrodynamic radius of c-kit2 21T in the presence of various amounts of 1 during the titration series, the relatively translational diffusion coefficients of c-kit2 21 T have been estimated using a series of one-dimensional pulse field gradient NMR experiments recorded on a Bruker Avance 700 MHz spectrometer using the pulse gradient-stimulated echo longitudinal encode–decode sequence as described previously with minor modifications.31
Cell-Based Studies. General Methods
HGC-27 (European Collection of Cell Cultures, Cat. No. 94042256) were cultured in EMEM, supplemented with 10% heat-inactivated FBS and 2 mM l-glutamine. Cells were cultured in T-75 flasks and were split at 70–80% confluency. The ligands were added after sterile filtration (0.2 μM) directly to the media from a 10 mM stock solution in RNase free water to make the final concentrations in media. DMSO (0.1%) was added to each ligand–media solution. Control experiments were conducted in the same manner, 0.1% added DMSO, but without ligand.
Cellular Uptake
HGC-27 cells were plated in eight wells over a microscope slide at 1000 cells/well and cultured overnight. Afterward, the compound was added (at concentrations of 0, 0.5, 1, 2, 3, 4, 5, and 10 μM) in a solution of fresh media supplemented with 0.1% DMSO and incubated with the cells for 3 h. At the end of this period, the media–ligand solutions were removed, and the cells were washed with PBS and observed under a fluorescent microscope (Olympus IX71 inverted microscope). At this time, cells were seen to have accumulated visible amounts of the compound within the cell body while no indications of changes in cellular morphology could be observed.
Cytotoxicity
Before cell studies were executed, a simple Trypan blue assay was performed to avoid concentrations at which the compounds killed cells. HGC-27 cells were plated in 24 well plates at 50,000 cells/well and cultured overnight. Afterward, the compounds were added in a solution of fresh media supplemented with 0.1% DMSO and the plates incubated with the ligand for up to 12 h. At the end of this period, the media–ligand solutions were removed and the cells washed with PBS. The pelleted cells from each well were resuspended in 20 μL of media and 20 μL of Trypan Blue (Sigma); after 5 min, the number of cells and the number of stained (dead) cells were counted using a hemocytometer. Any concentration which showed cell death above the basal level for nontreated cells was avoided.
Gene Expression Analysis
HGC-27 cells were plated in six well plates at 250,000 cells/well and cultured overnight. Afterward, the compound was added (at concentrations 0, 1, 5, and 10 μM) in a solution of fresh media supplemented with 0.1% DMSO and incubated with the ligand in triplicate wells for 3 h. After incubation, the cells were harvested, and the RNA was extracted using the Qiagen RNeasy Kit according to the manufacturer’s instructions. The quantity of the RNA was measured by UV spectrometry. Synthesis of cDNA was performed using 1 μg of total RNA and SuperScript III reverse transcriptase (Invitrogen), with 1 h elongation time at 55 °C and oligo dT primers. The cDNA was quantified on a Roche Light Cycler 480 real time PCR machine, using the SYBR Green I Master kit (Roche). The sequences of the primers used were CGTGGAAAAGAGAAAACAGTCA and CACCGTGATGCCAGCTATTA for c-kit. Housekeeping genes were measured using pre-validated primers for ACTB and YWHAZ provided by PrimerDesign Ltd., UK. The annealing temperature was 64 °C for all primers. The levels of relative gene expression were calculated according to Pfaffl et al.32 The presence of single amplicon in the RT-PCR reaction was confirmed by the presence of just one peak in a melting curve analysis carried out on the sample at the end of the amplification cycles. We carried out three independent experiments on three different days, and each of these was performed in triplicate.
Supplementary Material
Supporting Information Available: Hill fitting parameters, UV spectroscopic data, additional CD, NMR, and fluorescence data. This material is available free of charge via the Internet at http://pubs.acs.org.
Acknowledgment
We thank the BBSRC for project grant funding, Cancer Research UK for program funding, and the BBSRC for a studentship (Z.A.E.W). S.-T.D.H. is a recipient of a Human Frontier Long-Term Fellowship (LT0798/2005) and is supported in part by the Postdoctoral Research Abroad Program of the National Science Council of the Republic of China, Taiwan (NSC97-2917-1-564-102). We thank the staff and acknowledge the use of the Biomolecular NMR Facility, Department of Chemistry, University of Cambridge, as well as the EU NMR Large Scale Facility “Contract No. RII3-026145” in Utrecht, The Netherlands. We thank Keith McLuckie and Debbie Sanders for valuable advice and discussions.
References
- (1).Neidle S, Balasubramanian S, editors. Quadruplex Nucleic Acids. RSC Publishing; Cambridge: 2006. [Google Scholar]
- (2).(a) Todd AK, Haider SM, Parkinson GN, Neidle S. Nucleic Acids Res. 2007;35:5799. doi: 10.1093/nar/gkm609. [DOI] [PMC free article] [PubMed] [Google Scholar]; (b) Huppert JL, Balasubramanian S. Nucleic Acids Res. 2005;33:2908. doi: 10.1093/nar/gki609. [DOI] [PMC free article] [PubMed] [Google Scholar]
- (3).Sen D, Gilbert W. Nature. 1990;344:410. doi: 10.1038/344410a0. [DOI] [PubMed] [Google Scholar]
- (4).Huppert JL, Balasubramanian S. Nucleic Acids Res. 2007;35:406. doi: 10.1093/nar/gkl1057. [DOI] [PMC free article] [PubMed] [Google Scholar]
- (5).Siddiqui-Jain A, Grand CL, Bearss DJ, Hurley LH. Proc. Natl. Acad. Sci. U.S.A. 2002;99:11593. doi: 10.1073/pnas.182256799. [DOI] [PMC free article] [PubMed] [Google Scholar]
- (6).Sun D, Guo K, Rusche JJ, Hurley LH. Nucleic Acids Res. 2005;33:6070. doi: 10.1093/nar/gki917. [DOI] [PMC free article] [PubMed] [Google Scholar]
- (7).Dexheimer TS, Sun D, Hurley LH. J. Am. Chem. Soc. 2006;128:5404. doi: 10.1021/ja0563861. [DOI] [PMC free article] [PubMed] [Google Scholar]
- (8).Cogoi S, Xodo LE. Nucleic Acids Res. 2006;34:2536. doi: 10.1093/nar/gkl286. [DOI] [PMC free article] [PubMed] [Google Scholar]
- (9).(a) Rankin S, Reszka AP, Huppert J, Zloh M, Parkinson GN, Todd AK, Ladame S, Balasubramanian S, Neidle S. J. Am. Chem. Soc. 2005;127:10584. doi: 10.1021/ja050823u. [DOI] [PMC free article] [PubMed] [Google Scholar]; (b) Fernando H, Reszka AP, Huppert J, Ladame S, Rankin S, Venkitaraman AR, Neidle S, Balasubramanian S. Biochemistry. 2006;45:7854. doi: 10.1021/bi0601510. [DOI] [PMC free article] [PubMed] [Google Scholar]
- (10).Siddiqui-Jain A, Grand CL, Bearss D, Hurley LH. Proc. Natl. Acad. Sci. U.S.A. 2002;99:11593. doi: 10.1073/pnas.182256799. [DOI] [PMC free article] [PubMed] [Google Scholar]
- (11).Ou TM, Lu YJ, Huang ZS, Wang XD, Tan JH, Chen Y, Ma DL, Wong KY, Tang JC, Chan AS, Gu LQ. J. Med. Chem. 2007;50:1465. doi: 10.1021/jm0610088. [DOI] [PubMed] [Google Scholar]
- (12).Cogoi S, Xodo LE. Nucleic Acids Res. 2006;34:2536. doi: 10.1093/nar/gkl286. [DOI] [PMC free article] [PubMed] [Google Scholar]
- (13).Bejugam M, Sewitz S, Shirude PS, Rodriguez R, Shahid R, Balasubramanian S. J. Am. Chem. Soc. 2007;129:12926. doi: 10.1021/ja075881p. [DOI] [PMC free article] [PubMed] [Google Scholar]
- (14).Waller ZAE, Shirude PS, Rodriguez R, Balasubramanian S. Chem. Commun. 2008:1467. doi: 10.1039/b718854d. [DOI] [PMC free article] [PubMed] [Google Scholar]
- (15).Yarden Y, Kuang WJ, Yang-Feng T, Coussens L, Munemitsu S, Dull TJ, Chen E, Schlessinger J, Francke U, Ullrich A. EMBO J. 1987;6:3341. doi: 10.1002/j.1460-2075.1987.tb02655.x. [DOI] [PMC free article] [PubMed] [Google Scholar]
- (16).Balagurumoorthy P, Brahmachari SK, Mohanty D, Bansal M, Sasisekharan V. Nucleic Acids Res. 1992;20:4061. doi: 10.1093/nar/20.15.4061. [DOI] [PMC free article] [PubMed] [Google Scholar]
- (17).We considered that the ligand-induced reduction in CD signal at 260 nm could have been the result of a coincidental negative induced circular dichroism (ICD) signal, but no evidence to support this was found; scans at different wavelengths showed no additional peaks or troughs in the spectra contrary to our observations for a different ligand that did show an ICD upon complexation with the G-quadruplex; see: ; Dash J, Shirude PS, Hsu S-TD, Balasubramanian S. J. Am. Chem. Soc. 2008;130:47–15950. doi: 10.1021/ja8046552. [DOI] [PMC free article] [PubMed] [Google Scholar]
- (18).Fan J-H, Bochkareva E, Bochkarev A, Gray DM. Biochemistry. 2009;48:1099. doi: 10.1021/bi801538h. [DOI] [PubMed] [Google Scholar]
- (19).For example, on addition of 100 μM of 2 to c-kit 2 the molar ellipticity is ~5.5 × 10⁵ deg cm2 dmol−1, whereas the same decrease is obtained from addition of only 20 μM of ligand 1.
- (20).Van Holde KE, Johnson WC, Ho PS. Principles of Physical Biochemistry. Prentice-Hall Inc.; NJ: 1998. p. 613. [Google Scholar]
- (21).Hsu S-TD. Unpublished results. [Google Scholar]
- (22).Analogous CD titration of ligand 1 and c-kit 2 21T showed a similar reduction in CD signal at 260 nm (see the Supporting Information).
- (23).Halder K, Chowdhury S. Biochemistry. 2007;46:14762. doi: 10.1021/bi701590z. [DOI] [PubMed] [Google Scholar]
- (24).(a) Jain RK, Hamilton AD. Angew. Chem., Int. Ed. 2002;41:641–643. [Google Scholar]; Wilson AJ, Groves K, Jain RK, Park HS, Hamilton AD. J. Am. Chem. Soc. 2003;125:4420. doi: 10.1021/ja028574m. [DOI] [PubMed] [Google Scholar]; (b) Aya T, Hamilton AD. Bioorg. Med. Chem. Lett. 2003;13:2651. doi: 10.1016/s0960-894x(03)00551-1. [DOI] [PubMed] [Google Scholar]
- (25).De Cian A, Guittat L, Kaiser M, Saccá B, Amrane S, Bourdoncle A, Alberti P, Teulade-Fichou M-P, Lacroix L, Mergny J-L. Methods. 2007:183–195. doi: 10.1016/j.ymeth.2006.10.004. [DOI] [PubMed] [Google Scholar]
- (26).Weisman-Shomer P, Cohen E, Hershco I, Khateb S, Wolfovitz-Barchad O, Hurley LH, Fry M. Nucleic Acids Res. 2003;31:3963. doi: 10.1093/nar/gkg453. [DOI] [PMC free article] [PubMed] [Google Scholar]
- (27).Ofer N, Weisman-Shomer P, Shklover J, Fry M. Nucleic Acids Res. 2009;37:2712. doi: 10.1093/nar/gkp130. [DOI] [PMC free article] [PubMed] [Google Scholar]
- (28).Based on our observations using a fluorescence microscope, the TAPs were found to show favorable cellular uptake, and thus, the localized concentration of ligand is likely to be much higher in the cell compared to the media.
- (29).Patel DJ, Phan AT, Kuryavyi V. Nucleic Acids Res. 2007;35:7429. doi: 10.1093/nar/gkm711. [DOI] [PMC free article] [PubMed] [Google Scholar]
- (30).Hsu S-TD, Cabrita LD, Fucini P, Dobson CM, Christodoulou J. J. Mol. Biol. 2009;388:865. doi: 10.1016/j.jmb.2009.02.063. [DOI] [PubMed] [Google Scholar]
- (31).Hsu S-TD, Breukink E, Bierbaum G, Sahl H-G, de Kruijff B, Kaptein R, van Nuland NAJ, Bonvin AMJJ. J. Biol. Chem. 2003;278:13110. doi: 10.1074/jbc.M211144200. [DOI] [PubMed] [Google Scholar]
- (32).Pfaffl MW, Horgan GW, Dempfle L. Nucleic Acids Res. 2002;30:36. doi: 10.1093/nar/30.9.e36. [DOI] [PMC free article] [PubMed] [Google Scholar]
Associated Data
This section collects any data citations, data availability statements, or supplementary materials included in this article.
Supplementary Materials
Supporting Information Available: Hill fitting parameters, UV spectroscopic data, additional CD, NMR, and fluorescence data. This material is available free of charge via the Internet at http://pubs.acs.org.


