

Abstract
Caffeine (1, 3, 7-trimethylxanthine) is a widely used pharmacological agonist of the cardiac ryanodine receptor (RyR2) Ca2+ release channel. It is also a well-known stimulant that can produce adverse side effects, including arrhythmias. Here, the action of caffeine on single RyR2 channels in bilayers and Ca2+ sparks in permeabilized ventricular cardiomyocytes is defined. Single RyR2 caffeine activation depended on the free Ca2+ level on both sides of the channel. Cytosolic Ca2+ enhanced RyR2 caffeine affinity, whereas luminal Ca2+ essentially scaled maximal caffeine activation. Caffeine activated single RyR2 channels in diastolic quasi-cell-like solutions (cytosolic MgATP, pCa 7) with an EC50 of 9.0 ± 0.4 mM. Low-dose caffeine (0.15 mM) increased Ca2+ spark frequency ∼75% and single RyR2 opening frequency ∼150%. This implies that not all spontaneous RyR2 openings during diastole are associated with Ca2+ sparks. Assuming that only the longest openings evoke sparks, our data suggest that a spark may result only when a spontaneous single RyR2 opening lasts >6 ms.
Introduction
The methylxanthine caffeine is a nonselective adenosine receptor antagonist and phosphodiesterase inhibitor with actions in the nervous, respiratory, and cardiovascular systems. In the heart, caffeine promotes abnormal intracellular Ca2+ release, which can lead to arrhythmias (1–7). For years, it was thought that caffeine shifts the cytosolic Ca2+ sensitivity of the cardiac ryanodine receptor (RyR2) channel to a point where resting Ca2+ becomes sufficient to activate the channel (8). However, Kong et al. (9) recently suggested that this may not be the case, and proposed that caffeine's pro-arrhythmic action may be due to a caffeine-dependent shift in RyR2's luminal Ca2+ activation threshold.
At the cell/tissue level, low caffeine doses (<500 μM) have a complex transient action on Ca2+ release. Spark frequency initially increases and then falls as sarcoplasmic reticulum (SR) Ca2+ depletion ensues (10,11). As a result, it is difficult to study low-dose caffeine action in cells. The relatively subtle actions of low-dose caffeine have rarely been explored at the single RyR2 level, and almost never in solutions designed to mimic conditions in cells. Thus, our understanding of the RyR2 caffeine activation mechanism and caffeine's pro-arrhythmic action is at best incomplete.
Here, we define the caffeine RyR2 activation mechanism and explore the action of low-dose caffeine on single RyR2 function in quasi-cell-like solutions. We also measure the action of low-dose caffeine on Ca2+ sparks (within 3 s of its application) in permeabilized ventricular myocytes. The single-channel and spark results are correlated to generate insights into the origin of spontaneous Ca2+ sparks, SR Ca2+ leak, and caffeine's pro-arrhythmic action.
Materials and Methods
Ca2+ spark measurements
We enzymatically isolated cardiac ventricular myocytes from adult rabbits using methods described previously (10) and approved by the Institutional Animal Care and Use Committee. Spontaneous SR Ca2+ release events (sparks) were measured in saponin-permeabilized ventricular myocytes as described previously (12). After permeabilization was achieved, the cells were placed in a solution composed of (mM) K aspartate 100, KCl 15, KH2PO4 5, MgATP 5, EGTA 0.35, CaCl2 0.12, MgCl2 0.75, phosphocreatine 10, HEPES 10, Fluo-4 pentapotassium salt 0.03, creatine phosphokinase 5 U/ml, and dextran (MW: 40,000) 8%, pH 7.2. The free Ca2+ concentration of this solution was adjusted to 150 nM (calculated using WinMAXC 2.05, Stanford University, Palo Alto, CA). Thus, the spark frequency was relatively high and increased detection reliability in the brief spark-recording window used here (also see below). Experiments were done at room temperature. Cytosolic free Ca2+ was measured with a laser scanning confocal microscope (Radiance 2000 MP; Bio-Rad, Hercules, CA) and a 40× oil-immersion objective (N.A. = 1.3). Fluo-4 was excited by 488 nm light and its emitted fluorescence was measured at >515 nm.
Images were acquired in line scan mode (3 ms per line, pixel size 0.12 μm). Sparks were detected and analyzed using the SparkMaster program (13). The spark detection threshold was 3.8. The F0 was taken as the resting fluorescence in steady-state conditions (no sparks; control or when caffeine was present) and ΔF = F − F0. Spark frequency (sparks × (100 μm)−1 × s−1), amplitude (ΔF/F0), full duration at half-maximal amplitude (FDHM, microseconds), and full width at half-maximal amplitude (FWHM, micrometers) were measured.
Low doses of caffeine gradually deplete the SR Ca2+ load (10). Therefore, we measured Ca2+ spark properties in control conditions and immediately (within 1–3 s) after rapid caffeine applications when the SR Ca2+ load was comparable to that of the control. Note that the use of permeabilized cells ensures that there are no sarcolemma voltage oscillations or Ca2+ signaling contributions, the cytosolic caffeine and Ca2+ concentrations are known, and the caffeine-to-RyR2 diffusion time is optimized. We confirmed the SR Ca2+ load by measuring the peak amplitude of the cytosolic free Ca2+ transient induced by the rapid application of 20 mM caffeine (10). This concentration of caffeine activates RyR2s (15) and evokes complete release of the Ca2+ stored in the SR (10).
Single RyR2 channel measurements
Cardiac intracellular Ca2+ homeostasis regulation is species-specific (3), but single mammalian RyR2 function is not (16). Assuming that single RyR2 in bilayers is species-independent, we prepared heavy SR microsomes from rat ventricular muscle using the method described by Chamberlain et al. (17). Planar lipid bilayers were composed of a 5:4:1 mixture (50 mg/ml in decane) of bovine brain phosphatidylethanolamine, phosphatidylserine, and phosphatidylcholine. Bilayers were formed across a 100 μm diameter hole in a Teflon partition separating two compartments. One compartment (cis) was virtually grounded and filled with a HEPES-Tris solution (250 mM HEPES, 120 mM Tris, pH 7.4). The other compartment (trans) was filled with HEPES-Ca solution (250 mM HEPES, 50 mM Ca(OH)2, pH 7.4). Then, 500 mM CsCl, 2 mM CaCl, and 5–15 μg heavy SR microsomes were added to the cis chamber. Channel incorporation always resulted in the cytosolic side of the RyR2 channel facing the cis compartment (18–20). Thus, the cis and trans compartments will be referred to as cytososolic and luminal, respectively. Immediately upon observing single-channel activity, we replaced the cytosolic solution to establish the test conditions described in the figure legends. Ten minutes later, the luminal solution was changed (if required). Thus, all the channels were exposed to 53 mM luminal Ca2+ for at least 10 min, and thus no calsequestrin (CSQ) was associated with the RyR2 channels tested here (19). Recipes for the Ca2+ buffer solutions used were generated using WinMAXC 2.05 (Stanford University) and verified by Ca2+ electrode measurements. Caffeine was added to the cytosolic solution. Recordings were made at room temperature (20–22°C). Analysis was done using pCLAMP9 software (Molecular Devices, Sunnyvale, CA). Currents were sampled at 50 μs/pt and filtered at 1 kHz (four-pole Bessel, dead time ∼200 μs). Channel recordings were idealized using the half-amplitude threshold method ignoring current fluctuations <0.75 ms. No correction for missing events was made. Consequently, the opening frequency should be considered an underestimate.
We fit the sigmoidal dose response results (via nonlinear least-squares) using the Hill equation:
| (1) |
where [Ca] is the Ca2+ concentration, PoMAX is the maximum Po, KD is the dissociation constant, and N is the Hill coefficient (Hc). Our bell-shaped cytosolic Ca2+ dose-response data were fit with the following equation, which is a classic biphasic Hill equation for two independent sites (21):
| (2) |
Here, EC50 and IC50 are the cytosolic Ca2+ concentrations at which half-maximal activation and inhibition are observed. NA and NI are the apparent cooperativity coefficients for Ca2+ activation and inhibition, respectively.
Statistics and probability
Some results are presented as the mean ± SE of several individual measurements (or channels). Statistical comparisons (unpaired, p < 0.05) of means were performed with the use of Student's t-test. The binomial probability (P) that a set number of channels would be simultaneously open in an array of channels was calculated with the following equation:
| (3) |
where TNC is the total number of channels in the array, NSO is the number of those channels that are simultaneously open, and p is the single RyR2 resting Po.
Chemicals and drugs
Fluo-4 was purchased from Molecular Probes/Invitrogen (Carlsbad, CA). CaCl2 standard for calibration was purchased from World Precision Instruments (Sarasota, FL). Phospholipids were obtained from Avanti Polar Lipids (Alabaster, AL). Caffeine and all other chemicals were purchased from Sigma-Aldrich (St. Louis, MO) and were reagent grade. It was assumed that caffeine had equal access to its binding site(s) on single RyRs in bilayer and cells.
Results
Ca2+ spark studies
Spontaneous Ca2+ sparks in permeabilized cardiac ventricular myocytes were measured before and immediately after caffeine application (1–3 s). This brief post-caffeine recording period ensured that Ca2+ sparks in the presence of caffeine were recorded at essentially the same SR Ca2+ load as sparks in the control conditions (10,11). Also, only caffeine doses ≤ 300 μM were applied to cells. Fig. 1 A shows a representative line scan image illustrating the action of 100 μM caffeine. The top fluorescence (F/F0) profile (a) reflects a site where sparks occurred frequently. It is clear that caffeine transiently increased Ca2+ spark activity. Caffeine also caused a small, sustained elevation in resting fluorescence (see profile b). This elevation is a consequence of the caffeine-evoked increase in SR Ca2+ leak/sparks and varied with caffeine dose. It also limited our spark detection to low caffeine doses (≤300 μM) and suggests that some (albeit limited) SR Ca2+ was lost during our brief recording periods.
Figure 1.
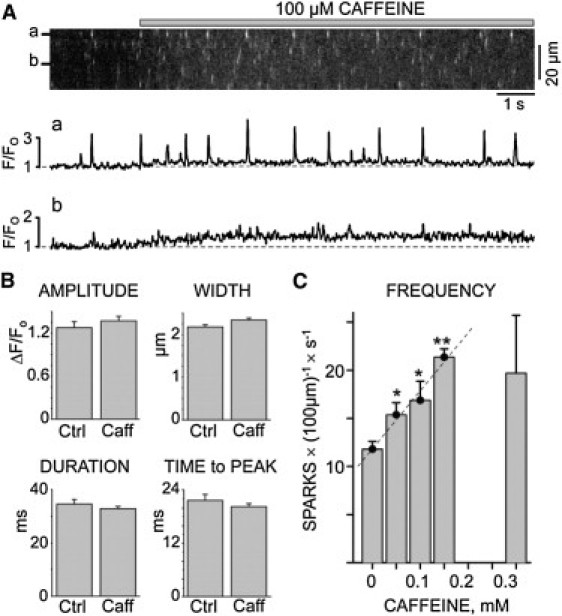
Caffeine action on SR Ca2+ sparks. Spontaneous sparks were recorded before and after rapid caffeine application. Resting cytosolic free Ca2+ was 150 nM. (A) Confocal line scan image (top) and two F/F0 profiles (a and b) are shown. The presence of 100 μM caffeine is indicated by a gray bar above the image. (B) Average spark amplitude, width (at half-maximal amplitude), duration (at half-maximal amplitude), and time-to-peak in the absence and immediately after (i.e., 1–3 s after) 100 μM caffeine exposure. No significant differences in these parameters were observed. (C) Spark frequency in the absence and immediately (1–3 s) after caffeine exposure. Spark frequency increased linearly (R2 = 0.98) as caffeine concentration increased from 0 and 150 μM; ∗p < 0.05 (t-test), ∗∗p < 0.002 (compared with the 0 mM caffeine value). At higher caffeine doses (300 μM), the spark frequency became more variable and on average decreased.
Fig. 1 B shows that the average spark amplitude, spatial width, duration, and time-to-peak were not significantly different before and immediately after a 100 μM caffeine application. The lack of a caffeine effect on the average spark amplitude and width most likely reflects the fact that these average spark distributions (particularly with caffeine present) include many small out-of-focus release events. When only the brightest sparks (presumably in-focus events) were analyzed, 100 μM caffeine application increased the amplitude and width of the sparks by 13.5 ± 4.2 and 16.8 ± 7.4%, respectively. The most obvious action of low caffeine doses was on spark frequency (Fig. 1 C). The resting control spark frequency was 11.8 ± 0.8 sparks × (100 μm)−1 × s−1. When 50, 100, or 150 μM caffeine was applied, the spark frequency increased significantly in a linear fashion (R2 = 0.98). With 300 μM caffeine, the variability in our spark frequency measurements increased to the point that the average frequency was no longer significantly different from control. We performed single-channel studies to gain insight into the mechanism underlying the increase in spark frequency by caffeine doses ≤ 150 μM.
Single RyR2 studies
Single RyR2 channel function was defined in planar lipid bilayer studies. Fig. 2 A (left) shows sample RyR2 channel recordings (0 mV) obtained at different cytosolic Ca2+ levels with no cytosolic MgATP present. The charge carrier was Ca2+ moving in the lumen-to-cytosol direction. Without caffeine present (control), there were infrequent brief openings at cytosolic pCa 7. The frequency of openings increased substantially at pCa 5.3 and 6. With 10 mM caffeine present, frequent long openings were observed at cytosolic pCa 6, 7, and 8. Caffeine did not alter the RyR2 unit Ca2+ current. Fig. 2 A (right) shows pooled results summarizing the RyR2 open probability (Po) values with (open circles) and without 10 mM caffeine present (solid squares). Caffeine significantly shifted the cytosolic Ca2+ EC50 from 2.0 ± 0.1 to 0.032 ± 0.005 μM (p < 0.0001, t-test).
Figure 2.
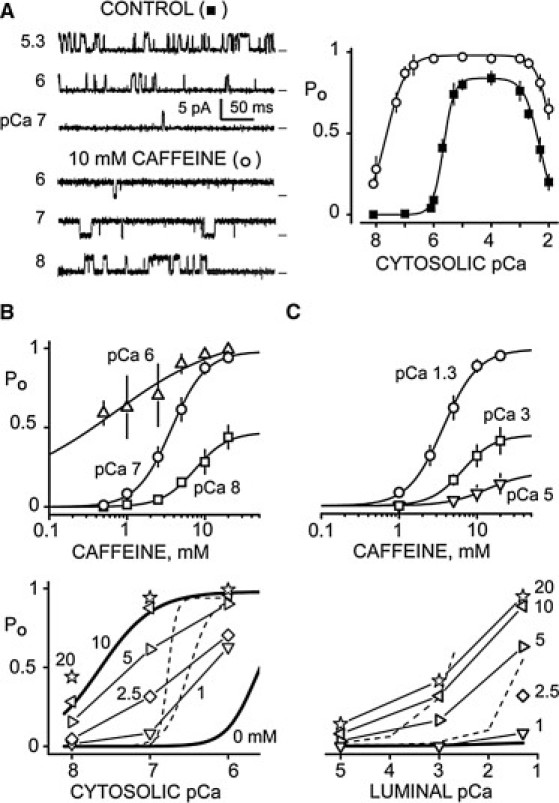
Caffeine action in simple solutions. (A) Single RyR2 channel recordings in the absence (top left) and presence (bottom left) of 10 mM cytosolic caffeine. Open events are upward deflections from marked zero current level. The cytosolic solution contained 120 mM Tris, 250 mM HEPES (pH 7.4), 1 mM EGTA, and the free Ca2+ levels indicated. The luminal solution contained 50 mM Ca2+, 250 mM HEPES (pH 7.4) and 0.6 mM dithiothreitol. Summary results are shown at right. Squares and circles represent results in obtained in the absence (n = 12) and presence (n = 8), respectively, of 10 mM caffeine. The lines are Hill fits. Without caffeine, the Ca2+ EC50 was 2.0 ± 0.1 μM with Hc = 2.3 ± 0.2 (PoMAX = 0.84), and the IC50 was 4.8 ± 1.2 mM (Hc = −1.6 ± 0.2). With caffeine, the Ca2+ EC50 and IC50 were 32 ± 5 nM (Hc 1.3 ± 0.3; PoMAX = 0.98) and 13 ± 2 mM (Hc = −1.6 ± 0.3), respectively. (B) Cytosolic Ca2+ sensitivity of caffeine action at a constant luminal Ca2+ level (pCa 1.3). RyR2 open probability (Po) was defined at three cytosolic Ca2+ levels (pCa 8, 7, and 6; top panel). Data points are the mean ± SE (n = 5–7). Curves are Hill fits with caffeine EC50 = 0.4 ± 1.4 (PoMAX = 0.99; Hc = 0.7), 3.8 ± 0.3 (PoMAX = 0.98; Hc = 2.0), and 7.9 ± 1.2 (PoMAX = 0.47; Hc = 1.6) for cytosolic pCa 6, 7, and 8, respectively. When tested in pairs, these EC50-values were significantly different (p < 0.05, t-test). The cytosolic Ca2+ sensitivity of RyR2 Po at different caffeine levels is shown in the bottom panel. The thick lines are the 0 and 10 mM curves from part A. The caffeine levels (in mM) are indicated by the numbers. Dashed lines represent the results of Kong et al. (9). (C) Luminal Ca2+ sensitivity of caffeine action with cytosolic Ca2+ constant (pCa 7). Caffeine sensitivity at three luminal Ca2+ levels (pCa 5, 3, and 1.3; top panel) is shown (n = 6). The luminal pCa 3 and 5 solutions contained 100 mM CsHEPES. Curves are Hill fits with caffeine EC50 = 9.2 ± 3.3 (PoMAX = 0.16; Hc = 1.7), 6.4 ± 1.3 (PoMAX = 0.43; Hc = 2.1), and 3.9 ± 0.3 (PoMAX = 0.98; Hc = 1.9) for luminal pCa 5, 3 and 1.3, respectively. When tested in pairs, these EC50-values were not significantly different (p ≥ 0.1). The luminal Ca2+ sensitivity of RyR2 Po at different caffeine concentrations is shown in the bottom panel. The thick flat line represents 0 mM caffeine data. The caffeine levels (in mM) are indicated by numbers, and the dashed lines reflect the results of Kong et al. (9).
The cytosolic and luminal Ca2+ sensitivity of caffeine action on RyR2 channels was also determined with no cytosolic MgATP present. Fig. 2 B (top) shows that the caffeine EC50 shifts as a function of cytosolic Ca2+ concentration (labels) at a constant luminal Ca2+ (pCa 1.3). The caffeine EC50-values at cytosolic pCa 6, 7, and 8 are significantly different (0.4 ± 1.4, 3.8 ± 0.3, and 7.9 ± 1.2 mM, respectively; p < 0.05). These results are replotted in Fig. 2 B (bottom) to illustrate caffeine's action on cytosolic Ca2+ sensitivity. The 0 and 10 mM caffeine curves (thick lines) are from Fig. 2 A. Different symbols correspond to different caffeine concentrations. Caffeine visibly shifts the cytosolic Ca2+ EC50 and cytosolic Ca2+ activation threshold (Ca2+ level when Po becomes >0.02). For example, 2.5 mM caffeine shifts the threshold to <10 nM from its near 1 μM value without caffeine present. For comparison (see Discussion), the thin dashed lines represent the results of Kong et al. (9). Fig. 2 C (top) shows the luminal Ca2+ sensitivity (labels) of RyR2 caffeine activation at a constant cytosolic Ca2+ (pCa 7). The caffeine EC50-values were 9.2 ± 3.3, 6.4 ± 1.3, and 3.9 ± 0.3 mM for luminal pCas of 5, 3, and 1.3, respectively. These results were also replotted to show caffeine's action on RyR2 luminal Ca2+ sensitivity (Fig. 2 C, bottom). Again, the thick line reflects our 0 mM caffeine results, open symbols are the various caffeine levels (marked), and dashed lines represent the results of Kong et al. (9).
Single RyR2 channel studies were also performed under conditions that better mimic those observed during diastole in cells. The diastolic quasi-cell-like cytosolic solution contained 120 mM TrisHepes (pH 7.4), 5 mM ATP (total), 1 mM Mg2+ (free), and 100 nM Ca2+ (free). The net current carried by Ca2+ was in the lumen-to-cytosol direction. Because control studies indicated that phosphocreatine, Fluo-4, creatine phosphokinase, and dextran (components in our spark solutions) do not alter single RyR2 function, these were not added to the quasi-cell-like solution. In cells, the high K+ permeability of SR effectively clamps the SR near 0 mV (22). Here, Tris+ was substituted for K+ so that channel activity could be measured at 0 mV (23). Lastly, the small differences in pH, free Ca2+, and free Mg2+ were considered to be within tolerable levels. Fig. 3 A (left) summarizes the cytosolic RyR2 Ca2+ sensitivities under these conditions. In the absence of caffeine (solid squares), the RyR2 Ca2+ EC50 was 11.1 ± 0.7 μM. Caffeine significantly (p < 0.005) shifted the Ca2+ EC50 to 0.581 ± 0.049 (5 mM caffeine; triangles) or 0.197 ± 0.024 μM (10 mM; open squares). Dashed lines are the no-cytosolic-MgATP curves from Fig. 2 A. Fig. 3 A (right) shows the RyR2 caffeine sensitivity (EC50 9.0 ± 0.4 μM) in the quasi-cell-like cytosolic solution. The dashed line is the corresponding no-cytosolic-MgATP curve from Fig. 2 B.
Figure 3.
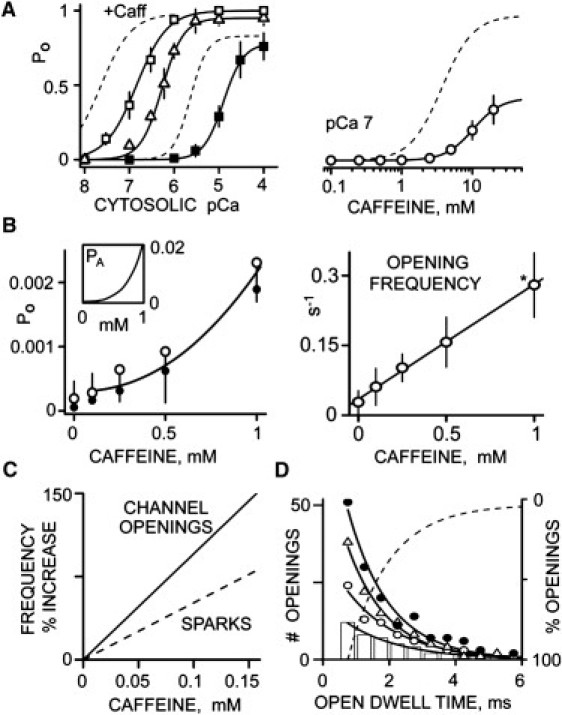
Caffeine action in quasi-cell-like solutions. The cytosolic solution contained 5 mM total ATP, 1 mM free Mg2+, TrisHEPES (120 mM/250 mM, pH 7.4), and 1 mM EGTA. The luminal solution contained CaHEPES (50 mM/250 mM, pH 7.4) and 0.6 mM dithiothreitol. All recordings were done at 0 mV. (A) Caffeine shifts RyR2 cytosolic Ca2+ sensitivity. In the left panel, solid squares (n = 8) indicate when no caffeine (control) was present. Triangles and open squares (n = 6) indicate addition of 5 and 10 mM cytosolic caffeine. Solid curves are Hill fits with Ca2+ EC50 = 11.1 ± 0.7 μM and Hc = 2.0 ± 0.4 (PoMAX = 0.78), 581 ± 49 nM (PoMAX = 1; Hc = 1.8 ± 0.3), and 197 ± 24 nM (PoMAX = 1; Hc = 1.3 ± 0.1) for control, and 5 mM and 10 mM caffeine, respectively. Dashed lines (left panel) are the control and caffeine curves redrawn here from Fig. 2A (i.e., simple solution results). The caffeine dose response at cytosolic pCa 7 is shown in the right panel (n = 6). The solid curve is a Hill fit with EC50 = 9.0 ± 0.4 mM (PoMAX = 0.42; Hc = 2.2 ± 0.1). The dashed curve is from Fig. 2B (i.e., a simple solution result). (B) Action of low caffeine doses (<1 mM) on single RyR2 function. Open probability (left, open circles) and open event frequency (right) are plotted as a function of cytosolic caffeine concentrations. The Po line is the fit from part A (right). The solid circles are Po estimates obtained by multiplying the mean open time and open event frequency. The line in the frequency plot is a linear regression (R2 = 0.99). Asterisk indicates p < 0.05 (t-test) compared with 0 caffeine value. The inset (left panel) shows that the binomial probability that >2 in an array of 100 RyR2 channels will be simultaneously open (PA) is a nonlinear function of caffeine concentration. (C) Comparison of the caffeine sensitivity of single RyR2 opening and Ca2+ spark frequency. Frequency results from Figs. 1C and 3B are plotted as % increase compared with that in 0 mM caffeine. The spark frequency was lower than the single-channel opening by 53.7%. (D) Low caffeine dose sensitivity of RyR2 open dwell times with 0 (bars), 0.1 (open circles), 0.25 (triangles), and 0.5 mM (solid circles) cytosolic caffeine present. Open events were collected from four different channels at each caffeine level over an 18 min period. Points are mean values and curves are single exponential fits. The open time constants are 1.7 ± 0.4, 1.6 ± 0.2, 1.4 ± 0.4, and 1.4 ± 0.3 ms for control, and with 0.1, 0.25, and 0.5 mM caffeine, respectively. These values are not significantly different. To calculate the percentage of openings, the four exponential fits were normalized, inverted, and then averaged; the dashed curve shows how the percentage varies with cytosolic caffeine concentration.
Fig. 3 B summarizes low-dose caffeine (<1 mM) results collected from unusually long recordings (≥18 min) made in our quasi-cell-like solutions. Such long recordings were required because open events were relatively infrequent. Fig. 3 B (left) shows single RyR2 Po plotted as a function of caffeine concentration; the open circles (and curve) are from Fig. 3 A (right). Solid circles are estimated Po values that were determined by multiplying the mean open time and open event frequency. The Po (open circles) in 0 mM caffeine was 0.00016 ± 0.00027. These Po results and Eq. 3 were used to predict how low-dose caffeine changes the probability (PA) that >2 RyR2s will be simultaneously open in an array of 100 channels. The inset in Fig. 3 B shows that PA is a superlinear function of caffeine concentration. Fig. 3 B (right) shows single RyR2 open event frequency plotted as a function of caffeine concentration. The open event frequency in 0 mM caffeine was 0.028 ± 0.025 s−1.
Low-dose caffeine actions on single RyR2 opening and Ca2+ spark frequency (% increase) are compared in Fig. 3 C. The lines are the fits from Figs. 3 B (openings) and 1 C (sparks). Caffeine-evoked changes in spark frequency were consistently lower than caffeine-evoked changes in RyR2 opening frequency. The caffeine sensitivity of the RyR2 open dwell time is shown in Fig. 3 D. Open dwell time plots are shown with 0 (bars), 0.1 (open circles), 0.25 (triangles), and 0.5 mM (solid circles) caffeine present. Each plot was well fit (R2 > 0.95) by a single exponential curve with time constants of 1.7 ± 0.4, 1.6 ± 0.2, 1.4 ± 0.4, and 1.4 ± 0.3 ms, respectively. These time constants were not significantly different (p > 0.1). The fit curves were then normalized (to unity), averaged, and inverted to illustrate the probability of different length openings (dashed line). Note that 50% and ∼95% of the measured RyR2 openings lasted <1.6 ms and <6 ms, respectively.
Discussion
A cup of coffee can contain 100 mg of caffeine, and this may elevate plasma caffeine levels to ∼20 μM (24). Although this is often sufficient to generate caffeine's well known mild neurological stimulatory action, higher plasma levels (>75 μM) are usually required to evoke adverse side effects, which can become fatal at levels > 400 μM (1,2). One such side effect is arrhythmia (5–7,9). Until recently, it was commonly believed that caffeine's pro-arrhythmic action was due to caffeine shifting RyR2's cytosolic Ca2+ sensitivity to a point where the resting diastolic Ca2+ is sufficient to activate the channel (8). Recently, however, Kong et al. (9) challenged this view and showed that caffeine shifts the threshold for RyR2 luminal, not cytosolic, Ca2+ activation. They proposed that the luminal caffeine action might explain caffeine's pro-arrhythmic action.
Our data indicate that caffeine-RyR2 activation is modulated by both cytosolic and luminal Ca2+. Our single RyR2 channels were not associated with CSQ (see Materials and Methods) and their caffeine sensitivity was not very voltage-dependent. This suggests that the luminal sensitivity of caffeine-RyR2 activation does not depend on CSQ (19,25) or luminal Ca2+ feeding through the open channel and acting at cytosolic Ca2+ sites. We found that high doses of caffeine (≥2.5 mM) did make RyR2 more sensitive to luminal Ca2+, as reported by Kong et al. (9). In addition, higher luminal Ca2+ levels made channels more caffeine-sensitive, which is consistent with the findings of Gaburjakova and Gaburjakova (26). Thus, our results indicate that the RyR2 caffeine activation mechanism does indeed have a luminal component. However, this component is likely not the sole explanation for caffeine's pro-arrhythmic action. Caffeine levels < 1 mM are associated with caffeine's pro-arrhythmic action (6,10,11), and our results indicate that 1 mM caffeine clearly shifts RyR2 cytosolic Ca2+ sensitivity (Fig. 2 B) but has relatively little effect on its luminal Ca2+ sensitivity (Fig. 2 C).
Kong et al. (9) reported that 2 mM caffeine had little effect on the cytosolic Ca2+ threshold. Here, we show that 2.5 mM caffeine dramatically shifts the RyR2 cytosolic Ca2+ threshold (488 to <10 nM), which is quite consistent with previous works (8,15,28,29). This disparity is most likely explained by methodological differences. For example, we examined native channels isolated from hearts, whereas Kong et al. (9) examined detergent-purified recombinant channels. We employed a wide range of caffeine concentrations and quasi-cell-like solutions, whereas Kong et al. (9) did not. We show (under our quasi-cell-like conditions) that 0.25 mM caffeine elevated RyR2 Po from 0.00016 to 0.00064, and increased the RyR2 opening frequency from 0.028 to 0.102 s−1. We also show that low doses of caffeine (<0.5 mM) did not alter the distribution of RyR2 open dwell times, which is consistent with the early work of Sitsapesan and Williams (28). Finally, we demonstrate that high caffeine doses (>2 mM) substantially extend RyR2 open dwell times (see Fig. 2 A), consistent with early studies from Dr. Meissner's group (15,29). Our results strongly suggest that low-dose caffeine's pro-arrhythmic action is largely attributable to its action on the RyR2 cytosolic Ca2+ sensitivity and an increase in RyR2 opening frequency (not open time).
It is generally thought that spontaneous diastolic Ca2+ sparks are evoked by stochastic single RyR2 openings. Spontaneous sparks can lead to propagating Ca2+ waves and sufficient Ca2+ extrusion (via electrogenic Na-Ca exchange) to depolarize cells, which may in turn generate arrhythmias (30–32). Here, we examined the spark initiation process to better understand how low-dose caffeine might promote arrhythmias. Sparks were measured only within 1–3 s of caffeine application to minimize complications associated with SR Ca2+ store depletion (10,11). When all sparks are averaged, we show that 0.1 mM caffeine does not substantially alter the spark amplitude, width, duration, or time-to-peak. However, it does significantly increase the average spark frequency. The Hc of the spark frequency increase with low-dose caffeine was ∼1.5. The Hc of single RyR2 opening frequency with low-dose caffeine was 1.1 (not significantly different). This may suggest that individual RyR2 openings evoke sparks.
Intuitively, not all single RyR2 openings are likely to evoke sparks and there is clearly uncertainty about the fraction of openings that do (33–35). Our single-channel results indicate that the resting diastolic RyR2 opening frequency is likely near 0.028 s−1. If it is assumed that a ventricular myocyte contains roughly 1.5 × 10⁶ RyR2 channels (3,36), and every diastolic RyR2 opening triggers a spark, the frequency of sparks in a myocyte should be 42,000 s−1, rather than the typically observed 50–100 s−1 (3,37–40). A very rough interpretation of this is that <1% of diastolic RyR2 openings actually trigger sparks (100/42,000 = 0.0024 or 0.2%). We also show that the spark frequency and single RyR2 opening frequency (% increase) increase linearly with low doses of caffeine, but with different slopes. For example, 0.15 mM caffeine increased the single RyR2 opening frequency by 144% and spark frequency by just 81% (see Fig. 3 C). This difference implies that not every RyR2 opening triggers a spark. Sparks occur at release sites with ∼100 RyR2s (3,36,41), so 0.15 mM caffeine would increase the number of openings at a release site by 14,400%. This also implies that few single RyR2 openings actually trigger sparks (81/14,400 = 0.0056 or ∼0.6%). Overall, this implies that diastolic RyR2-mediated SR Ca2+ leak exists in two forms: spark and nonspark.
To very roughly gauge the extent of nonspark leak, we assume that an average nonspark-related opening lasts ∼1.5 ms. We also assume that 10 channels are releasing Ca2+ for ∼30 ms during a spark. This 30 ms refers to (and clearly overestimates) the spark release flux duration. For comparison, in a recent study, Santiago et al. (33) estimated that the spark release flux lasts 24.4 ms. Applying the assumptions above, we can conclude that the leak carried by one spark is 200 times greater than that carried by one nonspark RyR2 opening. If 0.2% of openings evoke sparks (see prediction above), there will be 500 nonspark openings for every spark. The proportion of spark to nonspark Ca2+ leak would then be 0.4 (i.e., 200/500). In other words, only 40% of diastolic leak is due to sparks.
It is important to note that we made this 40% spark leak prediction using a series of assumptions, and there are some important interpretive caveats to be considered. For example, our measurements do not include single-channel openings lasting < 0.75 ms (our detection limit). The RyRs in bilayers and in cells were not operating in identical regulatory environments (despite our best efforts). Single RyR2s in bilayers were not associated with CSQ, which may help stabilize Ca2+ release cardiac myocytes (42,43) and perhaps reduce RyR2 opening rate by ∼4-fold (44). The effective number of RyR2s in the cell could also be less. If the number of RyRs per cell was 6 × 10⁵ (see 45) and the RyR2 opening frequency was 0.007 s−1 (4-fold less than 0.028 s−1), there would be 4200 s−1 (not 42,000 s−1) openings per cell, suggesting that 2.4% of openings trigger sparks (instead of the 0.2% estimate above). Further, the gating of neighboring RyR2s in cells may be physically coupled (46), which would nullify our independent gating assumption. The point here is that our 40% spark leak prediction is highly assumption-dependent and additional studies are required to better define the magnitude and physiological significance (if any) of nonspark leak. It is interesting, however, that our prediction is consistent with two recent estimations of nonspark leak (33,34).
If few RyR2 openings trigger a spark, then some relatively rare situation must arise for an opening to do so. One possibility is that two or more neighboring RyR2 channels must open simultaneously to trigger a spark. If a resting permeabilized cell has ∼104 release sites (36) and a spark frequency of 1180 sparks × cell−1 × s−1 (as measured here), the probability of a spark at any one release site would be ∼0.12. If it is assumed that a simple binomial probability describes RyR2 opening (i.e., channels gate independently), the probability that two or more RyR2s will be simultaneously open at a release site having 100 channels can be calculated using Eq. 3. To achieve a spark probability of 0.12, the resting RyR2 Po would have to be 0.006, which is ∼37 times greater than our measured RyR2 Po value (0.00016). Results from a recent microscopy study suggested that local release sites might effectively contain ∼14 instead of 100 RyRs (47). To generate a spark probability of 0.12 from this type of release site, the resting RyR2 Po would have to be 270 times our measured Po value. Thus, a simultaneous opening of two or more independently gating RyR2s is probably not the event that evokes a spark.
Another possible explanation for the fact that so few RyR2 openings trigger sparks could be that most openings are just too brief. Our open dwell time analysis suggests that >95% of single RyR2 openings last <6 ms. Thus, it may be that only those few unusually long RyR2 openings trigger sparks (i.e., evoke local inter-RyR2 Ca2+-induced Ca2+ release). In cells, the unit RyR2 Ca2+ flux is thought to be ∼0.5 pA (48,49). This implies that spark initiation may require a local 0.5 pA flux lasting >6 ms. This can be compared with the results of Wang et al. (50), who reported that 63% of sparklets (drug-modified L-type channel openings; 0.3 pA, 16 ms) in intact cells evoked sparks. Note that both ryanodol and Imperatoxin can intermittently lock single RyR2 channels into a very long-lived open state, and both of these agents evoke repeated sparks at individual release sites (51,52). This is consistent with the concept that the duration of local RyR2 openings helps define the spark probability at a release site.
Acknowledgments
We thank Demetrio Santiago for critical comments that helped improve the manuscript.
This work was supported by National Institutes of Health grants HL57832 and AR54098 (to M.F.), HL71741 (to J.R.F.), HL80101 and HL62231 (to L.A.B.), and GM078665 (to J.A.C.).
References
- 1.Kerrigan S., Lindsey T. Fatal caffeine overdose: two case reports. Forensic Sci. Int. 2005;153:67–69. doi: 10.1016/j.forsciint.2005.04.016. [DOI] [PubMed] [Google Scholar]
- 2.Moffatt A., Osselton M., Galichet L. Pharmaceuticals, Body Fluids and Postmortem Material. 3rd ed. Pharmaceutical Press; London: 2004. Clarke's analysis of drugs and poisons; pp. 736–738. [Google Scholar]
- 3.Bers D. Kluwer Academic Press; Dordrecht, The Netherlands: 2001. Excitation-Contraction Coupling and Cardiac Contractile Force. [Google Scholar]
- 4.Frishman W.H., Del Vecchio A., Ismail A. Cardiovascular manifestations of substance abuse: part 2: alcohol, amphetamines, heroin, cannabis, and caffeine. Heart Dis. 2003;5:253–271. doi: 10.1097/01.hdx.0000080713.09303.a6. [DOI] [PubMed] [Google Scholar]
- 5.Nam G.B., Burashnikov A., Antzelevitch C. Cellular mechanisms underlying the development of catecholaminergic ventricular tachycardia. Circulation. 2005;111:2727–2733. doi: 10.1161/CIRCULATIONAHA.104.479295. [DOI] [PMC free article] [PubMed] [Google Scholar]
- 6.Venetucci L.A., Trafford A.W., Eisner D.A. Increasing ryanodine receptor open probability alone does not produce arrhythmogenic calcium waves: threshold sarcoplasmic reticulum calcium content is required. Circ. Res. 2007;100:105–111. doi: 10.1161/01.RES.0000252828.17939.00. [DOI] [PubMed] [Google Scholar]
- 7.Venetucci L.A., Trafford A.W., Eisner D.A. The sarcoplasmic reticulum and arrhythmogenic calcium release. Cardiovasc. Res. 2008;77:285–292. doi: 10.1093/cvr/cvm009. [DOI] [PubMed] [Google Scholar]
- 8.O'Neill S.C., Eisner D.A. A mechanism for the effects of caffeine on Ca2+ release during diastole and systole in isolated rat ventricular myocytes. J. Physiol. 1990;430:519–536. doi: 10.1113/jphysiol.1990.sp018305. [DOI] [PMC free article] [PubMed] [Google Scholar]
- 9.Kong H., Jones P.P., Chen S.R. Caffeine induces Ca2+ release by reducing the threshold for luminal Ca2+ activation of the ryanodine receptor. Biochem. J. 2008;414:441–452. doi: 10.1042/BJ20080489. [DOI] [PMC free article] [PubMed] [Google Scholar]
- 10.Domeier T.L., Blatter L.A., Zima A.V. Alteration of sarcoplasmic reticulum Ca2+ release termination by ryanodine receptor sensitization and in heart failure. J. Physiol. 2009;587:5197–5209. doi: 10.1113/jphysiol.2009.177576. [DOI] [PMC free article] [PubMed] [Google Scholar]
- 11.Lukyanenko V., Viatchenko-Karpinski S., Györke S. Dynamic regulation of sarcoplasmic reticulum Ca(2+) content and release by luminal Ca(2+)-sensitive leak in rat ventricular myocytes. Biophys. J. 2001;81:785–798. doi: 10.1016/S0006-3495(01)75741-4. [DOI] [PMC free article] [PubMed] [Google Scholar]
- 12.Zima A.V., Picht E., Blatter L.A. Termination of cardiac Ca2+ sparks: role of intra-SR [Ca2+], release flux, and intra-SR Ca2+ diffusion. Circ. Res. 2008;103:e105–e115. doi: 10.1161/CIRCRESAHA.107.183236. [DOI] [PMC free article] [PubMed] [Google Scholar]
- 13.Picht E., Zima A.V., Bers D.M. SparkMaster: automated calcium spark analysis with ImageJ. Am. J. Physiol. Cell Physiol. 2007;293:C1073–C1081. doi: 10.1152/ajpcell.00586.2006. [DOI] [PubMed] [Google Scholar]
- 14.Reference deleted in proof.
- 15.Rousseau E., Meissner G. Single cardiac sarcoplasmic reticulum Ca2+-release channel: activation by caffeine. Am. J. Physiol. 1989;256:H328–H333. doi: 10.1152/ajpheart.1989.256.2.H328. [DOI] [PubMed] [Google Scholar]
- 16.Fill M., Copello J.A. Ryanodine receptor calcium release channels. Physiol. Rev. 2002;82:893–922. doi: 10.1152/physrev.00013.2002. [DOI] [PubMed] [Google Scholar]
- 17.Chamberlain B.K., Volpe P., Fleischer S. Calcium-induced calcium release from purified cardiac sarcoplasmic reticulum vesicles. General characteristics. J. Biol. Chem. 1984;259:7540–7546. [PubMed] [Google Scholar]
- 18.Tu Q., Velez P., Fill M. Surface charge potentiates conduction through the cardiac ryanodine receptor channel. J. Gen. Physiol. 1994;103:853–867. doi: 10.1085/jgp.103.5.853. [DOI] [PMC free article] [PubMed] [Google Scholar]
- 19.Qin J., Valle G., Fill M. Luminal Ca2+ regulation of single cardiac ryanodine receptors: insights provided by calsequestrin and its mutants. J. Gen. Physiol. 2008;131:325–334. doi: 10.1085/jgp.200709907. [DOI] [PMC free article] [PubMed] [Google Scholar]
- 20.Zima A.V., Qin J., Blatter L.A. Tricyclic antidepressant amitriptyline alters sarcoplasmic reticulum calcium handling in ventricular myocytes. Am. J. Physiol. Heart Circ. Physiol. 2008;295:H2008–H2016. doi: 10.1152/ajpheart.00523.2008. [DOI] [PMC free article] [PubMed] [Google Scholar]
- 21.Foskett J.K., White C., Mak D.O. Inositol trisphosphate receptor Ca2+ release channels. Physiol. Rev. 2007;87:593–658. doi: 10.1152/physrev.00035.2006. [DOI] [PMC free article] [PubMed] [Google Scholar]
- 22.Gillespie D., Fill M. Intracellular calcium release channels mediate their own countercurrent: the ryanodine receptor case study. Biophys. J. 2008;95:3706–3714. doi: 10.1529/biophysj.108.131987. [DOI] [PMC free article] [PubMed] [Google Scholar]
- 23.Gillespie D., Giri J., Fill M. Reinterpreting the anomalous mole fraction effect: the ryanodine receptor case study. Biophys. J. 2009;97:2212–2221. doi: 10.1016/j.bpj.2009.08.009. [DOI] [PMC free article] [PubMed] [Google Scholar]
- 24.O'Connell S.E., Zurzola F.J. Rapid quantitative liquid chromatographic determination of caffeine levels in plasma after oral dosing. J. Pharm. Sci. 1984;73:1009–1011. doi: 10.1002/jps.2600730742. [DOI] [PubMed] [Google Scholar]
- 25.Jiang D., Xiao B., Chen S.R. RyR2 mutations linked to ventricular tachycardia and sudden death reduce the threshold for store-overload-induced Ca2+ release (SOICR) Proc. Natl. Acad. Sci. USA. 2004;101:13062–13067. doi: 10.1073/pnas.0402388101. [DOI] [PMC free article] [PubMed] [Google Scholar]
- 26.Gaburjakova J., Gaburjakova M. Comparison of the effects exerted by luminal Ca2+ on the sensitivity of the cardiac ryanodine receptor to caffeine and cytosolic Ca2+ J. Membr. Biol. 2006;212:17–28. doi: 10.1007/s00232-006-7018-z. [DOI] [PubMed] [Google Scholar]
- 27.Reference deleted in proof.
- 28.Sitsapesan R., Williams A.J. Mechanisms of caffeine activation of single calcium-release channels of sheep cardiac sarcoplasmic reticulum. J. Physiol. 1990;423:425–439. doi: 10.1113/jphysiol.1990.sp018031. [DOI] [PMC free article] [PubMed] [Google Scholar]
- 29.Xu L., Meissner G. Regulation of cardiac muscle Ca2+ release channel by sarcoplasmic reticulum lumenal Ca2+ Biophys. J. 1998;75:2302–2312. doi: 10.1016/S0006-3495(98)77674-X. [DOI] [PMC free article] [PubMed] [Google Scholar]
- 30.Eisner D.A., Kashimura T., Trafford A.W. From the ryanodine receptor to cardiac arrhythmias. Circ. J. 2009;73:1561–1567. doi: 10.1253/circj.cj-09-0478. [DOI] [PubMed] [Google Scholar]
- 31.Ferrier G.R., Saunders J.H., Mendez C. A cellular mechanism for the generation of ventricular arrhythmias by acetylstrophanthidin. Circ. Res. 1973;32:600–609. doi: 10.1161/01.res.32.5.600. [DOI] [PubMed] [Google Scholar]
- 32.Rosen M.R., Gelband H., Hoffman B.F. Mechanisms of digitalis toxicity. Effects of ouabain on phase four of canine Purkinje fiber transmembrane potentials. Circulation. 1973;47:681–689. doi: 10.1161/01.cir.47.4.681. [DOI] [PubMed] [Google Scholar]
- 33.Santiago D.J., Curran J.W., Shannon T.R. Ca sparks do not explain all ryanodine receptor-mediated SR Ca leak in mouse ventricular myocytes. Biophys. J. 2010;98:2111–2120. doi: 10.1016/j.bpj.2010.01.042. [DOI] [PMC free article] [PubMed] [Google Scholar]
- 34.Zima A.V., Bovo E., Blatter L.A. Ca2+ spark-dependent and -independent sarcoplasmic reticulum Ca2+ leak in normal and failing rabbit ventricular myocytes. J. Physiol. 2010;588:4743–4757. doi: 10.1113/jphysiol.2010.197913. [DOI] [PMC free article] [PubMed] [Google Scholar]
- 35.Brochet D.X.P., Xie W., Lederer W.J. Quarky calcium release in the heart. Circ. Res. 2010;108:210–218. doi: 10.1161/CIRCRESAHA.110.231258. [DOI] [PMC free article] [PubMed] [Google Scholar]
- 36.Bers D.M., Stiffel V.M. Ratio of ryanodine to dihydropyridine receptors in cardiac and skeletal muscle and implications for E-C coupling. Am. J. Physiol. 1993;264:C1587–C1593. doi: 10.1152/ajpcell.1993.264.6.C1587. [DOI] [PubMed] [Google Scholar]
- 37.Cheng H., Lederer W.J. Calcium sparks. Physiol. Rev. 2008;88:1491–1545. doi: 10.1152/physrev.00030.2007. [DOI] [PubMed] [Google Scholar]
- 38.Bányász T., Chen-Izu Y., Izu L.T. A new approach to the detection and statistical classification of Ca2+ sparks. Biophys. J. 2007;92:4458–4465. doi: 10.1529/biophysj.106.103069. [DOI] [PMC free article] [PubMed] [Google Scholar]
- 39.Cheng H., Lederer W.J., Cannell M.B. Calcium sparks: elementary events underlying excitation-contraction coupling in heart muscle. Science. 1993;262:740–744. doi: 10.1126/science.8235594. [DOI] [PubMed] [Google Scholar]
- 40.López-López J.R., Shacklock P.S., Wier W.G. Local, stochastic release of Ca2+ in voltage-clamped rat heart cells: visualization with confocal microscopy. J. Physiol. 1994;480:21–29. doi: 10.1113/jphysiol.1994.sp020337. [DOI] [PMC free article] [PubMed] [Google Scholar]
- 41.Franzini-Armstrong C., Protasi F., Ramesh V. Shape, size, and distribution of Ca(2+) release units and couplons in skeletal and cardiac muscles. Biophys. J. 1999;77:1528–1539. doi: 10.1016/S0006-3495(99)77000-1. [DOI] [PMC free article] [PubMed] [Google Scholar]
- 42.Kalyanasundaram A., Bal N.C., Periasamy M. The calsequestrin mutation CASQ2D307H does not affect protein stability and targeting to the junctional sarcoplasmic reticulum but compromises its dynamic regulation of calcium buffering. J. Biol. Chem. 2010;285:3076–3083. doi: 10.1074/jbc.M109.053892. [DOI] [PMC free article] [PubMed] [Google Scholar]
- 43.Terentyev D., Viatchenko-Karpinski S., Györke S. Protein protein interactions between triadin and calsequestrin are involved in modulation of sarcoplasmic reticulum calcium release in cardiac myocytes. J. Physiol. 2007;583:71–80. doi: 10.1113/jphysiol.2007.136879. [DOI] [PMC free article] [PubMed] [Google Scholar]
- 44.Beard N.A., Sakowska M.M., Laver D.R. Calsequestrin is an inhibitor of skeletal muscle ryanodine receptor calcium release channels. Biophys. J. 2002;82:310–320. doi: 10.1016/S0006-3495(02)75396-4. [DOI] [PMC free article] [PubMed] [Google Scholar]
- 45.Soeller C., Crossman D., Cannell M.B. Analysis of ryanodine receptor clusters in rat and human cardiac myocytes. Proc. Natl. Acad. Sci. USA. 2007;104:14958–14963. doi: 10.1073/pnas.0703016104. [DOI] [PMC free article] [PubMed] [Google Scholar]
- 46.Marx S.O., Gaburjakova J., Marks A.R. Coupled gating between cardiac calcium release channels (ryanodine receptors) Circ. Res. 2001;88:1151–1158. doi: 10.1161/hh1101.091268. [DOI] [PubMed] [Google Scholar]
- 47.Baddeley D., Jayasinghe I.D., Soeller C. Optical single-channel resolution imaging of the ryanodine receptor distribution in rat cardiac myocytes. Proc. Natl. Acad. Sci. USA. 2009;106:22275–22280. doi: 10.1073/pnas.0908971106. [DOI] [PMC free article] [PubMed] [Google Scholar]
- 48.Mejía-Alvarez R., Kettlun C., Fill M. Unitary Ca2+ current through cardiac ryanodine receptor channels under quasi-physiological ionic conditions. J. Gen. Physiol. 1999;113:177–186. doi: 10.1085/jgp.113.2.177. [DOI] [PMC free article] [PubMed] [Google Scholar]
- 49.Kettlun C., González A., Fill M. Unitary Ca2+ current through mammalian cardiac and amphibian skeletal muscle ryanodine receptor channels under near-physiological ionic conditions. J. Gen. Physiol. 2003;122:407–417. doi: 10.1085/jgp.200308843. [DOI] [PMC free article] [PubMed] [Google Scholar]
- 50.Wang S.Q., Song L.S., Cheng H. Ca2+ signalling between single L-type Ca2+ channels and ryanodine receptors in heart cells. Nature. 2001;410:592–596. doi: 10.1038/35069083. [DOI] [PubMed] [Google Scholar]
- 51.Terentyev D., Viatchenko-Karpinski S., Györke S. Luminal Ca2+ controls termination and refractory behavior of Ca2+-induced Ca2+ release in cardiac myocytes. Circ. Res. 2002;91:414–420. doi: 10.1161/01.res.0000032490.04207.bd. [DOI] [PubMed] [Google Scholar]
- 52.Ramos-Franco J., Gomez A.M., Fill M. Ryanodol action on calcium sparks in ventricular myocytes. Pflugers Arch. 2010;460:767–776. doi: 10.1007/s00424-010-0839-8. [DOI] [PMC free article] [PubMed] [Google Scholar]