

Abstract
Rearrangement of tertiary structure in response to mechanical force (termed tertiary structure elasticity) in the tandem Ig chain is the first mode of elastic response for muscle protein titin. Tertiary structure elasticity occurs at low stretching forces (few tens of pN), and was described at atomic resolution in a recent molecular dynamics study, in which an originally crescent-shaped six-Ig chain was stretched into a linear chain. However, the force-extension profile that resulted from this explicit solvent simulation was dominated by the hydrodynamic drag force, and effects of tertiary structure elasticity only manifested for stretching forces above 20 pN. Here we report a slow pulling 100-ns simulation (along with other auxiliary simulations), in which hydrodynamic drag force is seen to reduce to near 0 pN, such that tertiary structure elasticity could be characterized over a 0–200 pN range. Statistical mechanical analysis showed that the stretching velocity was sufficiently low such that the protein remained significantly relaxed during the major part of its extension.
Titin is the largest (∼38,000 amino acids) and longest (>1 μm) protein known to date, and is responsible for the elasticity and structural integrity of the muscle sarcomere (1). Through two decades of experimental and theoretical investigations, it has been shown that titin responds to mechanical forces in different stages (2). At forces of a few pN, titin transforms from a coiled and compact configuration into a linear chain of connected domains, the mode of force response termed “tertiary structure elasticity” (3,4). At forces in the range of tens of pN, the disordered region of titin, e.g., the PEVK segment, unravels (5). At physiologically extreme forces above 100 pN, some of the titin domains, particularly the immunoglobulin-like (Ig) domains, lose their β-sandwich secondary structure one-by-one, providing further relief of tension (termed “secondary structure elasticity”) (4,6).
Secondary structure elasticity of the Ig domains is perhaps the best understood force response of titin. Experimental and theoretical studies have illustrated how a network of hydrogen bonds within each Ig domain provides resistance to force (7,8). In contrast, tertiary structure elasticity is less understood. Given that tertiary structure elasticity is physiologically relevant in muscle functioning (whereas the role of secondary structure elasticity of the Ig domains is still being debated (9)), more attention is needed for titin's tertiary structure elastic response.
The atomic structure of a segment of titin with multiple (six) connected Ig domains became available in 2008 (10) (Fig. 1 A; the segment is hereafter referred to as the six-Ig chain), enabling probing of the domain-domain motions that give rise to an overall elasticity (4). Tertiary structure elasticity can be understood in a statistical mechanical framework, in which many degrees of freedom within the six-Ig chain contribute in a quasistationary manner to the overall mechanical response (4). The most prominent degrees of freedom in the six-Ig chain contributing to chain extension are the bending degrees of freedom between neighboring domain pairs. The bending motion is described by a potential energy Vi(θi), with θi being the angle between the particular domain pair. Vi(θi) can be expressed as a function of the end-to-end length of the domain pair, i.e., , and can also be transformed into a length distribution, pi(xi), via the Boltzmann relation (3,4).
Figure 1.
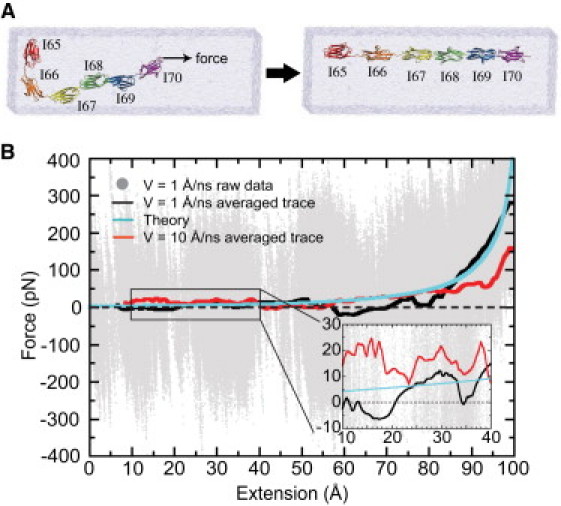
(A) SMD simulation stretching a six-Ig chain. Each Ig domain is colored differently for distinction; water box is shown in transparent blue. (B) The force-extension profile measured in SMD simulations. Raw data obtained using v = 1 Å/ns is shown in gray, with the average trace drawn in black. Theoretical calculation is shown in light blue. For comparison, result from Lee et al. (4) employing v = 10 Å/ns is displayed in red.
Properties of the full chain, particularly the overall length distribution, P(X), and the average overall chain length 〈X〉 in response to application of force f, can be computed (4)
| (1) |
| (2) |
with N being the number of degrees of freedom contributing to extension, and the force as a function of extension is f(〈X〉) = g−1(〈X〉); this function defines the force-extension profile of the six-Ig chain in thermodynamic equilibrium.
During a steered molecular dynamics (SMD) (11) stretching simulation employing a constant pulling velocity, the force-extension profile can be monitored directly. To compute this profile with f(〈X〉), i.e., assuming for the force-extension relationship equilibrium values as will be justified below, one employs the strong friction limit Langevin equation
| (3) |
where γ is the friction constant, ks the SMD spring constant, v the pulling velocity, and 〈ξ(t)〉 describes noise with its RMSD denoted by σ. At small extension while f(〈X〉) is negligible, Eq. 3 can be solved exactly, yielding the force measured by the SMD spring to be F0 = vγ. Assuming typical protein diffusion, an SMD simulation employing a stretching velocity of v = 10 Å/ns results in F0 ∼ 28 pN (4). For this reason, the effect from tertiary structure elasticity of the six-Ig chain reported in Lee et al. (4) was drowned by the hydrodynamic drag force during much of the simulation, namely when the force required to extend the six-Ig chain was below 28 pN. Otherwise, the analysis based on Eq. 3 gave excellent agreement with the simulation data (4).
Here a 100-ns SMD simulation is performed with a 10-fold reduced pulling velocity. In this case, the hydrodynamic drag force drops to F0 ∼ 2.8 pN, such that nearly all of the force-extension profile discerned in the simulation is a direct result of the internal forces of the six-Ig chain, namely the tertiary structure elasticity. Indeed, as shown in the force-extension profile in Fig. 1 B, the stretching force measured in the v = 1 Å/ns simulation (black trace) is lower than that in the v = 10 Å/ns simulation (red trace), with the average stretching forces (for extension <60 Å) measured to be 5 pN and 28 pN for pulling velocities v = 1 and 10 Å/ns, respectively. The statistical mechanical model (light-blue trace in Fig. 1 B), described in Lee et al. (4) and outlined in Eqs. 1–3, captures also very well the pattern of the force-extension curve for v = 1 Å/ns as expected, as the equilibrium condition holds even better for slower stretching.
SMD simulation at v = 1 Å/ns produces a molecular trajectory that is visibly different from the v = 10 Å/ns trajectory; the trajectories are included as Movie S1 (v = 1 Å/ns) and Movie S2 (v = 10 Å/ns) in the Supporting Material. One prominent difference is the more extensive random motion experienced by the atom being pulled by the SMD spring in the case of the slower pulling (see Fig. S1in the Supporting Material); this motion suggests that, for the case of slower pulling, the six-Ig chain has more time to explore its conformational space. A related point is illustrated in Fig. 2 A, which tracks the angle between domains I68 and I69 during chain extension in both SMD simulations. Although this angle maintains, amid large amplitude rapid fluctuation, a steady value near 155° until large extension for the case of slow pulling (blue trace in Fig. 2 A), it fluctuates more slowly, but erratically in the case of faster pulling (red trace in Fig. 2 A). This difference in behavior can be understood by considering the potential of mean force for the associated bending motion, computed in Lee et al. (4) and shown in Fig. 2 B. The bending motion of I68-I69 exhibits an energy minimum near 155°, which is also the angle maintained during an equilibrium simulation containing only the I68-I69 pair (4). It seems that the slower pulling simulation reproduces certain equilibrium molecular features.
Figure 2.
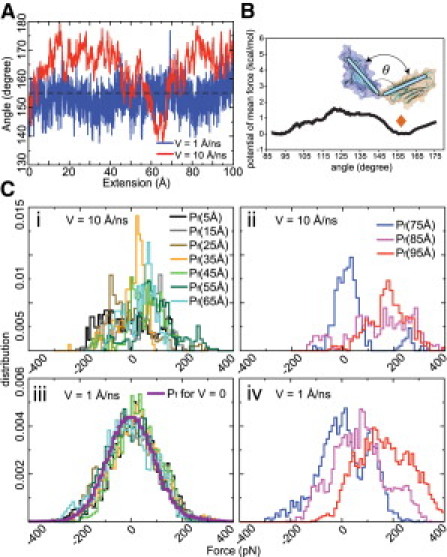
(A) Angle θ between Ig domains I68 and I69 as a function of the six-Ig chain extension measured in two SMD simulations (blue, v = 1 Å/ns; red, v = 10 Å/ns). A dashed line is drawn at θ = 155° as a guide to the eye. (B) PMF as a function of θ for I68-I69 (4); the orange diamond denotes the angle observed in an equilibrium simulation of I68-I69 (4). (C) Distribution of stretching forces: simulation with v = 10 Å/ns during (i) early stage of stretching and (ii) later stage of stretching, and simulation with v = 1 Å/ns during (iii) early stage of stretching and (iv) later stage of stretching.
Fig. 2 C showcases the distribution of forces at several extensions. For the case of v = 10 Å/ns pulling velocity, the force distribution appears to be irregular both for small extension (Fig. 2 C i) and large extension (Fig. 2 C ii). For the case of v = 1 Å/ns, the force distribution for small extension (Fig. 2 C iii) is nearly Gaussian, and coincides actually with the force distribution measured in another SMD simulation with v = 0 Å/ns (i.e., without pulling but with constraint on the terminal atoms). At larger extension, the force distribution loses its Gaussian form, but the average force is seen to increase steadily (Fig. 2 C iv), a feature not seen in the more erratic distributions in Fig. 2 C ii for v = 10 Å/ns. It appears that in the slower stretching simulation, for small extension, the six-Ig chain acts as a quasiequilibrated system. For larger extension, however, equilibrium dynamics is not reproduced by either slow or fast stretching.
The observation that in the v = 1 Å/ns SMD simulation the six-Ig chain remained in quasiequilibrium during early stretching can be explained by considering the intrinsic relaxation time associated with the tertiary structure motion of the chain. An extended equilibrium simulation was carried out and is summarized in Fig. S2. The backbone root-mean square deviation in reference to the initial structure of the protein reached a plateau after ∼10 ns (Fig. S2 A), indicating that the protein is equilibrated at a local energy minimum. Similarly, the end-to-end distance of the six-Ig chain attained a stationary value after 7 ns (Fig. S2 B). The distribution of the end-to-end distance (for t > 7 ns; Fig. S2 C) is a Gaussian with a mean of 184.1 Å and variance of 2.0 Å. The relaxation of the protein motion is assessed by computing the autocorrelation function of the end-to-end extension (for t > 7 ns; Fig. S2 D), which can be fitted to a monoexponential exp[−t/τ0] with τ0 = 0.44 ns, i.e., for the 2.0 Å diffusive motion of six-Ig chain extension, a relaxation time of 0.44 ns is required. For a stretching velocity v = 10 Å/ns, a displacement of 2.0 Å is covered within τv10 = 0.2 ns, which is less than the relaxation time of 0.44 ns. For the slower stretching velocity of 1 Å/ns, 2.0 Å is covered within τv1 = 2 ns, which is longer than τ0 and, therefore, allows relaxation to a quasistationary state.
In summary, by reducing the pulling velocity at the cost of a longer SMD simulation, the tertiary structure elasticity of a titin Ig-chain, directly involved in the physiological functioning of muscle, is observed in its totality as the hydrodynamic drag force is sufficiently decreased. In addition, a lower pulling velocity enables the stretched system to remain in quasiequilibrium (for small extension); the precise velocity needed can be estimated in an equilibrium simulation monitoring the extension autocorrelation function. It is also worth noting that the noise term, ξ(t), in the Langevin equation (Eq. 3) is not pure Gaussian white noise, i.e., . Rather, ξ(t) represents colored noise, i.e.,,that depends on protein dynamics, as is evident from the nonzero relaxation time of the stretching force autocorrelation function (τ = 5.5 ps; see Fig. S3). Application of the Langevin equation in describing protein processes should account for the actual spectrum of the noise.
Acknowledgments
Simulations were performed using NAMD (12); molecular renderings were done using VMD (13).
We thank Olga Mayans, Ioan Kosztin, Johan Strumpfer, and Eric H. Lee for useful discussions.
This work was supported by National Institutes of Health grants No. P41-RR005969 and No. R01-GM073655, and National Science Foundation computer-time grant No. TRAC MCA93S028.
Footnotes
Jen Hsin's present address is Department of Bioengineering, Stanford University, Stanford, CA.
Supporting Material
References and Footnotes
- 1.Tskhovrebova L., Trinick J. Titin: properties and family relationships. Nat. Rev. Mol. Cell Biol. 2003;4:679–689. doi: 10.1038/nrm1198. [DOI] [PubMed] [Google Scholar]
- 2.Hsin J., Strumpfer J., Schulten K. Molecular origin of the hierarchical elasticity of titin: simulation, experiment and theory. Annu. Rev. Biophys. 2011 doi: 10.1146/annurev-biophys-072110-125325. In press. [DOI] [PubMed] [Google Scholar]
- 3.Lee E.H., Hsin J., Schulten K. Secondary and tertiary structure elasticity of titin Z1Z2 and a titin chain model. Biophys. J. 2007;93:1719–1735. doi: 10.1529/biophysj.107.105528. [DOI] [PMC free article] [PubMed] [Google Scholar]
- 4.Lee E.H., Hsin J., Schulten K. Tertiary and secondary structure elasticity of a six-Ig titin chain. Biophys. J. 2010;98:1085–1095. doi: 10.1016/j.bpj.2009.12.4192. [DOI] [PMC free article] [PubMed] [Google Scholar]
- 5.Linke W.A., Ivemeyer M., Kolmerer B. Nature of PEVK-titin elasticity in skeletal muscle. Proc. Natl. Acad. Sci. USA. 1998;95:8052–8057. doi: 10.1073/pnas.95.14.8052. [DOI] [PMC free article] [PubMed] [Google Scholar]
- 6.Li H., Linke W.A., Fernandez J.M. Reverse engineering of the giant muscle protein titin. Nature. 2002;418:998–1002. doi: 10.1038/nature00938. [DOI] [PubMed] [Google Scholar]
- 7.Lu H., Isralewitz B., Schulten K. Unfolding of titin immunoglobulin domains by steered molecular dynamics simulation. Biophys. J. 1998;75:662–671. doi: 10.1016/S0006-3495(98)77556-3. [DOI] [PMC free article] [PubMed] [Google Scholar]
- 8.Marszalek P.E., Lu H., Fernandez J.M. Mechanical unfolding intermediates in titin modules. Nature. 1999;402:100–103. doi: 10.1038/47083. [DOI] [PubMed] [Google Scholar]
- 9.Linke W.A., Leake M.C. Multiple sources of passive stress relaxation in muscle fibers. Phys. Med. Biol. 2004;49:3613–3627. doi: 10.1088/0031-9155/49/16/009. [DOI] [PubMed] [Google Scholar]
- 10.von Castelmur E., Marino M., Mayans O. A regular pattern of Ig super-motifs defines segmental flexibility as the elastic mechanism of the titin chain. Proc. Natl. Acad. Sci. USA. 2008;105:1186–1191. doi: 10.1073/pnas.0707163105. [DOI] [PMC free article] [PubMed] [Google Scholar]
- 11.Isralewitz B., Gao M., Schulten K. Steered molecular dynamics and mechanical functions of proteins. Curr. Opin. Struct. Biol. 2001;11:224–230. doi: 10.1016/s0959-440x(00)00194-9. [DOI] [PubMed] [Google Scholar]
- 12.Phillips J.C., Braun R., Schulten K. Scalable molecular dynamics with NAMD. J. Comput. Chem. 2005;26:1781–1802. doi: 10.1002/jcc.20289. [DOI] [PMC free article] [PubMed] [Google Scholar]
- 13.Humphrey W., Dalke A., Schulten K. VMD: visual molecular dynamics. J. Mol. Graph. 1996;14 doi: 10.1016/0263-7855(96)00018-5. 33–38., 27–28. [DOI] [PubMed] [Google Scholar]
Associated Data
This section collects any data citations, data availability statements, or supplementary materials included in this article.