Abstract
We have examined hepatic, genomic, and metabolic responses to dietary protein restriction in the non-pregnant Sprague-Dawley rat. Animals were pair-fed either a 6 or 24% casein-based diet for 7–10 days. At the end of the dietary period, a microarray analysis of the liver was performed, followed by validation of the genes of interest. The rates of appearance of phenylalanine, methionine, serine, and glucose and the contribution of pyruvate to serine and glucose were quantified using tracer methods. Plasma and tissue amino acid levels, enzyme activities, and metabolic intermediates were measured. Protein restriction resulted in significant differential expression of a number of genes involved in cell cycle, cell differentiation, transport, transcription, and metabolic processes. RT-PCR showed that the expression of genes involved in serine biosynthesis and fatty acid oxidation was higher, and those involved in fatty acid synthesis and urea synthesis were lower in the liver of protein-restricted animals. Free serine and glycine levels were higher and taurine levels lower in all tissues examined. Tracer isotope studies showed an ∼50% increase in serine de novo synthesis. Pyruvate was the primary (∼90%) source of serine in both groups. Transmethylation of methionine was significantly higher in the protein-restricted group. This was associated with a higher S-adenosylmethionine/S-adenosylhomocysteine ratio and lower cystathione β-synthase and cystathionine γ-lyase activity. Dietary isocaloric protein restriction results in profound changes in hepatic one-carbon metabolism within a short period. These may be related to high methylation demands placed on the organism and caused by possible changes in cellular osmolarity as a result of the efflux of the intracellular taurine.
Keywords: Gene Expression, Metabolism, Methionine, Rat, Serine, Amino Acid Metabolism
Introduction
The metabolic and biochemical impact of qualitative and quantitative changes in dietary protein intake continues to be of interest because of their implications for public health and because of a number of studies showing a strong relationship between protein intake during pregnancy with cardiovascular function, hypertension, and glucose intolerance in the offspring (1–3). Studies in humans, primarily focused on whole body protein, nitrogen metabolism, and protein accretion, show that both high and low protein intake can impact these processes (4–7). However, how humans adapt to protein deprivation or the biochemical mechanisms involved has not been examined. In the context of pregnancy, both high protein intake (in humans) and protein restriction in rodents have been shown to cause fetal metabolic programming and consequently altered physiological response in the offspring in adulthood (8–11). In the rodent, dietary protein restriction during pregnancy results in growth retardation, impaired beta cell function and mass, impaired insulin sensitivity, hypertension, and other pathological responses in the offspring (1, 2). These have been associated with a change in the hypothalamic-pituitary-adrenal axis, changes in the renin-angiotensin system, and alterations in the concentration of the catecholamine and adrenoreceptors (reviewed in Ref. 2). These observations have been attributed to metabolic programming or imprinting, although the mechanism of such imprinting (of the fetus) has not been identified (1).
The effect of total protein deprivation or total and specific amino acid starvation has been examined in isolated cell systems and in vivo (12). These data may not be comparable with the in vivo physiological situation where such total deprivations are not observed. Other studies have examined the consequence of protein restriction or individual amino acid deprivation on specific biochemical pathways (13, 14). However, a comprehensive metabolic and biochemical evaluation of an organ system in vivo has not been done. Such studies are important to explore the specific biochemical cues that trigger a particular phenotype. In this study, we have examined the hepatic genomic and metabolic responses to dietary protein restriction for 7–10 days. Using the gene array approach, we identified the pathways of interest and have quantified the changes in the specific metabolic pathway by measuring the metabolic intermediates and the activity of enzymes involved and by quantifying the substrate flux using tracer isotopic methods. Our data show dietary protein restriction in the rat resulted in differential expression of genes involved in various cell cycle and metabolic processes and resulted in profound changes in methionine and serine metabolism.
MATERIALS AND METHODS
Animals
Non-pregnant Sprague-Dawley rats were obtained from Zivic-Miller Laboratories Inc. (Zelienople, PA). All studies were conducted at the animal care facility of Case Western Reserve University, MetroHealth Medical Center, Cleveland, OH. The protocol was reviewed and approved by the Institutional Animal Care and Use Committee. American Association for the Accreditation of Laboratory Care Guidelines were followed for all the studies. The animal care facility was maintained under an ambient temperature (22 ± 1 °C) and light (on at 0600 h, off at 1800 h) conditions. After acclimatization for 3 days, the animals were placed on either protein-restricted (6%, LP)2 or normal protein (24%, NP) diet for 7–10 days. The control group was pair-fed. The pair-feeding was performed by offering the amount of food taken by the experimental animal pair (LP) on the previous day to the NP pair. The source of protein was casein. The composition of the diet is displayed in supplemental Table 1 (24% protein (TD90017), 6% protein (TD90016); Harlan Teklad, Madison, WI). The carbohydrate content (nitrogen-free extract) in the LP diet was increased to make it isoenergetic. The amount of water and food ingested was measured daily. The animals were weighed every 3 days during the study. At the end of the study period, the animals were anesthetized using intraperitoneal pentobarbital (100 mg per kg body weight). All isotopic tracers studies and blood and tissue samples were obtained from fasted (12 h) animals. Blood and tissue samples were collected rapidly. Tissue samples were snap-frozen in liquid nitrogen. The biological samples were stored at −80 °C for future analysis.
Isotopic Tracer Studies
Male Sprague-Dawley rats weighing 250–300 g with indwelling carotid artery and jugular vein catheters were obtained form Zivic-Miller Laboratories. The indwelling PE50 catheters were placed 3–4 days prior to transfer of the animals to our institution. The surgical procedures were performed under anesthesia and sterile conditions. The catheters were tunneled subcutaneously, and the distal end of each catheter was sutured to the dorsum of the neck. The catheters were filled with an anticoagulant solution, capped, and secured on the top of the neck. Postoperatively, the animals were given analgesic for pain (0.2 ml of Ketosen®, 10 mg/ml) and were placed on ad libitum rat chow and water. Following recovery from surgery (3–4 days), the animals were placed on the dietary regimens described above.
Tracer studies were performed during fasting that started at 8 a.m. Food was removed at 6 p.m. the evening before the study; water was provided ad libitum. Isotopic tracers were administered as prime-constant rate infusion. The respective rate of infusion of the various tracers were as follows: [2H5]phenylalanine, 0.4 μmol·100 g−1·h−1; [13C,15N]serine, 1 μmol·100 g−1·h−1; [13C,2H3]methionine, 0.8 μmol·100 g−1·h−1; [1-14C]methionine, 0.4 μCi·100 g−1·h−1. The priming dose corresponding to ∼30 min of infusion (0.25 ml) was administered over 10–15 min. The sampling line (carotid artery) was kept patent by infusing isotonic saline at 0.5 ml/h. The animals were unrestrained, awake, and moved freely in the cage during the experiment. Blood samples (0.5 ml) were obtained in heparinized syringes at 240, 270, 300, and 330 min. Respiratory calorimetry measurements were done using an open canopy system as described previously (15).
The specific activity of expired CO2 was measured as follows. The animal in the cage was placed under a canopy. The air in the canopy was suctioned using the wall suction. A part of the outflow stream was slowly bubbled through 2 ml of CO2 trapping solution (0.006 g of thymolphthaline, 100 g of absolute alcohol, 100 ml of 1 m methylbenzethonium hydroxide) until colorless, representing absorption of 1 mmol of CO2 (16). Scintillation mixture (10 ml) was added to the colorless solution, and the radioactivity was measured on a beta counter.
The rate of production of glucose was measured in a separate group of animals using [6,6-2H2]glucose tracer as described previously (17). Gluconeogenesis from pyruvate was quantified by measuring the incorporation of 2H in C-6 of glucose following the 2H labeling of the total body water (18). Similarly, the contribution of pyruvate to serine was measured by the incorporation of 2H of water in plasma serine.
Analysis
Tracer Enrichment in Plasma
The isotopic enrichment of phenylalanine (m5), methionine (m4), serine (m2 and m3), and glycine (m2) in the plasma was measured following preparatory separation by ion exchange chromatography on a gas chromatograph mass spectrometer as described from our laboratory (19, 20).The 2H enrichment of C-6 of glucose was measured using the hexamethylene tetramine derivative method (21).
The specific activity of [1-14C]methionine in plasma was estimated as follows. The concentration of methionine in the plasma was measured by HPLC (15). An aliquot of plasma was treated with perchloric acid to remove [14C]O2. The radioactivity in the supernatant was measured using a beta counter. It is assumed that all the radioactivity in the supernatant represents methionine. The contribution of other labeled products of methionine metabolism is likely to be small.
Gene Array Analysis
Total RNA was extracted from the livers of five rats on the NP diet and four on the LP diet. The RNA was prepared according to the vendor's protocol (Affymetrix, Santa Clara, CA). All samples were tested using the Rat Expression Array 230 version 2.0 whole genome oligonucleotide arrays (Affymetrix, Santa Clara, CA). Signals were generated from the scanned image files using Affymetrix proprietary software, GeneChip Operating Software (GCOS), and Affymetrix standard operating procedures. Microarray Suite 5 (MAS 5) algorithms were used to convert gel files into spreadsheets of data. Array-wide data for individual samples were uniformly scaled to 500 and exported to MS Excel. Data were imported into BAMarray (Bayesian Analysis of Microarray data) software. Data were analyzed for significant changes in expression.
There were 483 genes called significantly increased and a further 541 genes called decreased. BAM does not comment on magnitude of the fold changes, and so we cross-referenced the significantly changed genes with the ratio between group signal averages on a per gene basis. We set the cutoff ratio to +1.5 and −1.5 for the increases and decreases, respectively. This second screening gave us a set of 232 gene transcripts that were increased and 318 that were decreased (supplemental Tables 4, A and B) The list of increased and decreased gene transcripts were imported separately into PathwayStudio 6.2 (Ariadne, Rockville, MD) and screened for the enrichment of biological processes. In this step, PathwayStudio 6.2 compared the number of genes in a particular Gene Ontology category in its data base with the number of observed genes from the same category in the imported set of genes using Fisher's exact test and displayed the results with a p value to indicate whether the imported list was enriched with members from this category. In this way, we generated two lists of enriched biological groups as follows: one represented increases and the other represented decreases. These lists were subjected to three screening steps in the following sequence. 1) All biological processes with assigned p values greater than 0.05 were expunged from the list. 2) The remaining list of components was sorted in descending order on the number of gene identities in common between the Gene Ontology category in the imported gene list and that of the Pathway Studio data base list. All biological categories in which the common genes numbered only 1 were excluded. 3) The remaining biological processes were screened subjectively. Groups that were perceived as pertinent to the study were kept; others from many and diverse areas of biology were removed.
Quantitative Real Time PCR
Quantification of RNA was done using real time PCR using the protocol described (22). Rat tissue samples were homogenized using a Brinkmann tissue homogenizer, and RNA was extracted using 5 ml of TRI Reagent as per the manufacturer's protocol. Debris was removed by centrifugation, and RNA was collected and resuspended in diethyl pyrocarbonate-treated water. The concentration of RNA was estimated by measuring absorption at 260 and 280 nm. Quality verification of the RNA sample was performed by separating 10 μg of total RNA on a 1.25% formaldehyde agarose gel. BD Clontech kit protocol was followed to synthesize first strand cDNA from 1 μg of total RNA. Oligonucleotide primers used for the various genes are shown in supplemental Table 2 (primer list). Real time PCR was performed using protocols previously described (22). Real time PCR for quantification of mRNA was performed on a Stratagene Mx3000P (Stratagene Inc., La Jolla, CA) using a SYBR® protocol on the fluorescence temperature cycler. Results were expressed as fold change in expression of each gene in the low protein diet-fed rats compared with the control normal protein diet-fed animals using a relative quantification method (23). The relative expression of the gene of interest in the LP diet rats was quantified compared with its expression in the NP diet-fed controls. All real time PCR products were then separated on a 1.5% Tris/acetic acid-agarose electrophoresis to confirm product presence and size.
Other Biochemical Analysis
Amino acid concentration in the plasma and tissues were measured following pre-column o-phthaldehyde derivatization and using high performance liquid chromatography (HPLC) with fluorometric detection (20). Rat tissues (liver, skeletal muscle, and kidney) were homogenized in 3% sulfosalicylic acid (1:4 dilution). The homogenate was centrifuged and the supernatant used for analysis.
AdoMet and AdoHcy concentrations were measured as described by Merali et al. (24). Plasma concentrations of cysteine, homocysteine, and glutathione were measured as described by Garcia and Apitz-Castro (25).
Enzyme Activity Measurements
Cystathionine γ-lyase activity in the liver homogenate, 25 μl, was measured as described by Stipanuk (26). Briefly, 1 ml of the reaction mixture contained 100 mm potassium phosphate buffer, pH 7.5, 4.0 mm l-cystathionine, 0.125 mm pyridoxal 5′-phosphate, 0.32 mm NADH, 1.5 units of lactate dehydrogenase. The rate of production of pyruvate was measured by the decrease in the absorbance at 340 min using a spectrophotometer. Maximal velocity was calculated from the linear portion of the reaction. Glycine N-methyltransferase activity was measured as described by Rowling et al. (27). Glycine N-methyltransferase activity assay was initiated by the addition of 250 μg of protein from the liver homogenate to a reaction mixture containing 200 mm Tris, pH 9.0, 5 mm dithiothreitol, 2 mm glycine, and 0.2 mm S-adenosyl-l-[methyl-3H]methionine and incubated at 37 °C for 30 and 60 min. The reaction was stopped by adding 50 μl of 10% TCA to the reaction mixture. Unreacted AdoMet was removed by the addition of activated charcoal, and an aliquot of the subsequent supernatant was removed for scintillation counting. The assay was linear with respect to time and protein concentration. The activity was expressed as nanomoles of sarcosine formed per mg protein per min.
Methionine synthase activity in liver homogenate was measured by the formation of methionine in the presence of homocysteine and [6-14C]methyl tetrahydrofolate (28). 100 μl of tissue homogenate was incubated with 100 μl of reaction mixture. The concentration of the reagents were 14.5 mm homocysteine, 2.5 mm S-adenosyl-l-methionine, 0.05 mm cyanocobalamin, 15 mm dithiothreitol in 85 mm phosphate buffer, pH 7.5. The methionine produced was separated by ion exchange chromatography and radioactivity counted in a Packard scintillation counter.
Cystathionine γ-lyase activity was also measured, as described by Heinonen (29), by quantifying the rate of production of cysteine from cystathionine in the presence of pyridoxal phosphate. The amount of cysteine in the reaction mixture was measured by HPLC (25). Cystathionine β-synthase activity was measured using the method of Mudd et al. (30). The rate of synthesis of [14C]cystathionine from [14C]serine and -homocysteine was quantified in the presence of pyridoxal phosphate.
Phosphoenolpyruvate mRNA and protein were measured as described previously (31). Phosphoenolpyruvate carboxykinase activity in the liver of the rats was measured by the method Ballard and Hanson (32).
Calculations and Statistical Analysis
The rate of appearance of each amino acid was calculated using tracer dilution method during isotopic steady state as shown in Equation 1,
where Ra = rate of appearance (μmol·100 g−1·h−1); Ep is the enrichment of respective tracer in the plasma, and I is the rate of infusion of isotopic tracer. The contribution of [1-14C]methionine to expired CO2, a measure of the rate of trans-sulfuration of methionine, was calculated from the specific activity of expired CO2 and plasma methionine-specific activity using the precursor-product relationship (33).The contribution of pyruvate to glucose (gluconeogenesis) and to serine was calculated from their respective tracer enrichments and the precursor-product relationship. Because there were three labeled hydrogens on the serine molecule, the enrichment of serine was divided by 3.
All data are reported as means ± S.E. Student's t test was used to examine statistically significant (p < 0.05) differences among the groups.
RESULTS
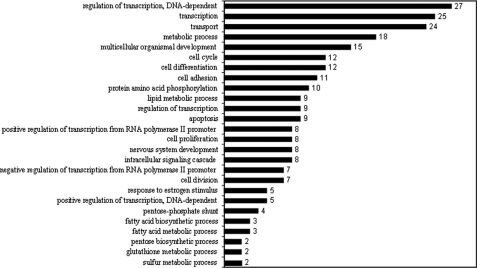
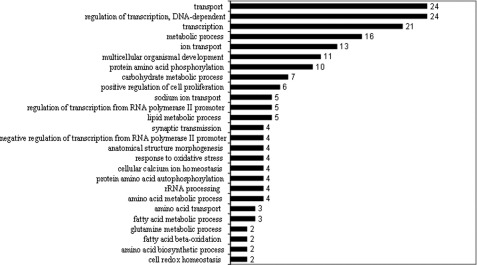
Dietary protein restriction caused differential regulation of a number of genes involved in several biological processes in the liver. Some of these processes and the respective number of genes that were significantly changed by dietary intervention are displayed in Figs. 1 and 2. As shown, significant down-regulation was observed among genes involved in cell cycling, differentiation, and apoptosis, and significant up-regulation was observed among those involved in the response to oxidative stress and cellular redox homeostasis. Some genes of particular interest involved in specific metabolic processes are listed in supplemental Table 3, A and B.
FIGURE 1.
Biological processes with significantly down-regulated genes (numbers) in the liver of the protein-restricted animals.
FIGURE 2.
Biological processes with significantly up-regulated genes (numbers) in the liver of the protein-restricted animals.
As anticipated, the regulation of metabolic processes involved both up-regulated and down-regulated genes. The expression of genes involved in fatty acid oxidation was increased, and those involved in fatty acid synthesis were decreased. In addition, the expression of genes for glucose-6-phosphate dehydrogenase and phosphogluconate dehydrogenase was markedly lower in response to dietary protein restriction. Among the genes involved in amino acid metabolism, a significant increase was observed for those involved in serine biosynthesis via the phosphorylated intermediate pathway (3-phosphoglycerate dehydrogenase, phosphoserine aminotransferase). Also of interest was the increased expression of histidine decarboxylase, cysteinesulfinic acid decarboxylase, and asparagine synthetase.
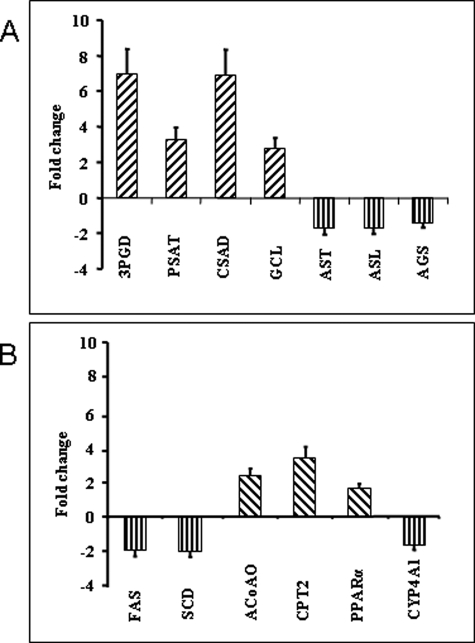
We confirmed by RT-PCR the changes in expression of the genes of interest in hepatic metabolism of serine, urea, and fatty acids. As shown in Fig. 3, in protein-restricted animals, there was an increase in the mRNA for 3-phosphoglycerate dehydrogenase (EC 1.1.1.95), phosphoserine aminotransferase (EC 2.6.1.52), cysteinesulfinic acid decarboxylase (EC 4.1.129), and glutamate-cysteine ligase (EC 6.3.2.2). In contrast, the genes for the enzymes involved in urea synthesis, aspartate aminotransferase (EC 2.6.1.1), argininosuccinate lyase (EC 4.3.2.1), and argininosuccinate synthase (EC 6.3.4.5) were repressed. The changes in genes involved in fatty acid synthesis (fatty-acid synthase (EC 2.3.1.85) and stearoyl-CoA desaturase (EC 1.14.19.1)) were down-regulated, although the genes for those involved in fatty acid oxidation (carnitine O-palmitoyltransferase 2 (EC 2.3.1.21), acyl-CoA oxidase (EC 1.3.3.6), and peroxisome proliferator-activated receptor-α) were up-regulated, suggesting higher expression of enzymes involved in fatty acid oxidation in protein-restricted animals. Finally, CYP4A1 was down-regulated in the LP group.
FIGURE 3.
Quantitative changes (mean ± S. E.) by real time PCR in the mRNA of the various genes in the liver of the protein-restricted animals. Bars above the base line show an increase and those extending below it show a decrease in the expression of mRNA. 3PGD, 3-phosphoglycerate dehydrogenase; PAST, phosphoserine aminotransferase; CSAD, cysteinesulfinic acid decarboxylase; CGL, glutamate-cysteine ligase; AST, argininosuccinate lyase; AGS, argininosuccinate synthase; FAS, fatty-acid synthase; SCD, steroyl-CoA desaturase; ACoAO, acyl-CoA oxidase; CPT2, carnitine-O-palmitoyltransferase.
The hepatic gene array data suggest an attempt at nitrogen conservation (lower urea synthesis), higher serine biosynthesis, lower fatty acid synthesis, and higher fatty acid oxidation, probably related to high energy demands in the liver.
Amino Acid Concentration in Plasma and Tissues
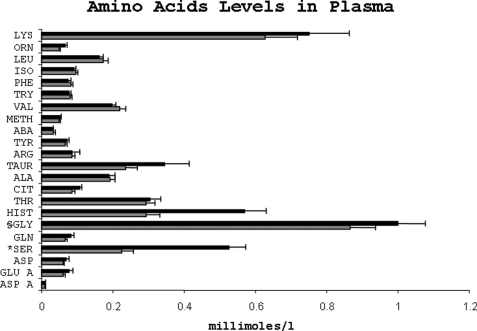
The total amino nitrogen concentration in the plasma was higher in the protein-restricted group (LP, 4.93 ± 55.9; NP, 3.93 ± 43.9 mm·liter−1, mean ± S.E.); however, the difference was not statistically significant. As shown in Fig. 4, the plasma concentration of several amino acids was changed as a result of dietary protein restriction; most notable were serine and glycine, which were markedly higher in the LP group (serine, LP 526.9 ± 45.9; NP 224.8 ± 33.5 μmol/liter, p = 0.001; glycine, LP 568.5 ± 60.9; NP 291.8 ± 7.57 μmol/liter, p = 0.007). In addition, plasma concentrations of citrulline and ornithine were also higher in the LP group (p = 0.06). The plasma concentration of taurine was not different among the two groups.
FIGURE 4.
Amino acid levels in plasma. Amino acid levels in the plasma of rats fed either a low protein (dark bars) or a normal protein (light bars) diet. Data are mean ± S.E. The amino acids are abbreviated as follows: ASP A, aspartic acid; GLU A, glutamic acid; ASN, asparagine; SER, serine; GLN, glutamine; GLY, glycine; HIST, histidine; THR, threonine; CIT, citrulline; ALA, alanine; TAUR, taurine; ARG, arginine; TYR, tyrosine; ABA, aminobutyric acid; METH, methionine; VAL, valine; TRY, tryptophan; PHE, phenylalanine; ISO, isoleucine; LEU, leucine; ORN, ornithine; LYS, lysine. *, p = 0.001; §, p = 0.007.
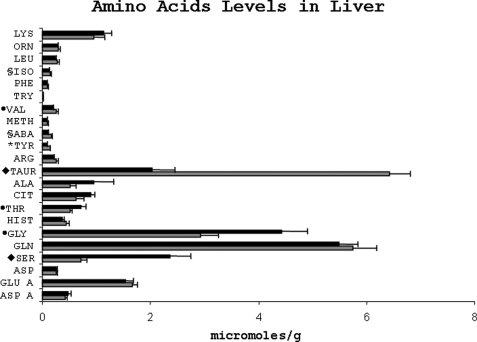
Free serine and glycine concentrations in the liver were significantly higher (serine p = 0.002 and glycine p = 0.014), although free taurine concentration was markedly lower (p = 0.000) in the protein-restricted animals compared with the NP animals (Fig. 5). The hepatic concentrations of free tyrosine, valine, and isoleucine were also significantly lower in the LP animals. Hepatic total cysteine concentration was significantly lower in the LP group as compared with the NP group (LP, 1.66 ± 0.15; NP, 2.15 ± 0.08 mmol/liter; p = 0.004).
FIGURE 5.
Amino acid levels in the livers of rats fed either a low protein (dark bars) or a normal protein (light bars) diet. The amino acids are abbreviated as in Fig. 4. To maintain the scale of the graph, all values for amino acid are divided by 10. *, p < 0.01; §, p < 0.05; ●, p < 0.02; ♦, p < 0.002.
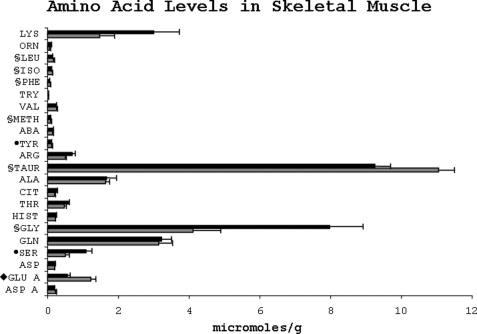
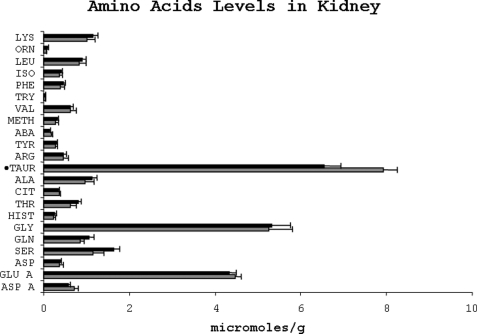
The free amino acid concentration in the skeletal muscle was markedly affected by dietary protein restriction (Fig. 6). The levels of essential amino acids, leucine, isoleucine, methionine, and phenylalanine, were significantly lower in the protein-restricted animals. Among nonessential amino acids, the concentrations of serine and glycine were significantly higher (p < 0.05), although that of tyrosine and glutamic acid was significantly lower in the LP group. In addition, skeletal muscle concentration of free taurine was lower in the LP group. There was no significant change in the concentration of free amino acids in the kidney as a result of dietary protein restriction except for taurine, which was significantly lower (p = 0.01), and serine, which was higher (p = 0.057) in the LP group (Fig. 7).
FIGURE 6.
Amino acid levels in skeletal muscle of rats fed either a low protein (dark bars) or a normal protein (light bars) diet. The amino acids are abbreviated as in Fig. 4. To maintain the scale of the graph, all values for amino acid are divided by 10. §, p < 0.05; ●, p < 0.025; ♦, p < 0.001.
FIGURE 7.
Amino acid levels in the kidney of rats fed either a low protein (dark bars) or normal protein (light bars) diet. The amino acids are abbreviated as in Fig. 4. ●, p < 0.01.
Plasma Cysteine, Homocysteine, and Glutathione
The concentration of total cysteine, homocysteine, and glutathione in the peripheral plasma was unchanged as a result of dietary protein restriction (Table 1). There was no change in the portal venous plasma concentration of cysteine, homocysteine, and glutathione.
TABLE 1.
Plasma cysteine, homocysteine, and glutathione
Means ± S.E. No significant difference between groups was noted. Number in parentheses indicates number of animals.
| Cysteine | Homocysteine | Glutathione | |
|---|---|---|---|
| μmol·liter−1 | μmol·liter−1 | μmol·liter−1 | |
| LP | 287 ± 13.64 (11) | 4.1 ± 0.43 (11) | 24.9 ± 3.17 (8) |
| NP | 298 ± 13.73 (8) | 5.1 ± 0.77 (8) | 16.8 ± 1.42 (5) |
Amino Acid Kinetics
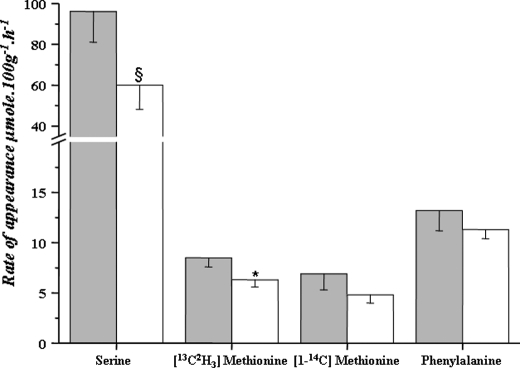
We quantified the rate of appearance of serine, phenylalanine, and methionine during isotopic steady state in resting, awake animals. As shown in Fig. 8, the whole body serine rate of appearance was markedly higher in the protein-restricted animals (p = 0.06). The contribution of serine to the glycine pool was 19.7% (±0.02) in the LP group and 25% (±0.06) in the NP group (p = not significant).
FIGURE 8.
Effect of dietary protein restriction on whole body amino acid kinetics in rats. Whole body rate of appearance of serine, methionine, and phenylalanine were measured in awake resting rats. The rate of appearance of methionine was measured using [13C,2H3]methionine and [1-14C]methionine tracers. *, p = 0.03; §, p = 0.06 compared with normal protein group. LP, dark bar; NP, clear bar.
Whole body rate of protein turnover measured by the rate of appearance of phenylalanine and methionine ([1-14C]methionine tracer) was not statistically different between the LP and NP groups. Methionine rate of appearance, measured using the 13C,2H3 tracer, was significantly higher in the protein-restricted animals (LP 8.48 ± 0.9 and NP 6.33 ± 0.65 μmol·100 g−1·h−1, p = 0.03) suggesting a higher rate of transmethylation of methionine. The fractional rate of oxidation of methionine (trans-sulfuration) was not different among the LP and NP groups (LP 0.11 ± 0.01, NP 0.20 ± 0.06, p = not significant). The total rate of trans-sulfuration (rate of appearance of [1-14C]methionine·fractional rate of oxidation) was also not different between LP and NP groups.
Hepatic Methionine Metabolism
The concentrations of AdoMet, AdoHcy, and their ratio (AdoMet/AdoHcy) are shown in Table 2. Dietary protein restriction resulted in a significant (p < 0.002) lowering of hepatic AdoHcy levels, although AdoMet levels were not different when compared with the normal protein group. Consequently, the AdoMet/AdoHcy ratio in the liver was significantly higher (p < 0.02) in the LP group, suggesting a higher hepatic methylation potential in these animals. However, there was no significant difference in the total hepatic genomic methylation between the two groups (data not shown). There was no significant change in the concentration of AdoMet, AdoHcy, or AdoMet/AdoHcy ratio in the kidney or skeletal muscle (data not shown).
TABLE 2.
Effect of low protein diet on AdoHcy and SAM in rat tissues
Mean ± S.E. Number in parentheses indicates number of animals.
| AdoMet |
AdoHcy |
AdoMet/AdoHcy |
||||
|---|---|---|---|---|---|---|
| LP (13) | NP (7) | LP (13) | NP (8) | LP (13) | NP (8) | |
| nmol·g−1wet weight | nmol·g−1wet weight | ratio | ||||
| Liver | 74.5 ± 5.69 | 83.9 ± 9.91 | 15.7 ± 1.39a | 24.4 ± 1.98 | 5.2 ± 0.43b | 3.5 ± 0.40 |
| Kidney | 47.0 ± 5.81 | 42.7 ± 5.11 | 13.9 ± 2.39 | 12.7 ± 1.50 | 3.4 ± 0.51 | 3.8 ± 0.74 |
| Muscle | 28.9 ± 2.36 | 25.9 ± 3.70 | 1.4 ± 0.18 | 1.7 ± 0.19 | 23.7 ± 2.81 | 16.6 ± 2.47 |
a p < 0.002.
b p < 0.02 compared with NP group.
We quantified the activities of key enzymes involved in methionine metabolism in the liver. As reported by others (34, 35), dietary protein restriction resulted in a significant decrease in the activity of cystathionine β-synthase and cystathionine γ-lyase (Table 3). The lower activity of cystathionine γ-lyase was evident when the activity was measured by two independent methods. There was no significant change in the activity of glycine N-methyltransferase nor that of methionine synthase.
TABLE 3.
Effect of low protein diet on hepatic enzyme activity
Mean ± S.E. All data are μmol·mg protein−1·h−1.
| LP | NP | |
|---|---|---|
| Cystathionine γ-lyase | ||
| Cysteine → pyruvate → lactate | 0.433 ± 0.02a (10) | 0.618 ± 0.04 (5) |
| Cystathionine → cysteine | 0.82 ± 0.09b (13) | 1.07 ± 0.03 (8) |
| Cystathionine β-synthase | 0.292 ± 0.01 (10) | 0.461 ± 0.06 (7) |
| Glycine N-methyltransferase | ||
| AdoMet + glycine → sarcopine | 1.770 ± 0.10 (11) | 1.964 ±0.11 (5) |
| Methionine synthase | 34.93 ± 4.13 (7) | 25.87 ± 3.75 (4) |
a LP versus NP, p < 0.001 two-tailed t test.
b LP versus NP, p < 0.02.
Gluconeogenesis and Serine Biosynthesis
Cytosolic phosphoenolpyruvate carboxykinase is a key cataplerotic enzyme in the rodent liver (36). It regulates the efflux of citric acid cycle anions from the TCA cycle toward the gluconeogenic pathways. Because serine is synthesized from the gluconeogenic/glycolytic intermediate, 3-phosphoglycerate, we examined the effect of dietary protein restriction on the expression and activity of PEPCK-C and on the contribution of pyruvate to glucose and serine. Dietary protein restriction did not have any significant effect on PEPCK-C mRNA, protein, or activity (data not shown). The rate of appearance of glucose, measured by [6,6-2H2]glucose tracer dilution, was not different in the two groups (LP, 4.7 ± 0.56; NP, 5.2 ± 0.53 μmol·100 g−1·min−1; see Table 4). The fraction of glucose rate of appearance contributed by pyruvate, measured by 2H incorporation of body water in C-6 of glucose, was also unchanged (LP, 35.8 ± 5.7%; NP, 40.6 ± 6.4%, p = not significant). In contrast, the fraction of serine rate of appearance derived from pyruvate was significantly higher in the protein-restricted group (LP, 92.4 ± 3.5%; NP, 69.5 ± 4.1%, p = 0.004). Pyruvate was the predominant contributor to serine synthesis in both the LP and NP groups, even in the presence of a higher rate of appearance of serine in the LP group.
TABLE 4.
Glucose kinetics and contribution of pyruvate to glucose and serine
Ra glucose means rate of appearance of glucose.
| Ra glucose |
2H enrichment |
Glucose from pyruvate | Serine from pyruvate | |||
|---|---|---|---|---|---|---|
| Plasma | Glucose C-6 | Serine m3 | ||||
| μmol·100 g−1·min−1 | % | % | % | % | % | |
| LP | 5.0 ± 0.5 | 0.37 ± 0.01 | 0.28 ± 0.01 | 0.78 ± 0.06 | 40.6 ± 6.4 | 69.5 ± 4.1 |
| NP | 4.7 ± 0.6 | 0.31 ± 0.01 | 0.22 ± 0.04 | 0.86 ± 0.03 | 35.9 ± 0.6 | 92.9 ± 3.5a |
a p = 0.004, LP versus NP.
DISCUSSION
Our data show that isocaloric restriction of dietary protein in rat causes the following: 1) marked changes in expression patterns of a large number of genes in the liver; 2) perturbations in the amino acid pattern in plasma and tissues, particularly serine and glycine; 3) a marked decrease in free taurine in the liver and skeletal muscle; 4) changes in hepatic methionine metabolism; and 5) an increase in serine synthesis. The exact mechanism(s) that mediate these responses to dietary protein restriction will require further study.
A few aspects of our studies should be underscored. 1) The animals were pair-fed, so that any impact of a decrease in total energy intake was the same for both groups of rats. 2) We used a casein-based diet for both groups, because the quality of protein by itself has been shown to impact whole body metabolism (37). 3) Our data are not directly comparable with studies where the response to diets made of amino acid mixtures are examined, because those studies did not require digestion of ingested proteins and therefore may not impact the gastrointestinal hormones. These data are not comparable with other studies of so-called “amino acid starvation” in vivo or in vitro, because total deficiency of protein/amino acid will evoke acute proteolytic responses not seen in the present model (12). 4) Because the cysteine content of casein is low (0.5%), even though methionine was added to the protein-restricted diet, the available cysteine to the LP group may have been low. 5) We examined the animals at 7–10 days of protein restriction, and therefore we did not determine the acute responses. In this context, our study may invoke early adaptation to the diet, which may be quite different after prolonged (weeks) duration of protein restriction.
Amino Acids
The striking feature of the changes in plasma and tissue concentration of amino acids was the increase in the concentration of serine and glycine and the decrease in taurine concentration in the protein-restricted group. Although these changes were seen in all compartments, they were most marked in the liver. The higher concentrations of serine were associated with evidence of an increase in its biosynthesis (discussed below). Both serine and glycine are the key components of one-carbon metabolism, as methyl donors for the de novo synthesis of purine nucleotide, as precursors for cell proliferation, and as the carbon source for other amino acids (i.e. cysteine and taurine), and for lipid molecules such as phosphatidylserine and ceramides (38). A high concentration of these amino acids may reflect a high demand for any of these processes. A similar increase in the serine concentration in plasma and liver was reported by Nagao et al. (39) in rats placed on lysine- or valine-free diets and by Adibi et al. (40) in rats placed on protein-free diets. Thus, high serine levels may be a basic response to protein or amino acid restriction and a consequent high demand for serine for many metabolic processes.
The large magnitude of change in the free amino acids in the liver suggests that liver plays a primary role in adaptation to dietary protein restriction. The changes in free amino acids in skeletal muscle, i.e. lower essential amino acids, suggest a lower rate of protein turnover, an adaptive response aimed at conserving body proteins. The observed changes in plasma and skeletal muscle amino acids levels are somewhat similar to those seen following prolonged (30 days) total starvation in humans (41). However, the animals in this study were not restricted in energy intake, and the lower amount of protein in the diet was substituted with equivalent carbohydrate energy. The non-protein energy intake may have inhibited the proteolytic responses usually seen with acute starvation (41).
There was a significant decrease in total hepatic cysteine levels in the protein-restricted group. The lower levels may be related to the lower activity of the enzymes of the trans-sulfuration pathway, although there was no significant change in the trans-sulfuration flux during fasting. We did not observe any difference in total homocysteine concentration in the plasma as a result of protein restriction. This is in contrast to the data from studies in humans showing a negative correlation between protein malnutrition, assessed by plasma transthyretin levels, and the total concentration of homocysteine in the plasma (42). The lack of change in total homocysteine may be related to the short duration of the study and to the higher rate of transmethylation of methionine (43). The lower plasma glutathione levels in the LP group likely reflect the lower hepatic concentration of glutathione in this group.
Whole Body Protein and Nitrogen Metabolism
Protein restriction in healthy humans has been shown to cause a decrease in whole body protein turnover (leucine rate of appearance) and a decrease in protein/leucine oxidation (6, 44) and a lower rate of oxidation of leucine in rats (46). Specifically in relation to the liver, a decrease in protein intake to 0.6 g/(kg·body weight) for 7 days caused a significant decrease in nutrient transport protein and an increased formation of acute phase protein, suggesting that a low grade inflammatory response was associated with an increased plasma concentration of proinflammatory cytokine interleukin 6 (47). In contrast to these data, we did not observe any significant change in the whole body rate of protein turnover (phenylalanine and [1-14C]methionine rate of appearance). This may be related to difference in the isotopic tracer used (leucine versus phenylalanine), the relative contribution of liver versus skeletal muscle to the kinetic measurement, or may simply be due to species difference and the small sample size of our study. The lower levels of free essential amino acids in the skeletal muscle suggest a lower rate of protein breakdown in the muscle caused by the protein restriction. An overall attempt to conserve body nitrogen was evidenced by the lower level of RNA for the urea cycle enzymes in the liver (Fig. 3).
Hepatic Methionine Metabolism
Dietary restriction of protein resulted in a higher rate of transmethylation of methionine, higher methylation potential (higher AdoMet/AdoHcy ratio) (48), lower activity of cystathionine β-synthase and cystathionine γ-lyase, as well as a higher level of expression of cysteinesulfinic acid decarboxylase and glutamate-cysteine ligase. These changes were associated with lower hepatic cysteine and taurine levels and no alteration in the concentration of homocysteine and glutathione. The higher rate of transmethylation may be related to increased methylation demands as a result of a high level of cell cycle activity and other processes suggested by the alterations in the level of RNA noted in the gene array data. The lower activity of the enzymes of the trans-sulfuration pathway in the LP group would conserve the methionine/homocysteine carbons to sustain the high activity of methionine cycle and may be part of a general mechanism to conserve body nitrogen. The mechanism or the molecular signal responsible for these changes remain to be determined.
Taurine Homeostasis
There was a marked decrease in the intracellular concentration of taurine and a small increase in the levels of taurine in the plasma of the protein-restricted animals. The dramatically lower concentration of taurine in the liver may be related to the lower availability of cysteine as a result of protein restriction (with low (0.5%) concentration of cysteine in casein) or lower levels of total cysteine in the liver or to a lower rate of synthesis of cysteine due to down-regulation of the trans-sulfuration pathway. However, tracer isotope measured trans-sulfuration was not reduced in the LP group. In addition, as reported previously by other investigators (14), the expression of the gene coding for the enzyme involved in the synthesis of taurine, cysteinesulfinic acid decarboxylase, was up-regulated in the LP group. Thus, the lower concentration of free taurine in the LP group could not be attributed to a lower rate of taurine synthesis. Taurine is a major intracellular osmolyte and is present at relatively high concentrations (e.g. 7–8 mm in the liver) in some mammalian tissue (49). The markedly lower levels of taurine in the liver may be due to taurine efflux as a result of change in extracellular osmolarity, activation of phospholipase A2 pathway, or high levels of reactive oxygen species or may be hormonally mediated (50, 51). Changes in intracellular osmolarity have been related to the expression of certain genes and to perturbations in several metabolic processes (52, 53).
Serine Homeostasis
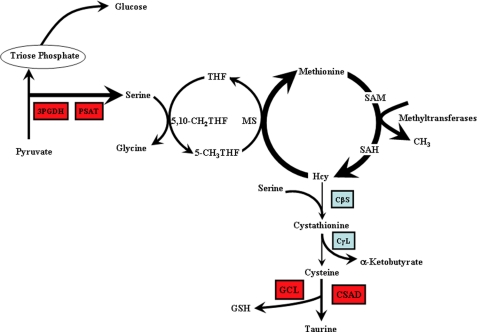
Dietary restriction of protein resulted in a higher expression of key enzymes involved in serine biosynthesis in the liver, in a marked increase in plasma and tissue concentration of serine, and an ∼50% increase in the rate of appearance of serine (Fig. 8). Because serine and phenylalanine constitute a similar proportion of animal protein, the serine rate of appearance from protein breakdown will approximate the phenylalanine rate of appearance. Therefore, the difference between the serine and the phenylalanine rate of appearance (∼45 μmol·100 g−1·h−1) in the NP group, representing the majority of serine rate of appearance, is a measure of the de novo synthesis of serine, probably in the kidney (54, 55). In addition, pyruvate provided almost all the carbon source (70% of the serine rate of appearance (∼60 μmol·100 g−1·h−1) = 42 μmol·100 g−1·h−1). Protein restriction did not have any measurable impact on the rate of whole body protein breakdown (phenylalanine and methionine rates of appearance). Therefore the increase in serine rate of appearance in the LP group can be entirely attributed to a higher rate of de novo synthesis, most likely by the liver, because of the higher expression of enzymes involved in serine biosynthesis and the very high concentration of serine in that tissue. Tracer isotope studies using [2H2]O suggest that almost the entire carbon source for de novo serine synthesis in the LP group (serine minus phenylalanine rate of appearance, ∼96–13 = 83 μmol·100 g−1·h−1) was pyruvate (serine rate of appearance (96%) × serine from pyruvate (93%) = 89 μmol·100 g−1·h−1), although the site of de novo synthesis (kidney versus liver) depends upon nutritional state of the animal. The relative flux of pyruvate carbon to serine represented only ∼5% of the carbon flow to glucose (gluconeogenesis). Serine is formed from pyruvate by an abbreviated version of gluconeogenesis that provides 3-phosphoglycerate, which is then oxidized to 3-phosphohydroxypyruvate and subsequently to serine (38).
Serine is primarily synthesized in the renal cortex and released into the blood (54, 55). Under normal conditions, serine is not synthesized by the liver in rodents because the activity of the key enzyme in its biosynthetic pathway, 3-phosphoglycerate dehydrogenase (3PGDH), is absent or negligible (56). Dietary protein restriction caused an 8-fold induction of the RNA for 3PGDH and a 3-fold increase in phosphoserine aminotransferase, both of which support the hepatic synthesis of serine. Total amino acid deficiency in vitro and cysteine deficiency in vivo have been shown to induce the transcription of the gene for 3PGDH (56). Although hepatic cysteine levels were lower in the LP group, the magnitude of decrease does not appear to be sufficient to cause an induction of 3PGDH. We propose that the induction of 3PGDH gene transcription is mediated by transcriptional factors such as SP1 and NFy as a component of a global stress response (45, 57–59). Finally, the increase in serine flux was much greater than the decrease in methionine trans-sulfuration pathway, suggesting that the elevated serine levels were primarily the result of increased de novo synthesis rather than a decrease in the utilization of serine for cysteine and taurine production.
Serine plays an important role in cell growth and development by providing precursors for the synthesis of pyrimidine nucleotide and for deoxythymidine monophosphate. In addition, serine is the precursor for cysteine and taurine and for lipid messenger molecules such as phosphatidylserine and ceramide and neuromodulators glycine and d-serine. The markedly increased synthesis of serine in the LP group may be related to a heightened demand for all these metabolic processes.
Source of Carbon for the Synthesis of Serine
It is generally believed that glucose provides the 3-phosphoglycerate for the synthesis of serine via glycolysis. Our study provides the first evidence that serine is synthesized largely from pyruvate. This greatly broadens the potential sources of carbon for serine synthesis, because the carbon skeletons of several amino acids can enter the citric acid cycle and then be converted to phosphoenolpyruvate via PEPCK as part of a process of cataplerosis (Fig. 9). Thus gluconeogenesis, glyceroneogenesis, and serine synthesis share a common portion of the same pathway, which has been traditionally associated solely with gluconeogenesis. We now view PEPCK as a conduit for carbon flow from the citric acid cycle, a process that is critical for the functioning of the cycle (36). The synthesis of serine now joins the well studied pathways mentioned above as important cataplerotic routes that involve PEPCK. This enzyme converts the citric acid cycle anion oxalacetate to phosphoenolpyruvate, which is the starting point for several pathways that dispose of the carbon, either by biosynthesis of new compounds (i.e. glycerol, glucose, or serine) or result in the oxidation by its conversion to pyruvate via pyruvate kinase and then to acetyl-CoA in the mitochondria. The pathway offers impressive metabolic flexibility in the determining the appropriate fate of citric acid cycle intermediates.
FIGURE 9.
Effect of dietary protein restriction on hepatic one-carbon metabolism in the rat. Shown are the substrate fluxes that were increased (thick arrows) as well as the differentially regulated enzymes. Red up and blue down. SAM, AdoMet; CβL, cystathionine β-synthase; CγS, cystathionine γ-lyase; THF, tetrahydrofolate; CSAD, cysteinesulfinic acid decarboxylase; GCL, glutamate-cysteine ligase.
Our data show that the major metabolic impact of protein restriction was a marked decrease in intracellular free taurine concentration and possibly a decrease in intracellular osmolarity. This was associated with a marked change in hepatic one-carbon metabolism, including a high rate of serine synthesis, a higher rate of transmethylation, and a high methylation potential. Even though the activity of the enzymes of the trans-sulfuration pathway was decreased in the LP group, tracer isotope studies did not show significant change in the flux over this pathway. These changes in metabolism were accompanied by differential expression of a number of genes involved in transcription and the cell cycle. Although the exact mechanism of these responses remains to be investigated, our data suggest that these may be mediated in part by changes in cellular osmolarity. Whether a change in osmolarity is the initiating event remains to be investigated. These data have broad biochemical, physiological, and clinical implications because of the known consequences of dietary protein restriction on epigenetic changes during development and for their overall implication for public health in societies where marginal protein intake is common.
Supplementary Material
Acknowledgment
We thank Joyce Nolan for secretarial assistance.
This work was supported, in whole or in part, by National Institutes of Health Grants DK079937 (to S. C. K.) and DK58620 (to R. W. H.). This work was also supported by institutional support (to S. C. K.) from the Cleveland Clinic Foundation.

The on-line version of this article (available at http://www.jbc.org) contains supplemental Tables 1–4.
- LP
- low protein
- NP
- normal protein
- AdoMet
- S-adenosylmethionine
- AdoHcy
- S-adenosylhomocysteine
- PEPCK
- phosphoenolpyruvate carboxykinase
- 3PDGH
- 3-phosphoglycerate dehydrogenase.
REFERENCES
- 1. Bateson P., Barker D., Clutton-Brock T., Deb D., D'Udine B., Foley R. A., Gluckman P., Godfrey K., Kirkwood T., Lahr M. M., McNamara J., Metcalfe N. B., Monaghan P., Spencer H. G., Sultan S. E. (2004) Nature 430, 419–421 [DOI] [PubMed] [Google Scholar]
- 2. Warner M. J., Ozanne S. E. (2010) Biochem. J. 427, 333–347 [DOI] [PubMed] [Google Scholar]
- 3. Rao S., Kanade A., Margetts B. M., Yajnik C. S., Lubree H., Rege S., Desai B., Jackson A., Fall C. H. (2003) Eur. J. Clin. Nutr. 57, 531–542 [DOI] [PMC free article] [PubMed] [Google Scholar]
- 4. Afolabi P. R., Jahoor F., Gibson N. R., Jackson A. A. (2004) Am. J. Physiol. Endocrinol. Metab. 287, E327–E330 [DOI] [PubMed] [Google Scholar]
- 5. Jackson A. A., Phillips G., McClelland I., Jahoor F. (2001) Am. J. Physiol. Gastrointest. Liver Physiol. 281, G1179–G1187 [DOI] [PubMed] [Google Scholar]
- 6. Gaine P. C., Pikosky M. A., Martin W. F., Bolster D. R., Maresh C. M., Rodriguez N. R. (2006) Metabolism 55, 501–507 [DOI] [PubMed] [Google Scholar]
- 7. Larivière F., Kupranycz D. B., Chiasson J. L., Hoffer L. J. (1992) Am. J. Physiol. 263, E173–E179 [DOI] [PubMed] [Google Scholar]
- 8. Reynolds R. M., Godfrey K. M., Barker M., Osmond C., Phillips D. I. (2007) J. Clin. Endocrinol. Metab. 92, 2208–2210 [DOI] [PubMed] [Google Scholar]
- 9. Ozanne S. E. (1999) Biochem. Soc. Trans. 27, 94–97 [DOI] [PubMed] [Google Scholar]
- 10. Chen J. H., Martin-Gronert M. S., Tarry-Adkins J., Ozanne S. E. (2009) PLos. ONE 4, e4950. [DOI] [PMC free article] [PubMed] [Google Scholar]
- 11. Fernandez-Twinn D. S., Wayman A., Ekizoglou S., Martin M. S., Hales C. N., Ozanne S. E. (2005) Am. J. Physiol. Regul. Integr. Comp. Physiol. 288, R368–R373 [DOI] [PubMed] [Google Scholar]
- 12. Kilberg M. S., Pan Y. X., Chen H., Leung-Pineda V. (2005) Annu. Rev. Nutr. 25, 59–85 [DOI] [PMC free article] [PubMed] [Google Scholar]
- 13. Courtney-Martin G., Rafii M., Wykes L. J., Ball R. O., Pencharz P. B. (2008) J. Nutr. 138, 2172–2178 [DOI] [PubMed] [Google Scholar]
- 14. Stipanuk M. H., Dominy J. E., Jr., Lee J. I., Coloso R. M. (2006) J. Nutr. 136, 1652S–1659S [DOI] [PubMed] [Google Scholar]
- 15. Parimi P. S., Cripe-Mamie C., Kalhan S. C. (2004) Pediatr. Res. 56, 423–431 [DOI] [PubMed] [Google Scholar]
- 16. Glamour T. S., McCullough A. J., Sauer P. J., Kalhan S. C. (1995) Am. J. Physiol. 268, E789–E796 [DOI] [PubMed] [Google Scholar]
- 17. Kalhan S. C., Parimi P., Van Beek R., Gilfillan C., Saker F., Gruca L., Sauer P. J. J. (2001) Am. J. Physiol. Endocrinol. Metab. 281, E991–E997 [DOI] [PubMed] [Google Scholar]
- 18. Landau B. R., Wahren J., Chandramouli V., Schumann W. C., Ekberg K., Kalhan S. C. (1995) J. Clin. Invest. 95, 172–178 [DOI] [PMC free article] [PubMed] [Google Scholar]
- 19. Dasarathy J., Gruca L. L., Bennett C., Parimi P. S., Duenas C., Marczewski S., Fierro J. L., Kalhan S. C. (2010) Am. J. Clin. Nutr. 91, 357–365 [DOI] [PMC free article] [PubMed] [Google Scholar]
- 20. Kalhan S. C., Gruca L. L., Parimi P. S., O'Brien A., Dierker L., Burkett E. (2003) Am. J. Physiol. Endocrinol. Metab. 284, E733–E740 [DOI] [PubMed] [Google Scholar]
- 21. Kalhan S. C., Trivedi R., Singh S., Chandramouli V., Schumann W. C., Landau B. R. (1995) J. Mass Spectrom. 30, 1588–1592 [Google Scholar]
- 22. Dasarathy S., Muc S., Hisamuddin K., Edmison J. M., Dodig M., McCullough A. J., Kalhan S. C. (2007) Am. J. Physiol. Gastrointest. Liver Physiol. 292, G1105–G1113 [DOI] [PubMed] [Google Scholar]
- 23. Pfaffl M. W. (2001) Nucleic Acids Res. 29, e45. [DOI] [PMC free article] [PubMed] [Google Scholar]
- 24. Merali S., Vargas D., Franklin M., Clarkson A. B., Jr. (2000) J. Biol. Chem. 275, 14958–14963 [DOI] [PubMed] [Google Scholar]
- 25. Garcia A. J., Apitz-Castro R. (2002) J. Chromatogr. B 779, 359–363 [DOI] [PubMed] [Google Scholar]
- 26. Stipanuk M. H. (1979) J. Nutr. 109, 2126–2139 [DOI] [PubMed] [Google Scholar]
- 27. Rowling M. J., McMullen M. H., Chipman D. C., Schalinske K. L. (2002) J. Nutr. 132, 2545–2550 [DOI] [PubMed] [Google Scholar]
- 28. Frasca V., Banerjee R. V., Dunham W. R., Sands R. H., Matthews R. G. (1988) Biochemistry 27, 8458–8465 [DOI] [PubMed] [Google Scholar]
- 29. Heinonen K. (1973) Biochem. J. 136, 1011–1015 [DOI] [PMC free article] [PubMed] [Google Scholar]
- 30. Mudd S. H., Finkelstein J. D., Irreverre F., Laster L. (1965) J. Biol. Chem. 240, 4382–4392 [PubMed] [Google Scholar]
- 31. Parimi P. S., Croniger C. M., Leahy P., Hanson R. W., Kalhan S. C. (2003) Pediatr. Res. 53, 325–332 [DOI] [PubMed] [Google Scholar]
- 32. Ballard F. J., Hanson R. W. (1967) Biochem. J. 102, 952–958 [DOI] [PMC free article] [PubMed] [Google Scholar]
- 33. Kalhan S. C., Rossi K. Q., Gruca L. L., Super D. M., Savin S. M. (1998) Am. J. Physiol. 275, E423–E431 [DOI] [PubMed] [Google Scholar]
- 34. Yamamoto N., Tanaka T., Noguchi T. (1996) J. Nutr. Sci. Vitaminol. 42, 589–593 [DOI] [PubMed] [Google Scholar]
- 35. Ohuchi S., Morita T., Mori M., Sugiyama K. (2009) J. Nutr. Sci. Vitaminol. 55, 178–185 [DOI] [PubMed] [Google Scholar]
- 36. Yang J., Kalhan S. C., Hanson R. W. (2009) J. Biol. Chem. 284, 27025–27029 [DOI] [PMC free article] [PubMed] [Google Scholar]
- 37. Hall W. L., Millward D. J., Long S. J., Morgan L. M. (2003) Br. J. Nutr. 89, 239–248 [DOI] [PubMed] [Google Scholar]
- 38. de Koning T. J., Snell K., Duran M., Berger R., Poll-The B. T., Surtees R. (2003) Biochem. J. 371, 653–661 [DOI] [PMC free article] [PubMed] [Google Scholar]
- 39. Nagao K., Bannai M., Seki S., Mori M., Takahashi M. (2009) Amino Acids 36, 555–562 [DOI] [PubMed] [Google Scholar]
- 40. Adibi S. A., Modesto T. A., Morse E. L., Amin P. M. (1973) Am. J. Physiol. 225, 408–414 [DOI] [PubMed] [Google Scholar]
- 41. Felig P., Owen O. E., Wahren J., Cahill G. F., Jr. (1969) J. Clin. Invest. 48, 584–594 [DOI] [PMC free article] [PubMed] [Google Scholar]
- 42. Ingenbleek Y., Hardillier E., Jung L. (2002) Nutrition 18, 40–46 [DOI] [PubMed] [Google Scholar]
- 43. Finkelstein J. D., Martin J. J. (1984) J. Biol. Chem. 259, 9508–9513 [PubMed] [Google Scholar]
- 44. Larivière F., Chiasson J. L., Schiffrin A., Taveroff A., Hoffer L. J. (1994) Metabolism 43, 462–467 [DOI] [PubMed] [Google Scholar]
- 45. Mitoma J., Furuya S., Shimizu M., Shinoda Y., Yoshida K., Azuma N., Takana H., Suzuki Y., Hirabayashi Y. (2004) Gene 445, 15–22 [DOI] [PubMed] [Google Scholar]
- 46. Sketcher R. D., James W. P. (1974) Br. J. Nutr. 32, 615–623 [DOI] [PubMed] [Google Scholar]
- 47. Ling P. R., Smith R. J., Kie S., Boyce P., Bistrian B. R. (2004) Am. J. Physiol. Regul. Integr. Comp. Physiol. 287, R801–R808 [DOI] [PubMed] [Google Scholar]
- 48. Fux R., Kloor D., Hermes M., Röck T., Proksch B., Grenz A., Delabar U., Bücheler R., Igel S., Mörike K., Gleiter C. H., Osswald H. (2005) Am. J. Physiol. Renal Physiol. 289, F786–F792 [DOI] [PubMed] [Google Scholar]
- 49. Huxtable R. J. (1992) Physiol. Rev. 72, 101–163 [DOI] [PubMed] [Google Scholar]
- 50. Lambert I. H. (2004) Neurochem. Res. 29, 27–63 [DOI] [PubMed] [Google Scholar]
- 51. Lambert I. H., Pedersen S. F., Poulsen K. A. (2006) Acta Physiol. (Oxf). 187, 75–85 [DOI] [PubMed] [Google Scholar]
- 52. Häussinger D. (1996) Biochem. J. 313, 697–710 [DOI] [PMC free article] [PubMed] [Google Scholar]
- 53. Kang J., Holland M., Jones H., Kaysen G. A. (1999) Kidney Int. 56, 452–460 [DOI] [PubMed] [Google Scholar]
- 54. Brosnan J. T., Hall B. (1989) Can. J. Physiol. Pharmacol. 67, 1058–1061 [DOI] [PubMed] [Google Scholar]
- 55. van de Poll M. C., Soeters P. B., Deutz N. E., Fearon K. C., Dejong C. H. (2004) Am. J. Clin. Nutr. 79, 185–197 [DOI] [PubMed] [Google Scholar]
- 56. Achouri Y., Robbi M., Van Schaftingen E. (1999) Biochem. J. 344, 15–21 [PMC free article] [PubMed] [Google Scholar]
- 57. Noguchi Y., Shikata N., Furuhata Y., Kimura T., Takahashi M. (2008) Physiol. Genomics 34, 315–326 [DOI] [PubMed] [Google Scholar]
- 58. Shan J., Lopez M. C., Baker H. V., Kilberg M. S. (2010) Physiol. Genomics, in press [DOI] [PMC free article] [PubMed] [Google Scholar]
- 59. Jun D. Y., Park H. S., Lee J. Y., Baek J. Y., Park H. K., Fukui K., Kim Y. H. (2008) Gene 414, 106–114 [DOI] [PubMed] [Google Scholar]
Associated Data
This section collects any data citations, data availability statements, or supplementary materials included in this article.


