

Abstract
Elevated homocysteine (Hcys) serum levels represent a risk factor for several chronic pathologies, including cardiovascular disease, atherosclerosis, and chronic renal failure, and affect bone development, quality, and homeostasis. Hcys influences the formation of a stable bone matrix directly through the inhibition of the collagen cross-linking enzyme lysyl oxidase (Lox) and, as we have shown recently, by repressing its mRNA expression. The aim of this study was to investigate the mechanisms involved in this process. Through evaluation of gene arrays, quantitative RT-PCR, immunoblots, and ELISA, we identified a Hcys-dependent stimulation of interleukin 6 (IL-6) and genes involved in IL-6/Janus kinase 2 (JAK2)-dependent signal transduction pathways in pre-osteoblastic MC3T3-E1 cells. Moreover, up-regulation of genes essential for epigenetic DNA methylation (DNA (cytosine-5)-methyltransferases and helicase lymphoid-specific (Hells) was observed. Further investigations demonstrated that Hcys increased via IL-6/JAK2 the expression of Fli1 (Friend leukemia virus integration 1), a transcription factor, which we found essential for IL-6-dependent Dnmt1 stimulation. CpG methylation analysis of CpG-rich Lox proximal promoter revealed an increased CpG methylation status after treatment of the cells with Hcys indicating an epigenetic origin for Hcys-dependent Lox repression. Inhibition of the IL-6/JAK2 pathway or of CpG methylation reversed the repressive effect of Hcys on Lox expression. In conclusion, we demonstrate that Hcys stimulates IL-6 synthesis in osteoblasts, which is known to affect bone metabolism via osteoclasts. Furthermore, IL-6 stimulation results via JAK2, Fli1, and Dnmt1 in down-regulation of Lox expression by epigenetic CpG methylation revealing a new mechanism negatively affecting bone matrix formation.
Keywords: Bone, DNA Methylation, DNA Methyltransferase, Epigenetics, Homocysteine, Signal Transduction, Fli1, Interleukin-6, Osteoblasts
Introduction
Epidemiological studies have shown that high homocysteine (Hcys)2 serum levels represent a risk factor for several chronic disorders such as cardiovascular disease, atherosclerosis, chronic renal failure, diabetes, or the metabolic syndrome (1, 2). Moreover, hyperhomocysteinemia is known to affect bone development and homeostasis (3–6). Hcys has been shown to interfere with post-translational modifications of collagen directly by inhibiting lysyl oxidase (Lox) (7) and indirectly by down-regulation of its mRNA expression and of other genes involved in collagen cross-linking. Enzymatic inhibition or mRNA down-regulation of Lox results in changes in collagen cross-linking pattern in vitro (8–10) and in vivo resulting in decreased bone quality (11–13). In this context, we have recently reported a correlation between plasma Hcys levels and a collagen cross-link ratio in forming trabecular surfaces in human bone (14).
Lysyl oxidase was also identified as a phenotypic suppressor of the ras oncogene in H-ras-transformed NIH3T3 fibroblasts. In this transformed cell line, H-ras participates in an elaborate pathway attenuating the expression of Lox and of many other genes by CpG methylation on DNA. These genes are reactivated by treatment with azacytidine, an inhibitor of DNA (cytosine-5)-methyltransferases. Methylation of cytosine-guanine dinucleotides (CpGs) on DNA is an important epigenetic mechanism involved in the selective regulation of gene expression and in the stabilization of chromatin, thus controlling tissue development and pathogenesis. Aberrant CpG methylation of specific genes is often found in many tumors and tumorigenic cell lines (15).
Besides its role as inhibitor of collagen cross-linking, Hcys is also known to play a role in epigenetic gene regulation being directly involved in the DNA methylation process. Hcys represents a methyl group carrier involved in the S-adenosylmethionine-S-adenosylhomocysteine methylation cycle. Here, Hcys is remethylated to methionine, which is further activated to S-adenosylmethionine, the methyl donor in DNA methylation. S-Adenosylmethionine converts to S-adenosylhomocysteine after DNA methylation. Hydrolysis of S-adenosylhomocysteine to homocysteine completes the cycle (16).
Nevertheless, in contrast to other cells and tissues, to date sparse research has been performed regarding the significance of epigenetic gene regulation for bone development and pathogenesis. We have recently demonstrated that maintenance of global and specific DNA methylation by collagen type I, the main component of extracellular matrix in the bone, plays an important role in osteoblastic survival (17). Furthermore, we have shown that Hcys affects osteoblastic development and differentiation by altering the expression of osteoblastic genes already at the mRNA level (9).
Assuming an epigenetic cause, in this study we demonstrate the mechanisms involved in suppression of Hcys of Lox mRNA expression in pre-osteoblastic MC3T3-E1 cells. Besides the known role of Hcys as a metabolite in the DNA methylation cycle (16), we investigated if Hcys has an impact on the expression of genes involved in DNA methylation such as DNA methyltransferases and helicase, lymphoid-specific (Hells). Thereby we found that Hcys regulates the expression of DNA methyltransferase 1 (Dnmt1) by inducing a signaling pathway where interleukin 6 (IL-6), Janus kinase 2 (Jak2), and Friend leukemia virus integration 1 (Fli1) transcription factors were involved. These findings suggest a key role of epigenetic DNA methylation in Hcys-mediated Lox suppression.
MATERIALS AND METHODS
Cell Culture
MC3T3-E1 cells (kindly donated by Dr. Kumegawa, Department of Oral Anatomy, Meikai University, Sakado, Japan), a clonal pre-osteoblastic cell line derived from newborn mouse calvariae, were cultured in humidified air under 5% CO2 at 37 °C. α-Minimum essential medium (Biochrom, Berlin, Germany) was supplemented with 5% fetal calf serum (Biochrom, Germany), 50 μg/ml ascorbic acid (Sigma), and 10 μg/ml gentamycin (Sigma). For propagation, cells were subcultured twice a week using 0.001% Pronase E (Roche Applied Science) and 0.02% EDTA in Ca2+- and Mg2+-free phosphate-buffered saline (PBS) before achieving confluence. For experiments, MC3T3-E1 cells were seeded in culture dishes at a density of 20,000/cm2 and cultured overnight. The next day, the medium was changed, and the cells were treated with Hcys (Sigma) at the indicated concentrations for 3, 6, or 14 days.
To demonstrate the effect of Hcys on the JAK2 pathway or on DNA methylation, cells were treated with 3.6 mm Hcys for 3 days; thereafter, 30 μm of the specific JAK2 inhibitor AG490 (Calbiochem) or 50 μm of the DNA methylation inhibitor zebularine (Sigma) was added to the medium for a further 3 days. To test the effects of recombinant mouse IL-6 protein (PeproTech, United Kingdom) on the cells, they where cultured with increasing concentrations (3–30 ng/ml) for 36 and 48 h. To demonstrate the IL-6-dependent activation of the JAK2 pathway by Hcys, cells were treated with 3.6 mm Hcys for 3 days; thereafter, 4 μg/ml IL-6 antibody (Ab) (PeproTech) was added to the medium for a further 3 days.
Isolation of Nucleic Acids and mRNA Expression Analysis by qRT-PCR
DNA and RNA were extracted using a DNA/RNA isolation kit (Qiagen). cDNA was synthesized from about 0.5 μg of RNA using the First Strand cDNA synthesis kit as described by the supplier (Roche Applied Science). The obtained cDNA was subjected to PCR amplification with a real time cycler using FastStart SYBR Green master mix (Roche Applied Science) for the genes Dnmt1, Dnmt3b, Hells, and Fli1 (for primer design see Table 1). SYBR Green PCR was started with 10 min of an initial denaturation step at 95 °C and then continued with 45 cycles consisting of 30 s of denaturation at 95 °C, 30 s annealing at primer-specific temperatures, and extension at 72 °C. For Lox expression, we used a TaqMan probe (Mm00495386_m1, Applied Biosystems), and for normalization we used the 18 S RNA TaqMan probe (4319413E, Applied Biosystems), both in combination with TaqMan gene expression master mix (Applied Biosystems) with an initial denaturation at 95 °C for 10 min followed by 45 cycles alternating between 60 and 90 °C. All PCRs were performed in triplicate, and expression was evaluated using the comparative quantitation method (18). For each experiment, the triplicate results of the qRT-PCR were averaged, and this mean value was treated as a single statistical unit. The data of the experimental results are presented as means ± S.D.
TABLE 1.
qRT-PCR primer for mRNA expression and Lox CpG methylation analysis (SYBR Green)
| Gene | Forward primer (5′–3′) | Reverse primer (5′–3′) | Tm |
|---|---|---|---|
| °C | |||
| Dnmt1 | ACCGCTTCTACTTCCTCGAGGCCTA | GTTGCAGTCCTCTGTGAACACTGTGG | 62 |
| Dnmt3b | GGAGAAAGCCAGGGT | AAGAGGGGGTGGAAGGA | 63 |
| Hells | TGAGGATGAAAGCTCTTCCACT | ACATTTCCGAACTGGGTCAAAA | 63 |
| Fli1 | ATGGACGGGACTATTAAGGAGG | GAAGCAGTCATATCTGCCTTGG | 62 |
| Primer for Lox CpG methylation analysis | |||
| Promoter/first exon | GCATGTTCGGCCCAGATTAAGTCG | CAGAGTCTGGAGTAGAAGGAGGAGG | 65 |
| Primer for FLI1 ChIP analysis on Dnmt1 promoter | |||
| Dnmt1 ChIP-FLI1 | CTTCCCCCACTCTCTTGC | GAACAGCTCTGAACGAGAC | 63 |
Affymetrix GeneChip Analysis
Total RNA was isolated using an RNA isolation kit (Qiagen). Quality control of the RNAs as well as labeling, hybridization, and scanning of the hybridized arrays was performed by the Kompetenzzentrum fuer Fluoreszente Bioanalytik (KFB) (Regensburg, Germany) using the mouse 430 2.0 chip (Affymetrix).
IL-6 Quantification by ELISA
For IL-6 ELISA, MC3T3-E1 cells were seeded in triplicate and treated with or without the indicated Hcys concentrations for 14 days as described above. After 3, 6, and 14 days of Hcys treatment, 1 ml of culture supernatant was saved and stored at −80 °C. For IL-6 quantification, 96-well ELISA plates (Iwaki) were prepared by using the murine IL-6 ELISA development kit as described by the supplier (PeproTech). IL-6 concentration was monitored by color development of 2,2′-azino-bis(3-ethylbenzthiazoline-6-sulphonic acid) liquid substrate (Sigma) with an ELISA plate reader (Glomax, Promega) at 405 nm with wavelength correction set at 650 nm. Every cultured well was measured in triplicate; these triplicate results were averaged, and the mean value was treated as a single statistical unit. The complete experiment was performed twice.
Protein Isolation and Immunoblotting
For protein extraction, cell layers were washed two times with PBS and scraped in SDS sample buffer (2% SDS, 100 mm β-mercaptoethanol, 125 mm Tris-HCl, pH 6.8) and heated at 95 °C for 5 min. 30 μg of protein extracts were fractionated on 8 or 10% SDS-PAGE for Dnmt1 or the other proteins, respectively. Following SDS-gel electrophoresis, the proteins were transferred to nitrocellulose filters (Millipore) and blocked overnight with 10% blocking reagent (Roche Applied Science) in TN Buffer (50 mm Tris, 125 mm NaCl, pH 8). Subsequently, the filters were incubated for 1 h at room temperature with antibodies against FLI1 ((C19), HELLS (Lsh, H-240)), LOX (H-140), DNMT1 (K-18, all Santa Cruz Biotechnology) diluted 1:200 in blocking buffer. Afterward, all filters were washed three times with immunoblot wash buffer (TN buffer containing 0.01% Tween) and the FLI1, HELLS, and LOX blots were incubated for an additional hour with an anti-mouse IgG/anti-rabbit IgG horseradish peroxidase (HRP)-labeled secondary antibody (Roche Applied Science) diluted 1:20,000 in blocking buffer. The Dnmt1 blot was incubated for 1 h with an anti-goat IgG HRP-labeled secondary antibody (Sigma) diluted 1:160,000 in blocking buffer. Finally, the blots were washed again three times with immunoblot washing buffer before detection of light emission with the BM chemiluminescence Western blotting kit (Roche Applied Science) as described by the supplier. Chemiluminescence was measured with an image acquisition system (Vilber Lourmat, France).
Cloning of Mouse Dnmt1 Promoter
To study the effect of IL-6 on Dnmt1 promoter activity, four fragments of the mouse Dnmt1 promoter (NC_000075.5) were cloned from MC3T3-E1 genomic DNA into the pGEM T-easy vector (Promega) by using the following 5′-primers elongated to contain a BglII restriction site (underlined): TCG AGA TCT GCC TTC GGG CAT AGC ATG GTC for a 220-bp fragment carrying three putative Fli1-binding sites (as suggested in Ref. 19), at −30, −60, and −96 bp from the somatic transcriptional start site (20); TCG AGA TCT GCC TGT GTG GTA CAT GCT GC for the 190-bp fragment carrying two putative Fli1-binding sites (at −30 and −60 bp); TCG AGA TCT GGC CGC CCC CTC CCA ATT GG for the 160-bp fragment carrying one putative Fli1-binding site (at −30 bp); and TCG AGA TCT GCG AAA AAG CCG GGG TCT CGT TC for the 150-bp fragment carrying no FLI1-binding sites. As 3′-primer we used GCC TGC GGA CAT GGT CCG GGA GCG AGC CTG. These fragments were subsequently cloned into the secreted alkaline phosphatase 2 (SEAP2) reporter vector (Clontech) by using BglII and EcoRI restriction enzymes (Fig. 1a).
FIGURE 1.

Schematic diagram depicting Dnmt1 (a) and Lox (b) promoter. a, exon representing the somatic transcription start (marked with 1) is represented as small open box (untranslated region) and large black arrow (translated region). The three putative FLI1-binding sites are shown as gray boxes. Forward (fw) cloning primers annotated with the resulting amplicon size and reverse (rv) cloning primer are marked as white arrows. Binding sites of amplification primers for Fli1 ChIP analysis are marked as black arrows. The numbers below the gene line denote the distance to the transcription start. b, representation of Lox proximal promoter and the first exon showing the fragment used for methylation analysis (gray line). Lox genomic structure shows a part of the first exon (475 bp), including 374 bp of the 5′-untranslated region (open box) and the first 101 bp of the coding region (black arrow). To generate a suitable fragment (gray line) for methylation analysis by “Methyl Miner” assay, DNA was restricted by MboII restriction enzyme (M). Forward (fw) and reverse (rv) primers for subsequent amplification by qRT-PCR are marked as white arrows. The vertical bars indicate the CpGs in the DNA strand, and the numbers below the gene line denote the distance to the transcription start.
To generate mutated Dnmt1-SEAP2 fragments, as described previously (19), the following primers with modified putative FLI1-binding sites were designed (mutation sites form 5′- TTCC to TTAA are underlined): 5′ CGG GCA TAG CAT GGT CTT AAC CCA CTC TCT TGC CCT G and complementary 3′ CAG GGC AAG AGA GTG GGT TAA GAC CAT GCT ATG CCC G for the putative FLI1-binding site at −96 bp from the somatic transcriptional start site; 5′ GTG GTA CAT GCT GCT TAA GCT TGC GCC GCC CC and complementary 3′ GGG GCG GCG CAA GCT TAA GCA GCA TGT ACC AC for the putative FLI1-binding site at −60 bp from the somatic transcriptional start site; and 5′ CTC CAA ATT GGT TTA AGC GCG CGC GAA AAA GCC G and 3′ CGG CTT TTT CGC GCG CGC TTA AAC CAA TTG GGA G for the putative FLI1-binding site at −30 bp from the somatic transcriptional start site.
For transfection experiments with the various SEAP2-Dnmt1 vectors, SEAP2-control vector and the SEAP2-basic vector, MC3T3-E1 cells were seeded at 20,000 cells/cm2 in 48 multiwell plates. Six hours after seeding, cells were transfected with 0.15 μg/cm2 vector construct using 1 μg/cm2 DOSPER transfection reagent (Roche Applied Science) following the suppliers' protocol. After 2 days, cells were treated for a further 3 days with 30 ng/ml of murine IL-6 (PeproTech), and finally, SEAP2 activity was measured in 50 μl of culture supernatant using the SEAP2 bioluminescence kit (Roche Applied Science) following the supplier's instructions. Each experiment was run in quadruplicate and was repeated at least twice.
Chromatin Immunoprecipitation of Fli1 Bound on Dnmt1 Promoter
As numerous members of the E-twenty six transcription factor family can bind to GGAA (TTCC) sequence in vitro, chromatin immunoprecipitation (ChIP) assay were performed to demonstrate FLI1 TTCC occupancy at the Dnmt1 locus in vivo. For this purpose, MC3T3-E1 cells were treated for 6 days with or without 3.6 mm Hcys. Subsequent chromatin cross-linking, cell lysis, chromatin sharing, FLI1 immunoprecipitation, and DNA clean-up were performed with the ChampionChip one-day kit (SABiosciences, MD) following the manufacturer's instructions. Chromatin from untreated as well as from Hcys-treated cells was incubated overnight on a rotor at 4 °C with 4 μg of anti-FLI1 antibody (C-19, Santa Cruz Biotechnology) or with 4 μg of nonimmune serum as negative control. Before immunoprecipitation, 1% (10 μl) of the chromatin was saved and stored at 4 °C for further use as reference. For quantitation of the qRT-PCR values, for each sample, DNA signal of the FLI1-precipitated chromatin was normalized to the unprecipitated chromatin (for ChIP-Dnmt1 promoter primer design see Table 1).
Lox Promoter Methylation
To test if down-regulation of Lox by Hcys is due to CpG methylation, CpG content on Lox promoter was analyzed. A CpG-rich region starting from approximately −600 bp 5′ from the transcriptional start site and spanning over the first exon was selected. An appropriate fragment of the targeted Lox region was generated by digestion of 1 μg of genomic DNA with 40 units of the CpG methylation-insensitive restriction enzyme MboII (New England Biolabs) for 20 min at 37 °C from cells cultured for 6 and 14 days with or without 3.6 mm Hcys. Subsequently, the enzyme was heat-inactivated at 65 °C for 20 min. As shown in Fig. 1b, the generated fragment has 627 bp and contains 30 CpG sites. It includes 243 bp of the proximal promoter region and 312 bp of the untranslated part of the first exon of Lox. After MboII digestion, DNA was purified using a commercially available PCR clean-up kit following supplier's instructions. In the next step, methylated DNA fragments were captured with the “Methyl Miner methylated DNA enrichment kit” (Invitrogen) following the supplier's instructions. In brief, methylated DNA was captured by methyl-binding protein 2 (MBD2) coupled to magnetic beads and subsequently separated from the unmethylated DNA fraction. Methylated DNA was eluted from the MBD2 beads with 200 μl of a 2 m NaCl solution as a single fraction and concentrated by ethanol precipitation. Finally, the mean methylation status of the fragments was determined by amplifying the fragments by quantitative real time PCR. Amplification ratios of the bound (methylated) DNA fraction to unbound (unmethylated) DNA fraction were calculated (for primer design see Table 1).
Statistical Analysis
Statistical analyses were performed using either analysis of variance or Student's t test using Prism 4.03 (GraphPad Software, San Diego). p ≤ 0.05 was considered as significant. Results are presented as mean ± S.D.
RESULTS
Homocysteine Stimulates IL-6 Expression thus Affecting JAK2-dependent Signaling Pathways in MC3T3-E1 Cells
As we already have demonstrated by genome-wide expression studies, Hcys affects the expression of genes of the osteoblastic phenotype (9). Further analysis of the data suggested that Hcys regulated the mRNA expression of IL-6 and of genes involved in JAK2 signal transduction pathways (Table 2), which are activated by this cytokine (21, 22).
TABLE 2.
Regulation of genes involved in the JAK/STAT signal transduction pathway as suggested by genome-wide expression analysis
Fold regulation means change in expression level at a given concentration divided by that of the untreated cultures.
| Gene symbol | Fold regulation to untreated control |
||
|---|---|---|---|
| 0.108 mm | 3.6 mm | 10.8 mm | |
| Il6 | −1.06 | 1.51 | 2.37 |
| Il6ra | −1.01 | −1.06 | 1.09 |
| Il6st | 1.04 | 1.21 | 1.31 |
| Jak1 | −1.22 | 1.12 | 1.08 |
| Jak2 | −1.74 | 1.61 | 1.74 |
| Jak3 | −1.30 | −1.16 | −1.29 |
| Stat1 | 1.59 | 3.06 | 3.44 |
| Stat2 | 2.52 | 3.97 | 3.31 |
| Stat3 | −1.21 | −1.08 | −1.14 |
| Stat4 | −1.11 | −1.28 | −1.10 |
| Stat5a | 1.24 | 1.10 | 1.03 |
| Stat5b | 1.09 | 1.03 | 1.07 |
| Stat6 | 1.20 | 1.15 | 1.41 |
| Cbl | 1.41 | 1.96 | 2.02 |
| Cblb | −1.28 | −1.16 | −1.35 |
| Cblc | −1.11 | −1.39 | −1.56 |
To understand the temporal dynamics, time and dose dependence of Hcys on MC3T3-E1 cells was studied. Because of variation of basal expression of IL-6 mRNA expression as measured by qRT-PCR, by ELISA, we measured IL-6 protein, which accumulates in the culture medium. Generally, the primary data measured by ELISA showed a decreasing trend for the basal IL-6 expression (from 0.56 ng/ml IL-6 expression after 3 days to 0.33 ng/ml IL-6 expression after 14 days, data not shown). As shown in Fig. 2, after 3 days of Hcys treatment, no significant changes in IL-6 expression could be observed in the pre-osteoblastic cell line. However, after 6 days of Hcys treatment, IL-6 expression strongly increased in a concentration-dependent manner showing a maximal up-regulation of 4.4-fold (corresponding to 1.83 ng/ml IL-6) at 3.6 mm Hcys (p ≤ 0.001) in the culture medium when compared with untreated cultures. After 14 days of treatment, the Hcys effect on IL-6 expression was attenuated but was still significant at 3.6 mm (p ≤ 0.01). In Table 3, we present the regulation of those genes that will be described in more detail later to demonstrate the epigenetic influence of Hcys on Lox regulation.
FIGURE 2.

Hcys up-regulates IL-6 in MC3T3-E1 pre-osteoblasts. After 6 days (d) of treatment with 3.6 mm Hcys, expression of the JAK2 activator IL-6 was significantly enhanced in the MC3T3-E1 pre-osteoblastic cell line when compared with untreated cultures (Co). After 14 days of treatment, the up-regulative effect of Hcys on IL-6 expression was reduced but remained significant at the highest concentration used. No effects were observed after 3 days of culture with Hcys. To analyze IL-6 expression, cell medium supernatant was saved, and IL-6 expression was measured by ELISA. Values are represented as mean ± S.D.; untreated control is set to 1, and treated probes are referred as fold change to control. *, p ≤ 0.05; **, p ≤ 0.01; ***, p ≤ 0.001; n = 6.
TABLE 3.
Regulation of genes involved in the DNA methylation process as suggested by genome-wide expression analysis
Regulation of these genes was verified by qRT-PCR and, except for Dnmt3b, by ELISA or immunoblots. Fold regulation means change in expression level at a given concentration divided by that of the untreated cultures.
| Gene symbol | Fold regulation to untreated control |
||
|---|---|---|---|
| 0.108 mm | 3.6 mm | 10.8 mm | |
| Il6 | −1.06 | 1.51 | 2.37 |
| Fli1 | 1.18 | 1.15 | 1.40 |
| Dnmt1 | 1.09 | 1.51 | 1.76 |
| Dnmt3b | 1.34 | 1.09 | 1.25 |
| Hells | −1.04 | 2.45 | 3.60 |
| Lox | −1.07 | −1.67 | −1.64 |
Dnmt1 mRNA Expression Is Up-regulated by IL-6 via Putative FLI1-binding Sites on Dnmt1 Promoter in MC3T3-E1 Cells
Recently, it was demonstrated that IL-6 activates the transcription of DNMT1 via FLI1 in human erythroleukemia cells (19, 23). Fig. 3 demonstrates that a comparable pathway exists in mouse osteoblasts as well. IL-6 significantly increased Fli1 after 36 h and tended to stimulate expression after 48 h (Fig. 3a), although Dnmt1 mRNA expression did not increase significantly until after 48 h of treatment (Fig. 3b). Dose dependence of the expression of both genes at the time when expression was significantly increased demonstrates that a maximum effect was found already at 3 ng/ml IL-6 (Fig. 3, c and d); this value was in the same order of magnitude as found in the culture medium after Hcys treatment of MC3T3-E1 cells as mentioned above (1.83 ng/ml).
FIGURE 3.

Fli1 (a) and Dnmt1 (b) mRNA expression after treatment of MC3T3-E1 cells with 30 ng/ml recombinant murine IL-6 for 36 and 48 h. Compared with untreated control (Co), Fli1 mRNA expression is significantly up-regulated after 36 h of IL-6 treatment, whereas Dnmt1 mRNA expression remains unaffected at this time. After 48 h, 12 h after Fli1 stimulation, Dnmt1 also shows a significant increase in mRNA expression by IL-6 treatment. At this time, Fli1 mRNA expression is still increased by IL-6; however, the regulation is not significant. As shown in c and d, treatment of the cells with increasing concentrations of IL-6 at the times showing significant mRNA stimulation for Fli1 and Dnmt1 revealed a significant up-regulation for both genes already at 3 ng/ml IL-6 in culture medium. The up-regulative effect of the cytokine was already reached at this concentration saturation for both genes. To analyze mRNA expression of Fli1 and Dnmt1, RNA was isolated and analyzed by qRT-PCR. Gene expression was normalized to 18 S rRNA. Treated probes are referred as fold change to untreated control; *, p ≤ 0.05; **, p ≤ 0.01; ***, p ≤ 0.001. For all graphs n = 3.
Fig. 1a depicts three putative FLI1-binding sites (sequence GGAA) in the first 220 bp of the somatic Dnmt1 promoter (20), which are similarly organized in the human counterpart (19). To test if IL-6 mediated the increase of Dnmt1 transcription via these binding sites, reporter-vector constructs of the Dnmt1 gene with different lengths were constructed and transfected into MC3T3-E1 cells. As depicted in Fig. 1a, four different truncations were created as follows: a 150-bp fragment without any putative FLI1-binding site and three other fragments with 160, 190, and 220 bps containing one, two, or three putative FLI1-binding sites at −30, −60, or −96 bp, respectively. After 72 h of IL-6 treatment, SEAP2 activity was measured in the culture supernatant. As shown in Fig. 4a, when compared with the respective untreated promoter vectors, an IL-6-dependent increase of Dnmt1 promoter activity correlated with an increasing promoter length and/or an increasing number of GGAA sites in the promoter. The strongest IL-6 effect was observed for the vector containing an insert of 220 bp (3 GGAA sites) of Dnmt1 promoter with an increase of 2.2-fold (p ≤ 0.05) when compared with the untreated vector.
FIGURE 4.

a, as measured by reporter gene assay, Fli1-binding sites/promoter length correlated with the IL-6-dependent activation of the Dnmt1 promoter. A significant increase in promoter activity by IL-6 was seen when the putative FLI1-binding sites at −60 bp (190-bp fragment) and at −96 bp (220-bp fragment) from the somatic transcriptional start site were included in the Dnmt1 promoter. Point mutation at one or more putative FLI1-binding sites in the 220-bp Dnmt1 promoter fragment reduced IL-6 (30 ng/ml) responsiveness of the Dnmt1 promoter. Mutation at all putative FLI1 sites decreased significantly IL-6-dependent Dnmt1 promoter activation (b). Promoter activity was measured by SEAP2 reporter gene assay. Values are represented as mean ± S.D., and untreated controls are set to 0 in a and to 1 in b. b depicts one representative result of total three experiments. Treated probes are referred as fold change to nontreated control (NT); *, p ≤ 0.05; **, p ≤ 0.01; ***, p ≤ 0.001. b, + represents significant differences to IL-6 treated, nonmutated Dnmt1 vector (NM, white bar): +, p ≤ 0.05; ++, p ≤ 0.01; +++, p ≤ 0.001. a, n = 3; b, n = 4.
To ensure that the IL-6-mediated effect on the activity of the Dnmt1 promoter was due the predicted sites, in the 220-bp Dnmt1 promoter-reporter construct these sites were mutated. After transfection into MC3T3-E1 cells and treatment with IL-6 for 72 h, SEAP2 activity was measured in culture supernatant again. As shown in Fig. 4b, mutation of these binding sites reduced transcription of the Dnmt1 promoter-reporter construct, where mutation of site 3 (see Fig. 1) showed the strongest effect.
Hcys Up-regulates the Transcription Factor Fli1 via IL-6 and JAK2 in MC3T3-E1 Cells
Hcys regulated Fli1 mRNA expression similarly to IL-6. After 3 days of Hcys treatment, no effect on mRNA expression of Fli1 was observed. Subsequently, the highest Hcys-mediated increase of Fli1 mRNA expression was observed after 6 days of treatment reaching a 2.1-fold (p ≤ 0.01) up-regulation when compared with control. After 14 days of treatment, the Hcys effect on Fli1 expression was attenuated but was still significant (p ≤ 0.01, Fig. 5a).
FIGURE 5.

Hcys-stimulated Fli1 expression is inhibited by an IL-6 Ab. After 6 days (d) of treatment, a significant up-regulation of Fli1 mRNA expression was observed at 3.6 mm Hcys in medium when compared with the untreated control (Co) (a). This effect was slightly decreased after 14 days. No effect on Fli1 mRNA expression was seen after 3 days of Hcys treatment. After 6 days of Hcys treatment, inhibition of IL-6 activity by an IL-6 Ab (4 μg/ml) abrogated the effect of Hcys (3.6 mm) on up-regulation of Fli1 (b). To analyze Fli1 mRNA expression, RNA was isolated and analyzed by qRT-PCR. Gene expression was normalized to 18 S rRNA. Values are represented as mean ± S.D.; untreated control (Co) is set to 1, and treated probes are referred to as fold change to control. *, p ≤ 0.05; **, p ≤ 0.01; +, p ≤ 0.05 refers to significance to Hcys-treated probes; for all graphs n = 3. Lane M refers to protein molecular weight standards.
Addition of anti-IL-6 antibody (Fig. 5b) or of the JAK2 inhibitor AG490 (Fig. 6) for the last three culture days to 6 days Hcys (3.6 mm)-treated MC3T3-E1 cells abrogated the Hcys effect on Fli1 mRNA and protein expression (Fig. 6, a–c). This indicates that Hcys regulates Fli1 expression via IL-6/JAK2. No effect of the Ab or of AG490 was found on basal Fli1 expression.
FIGURE 6.
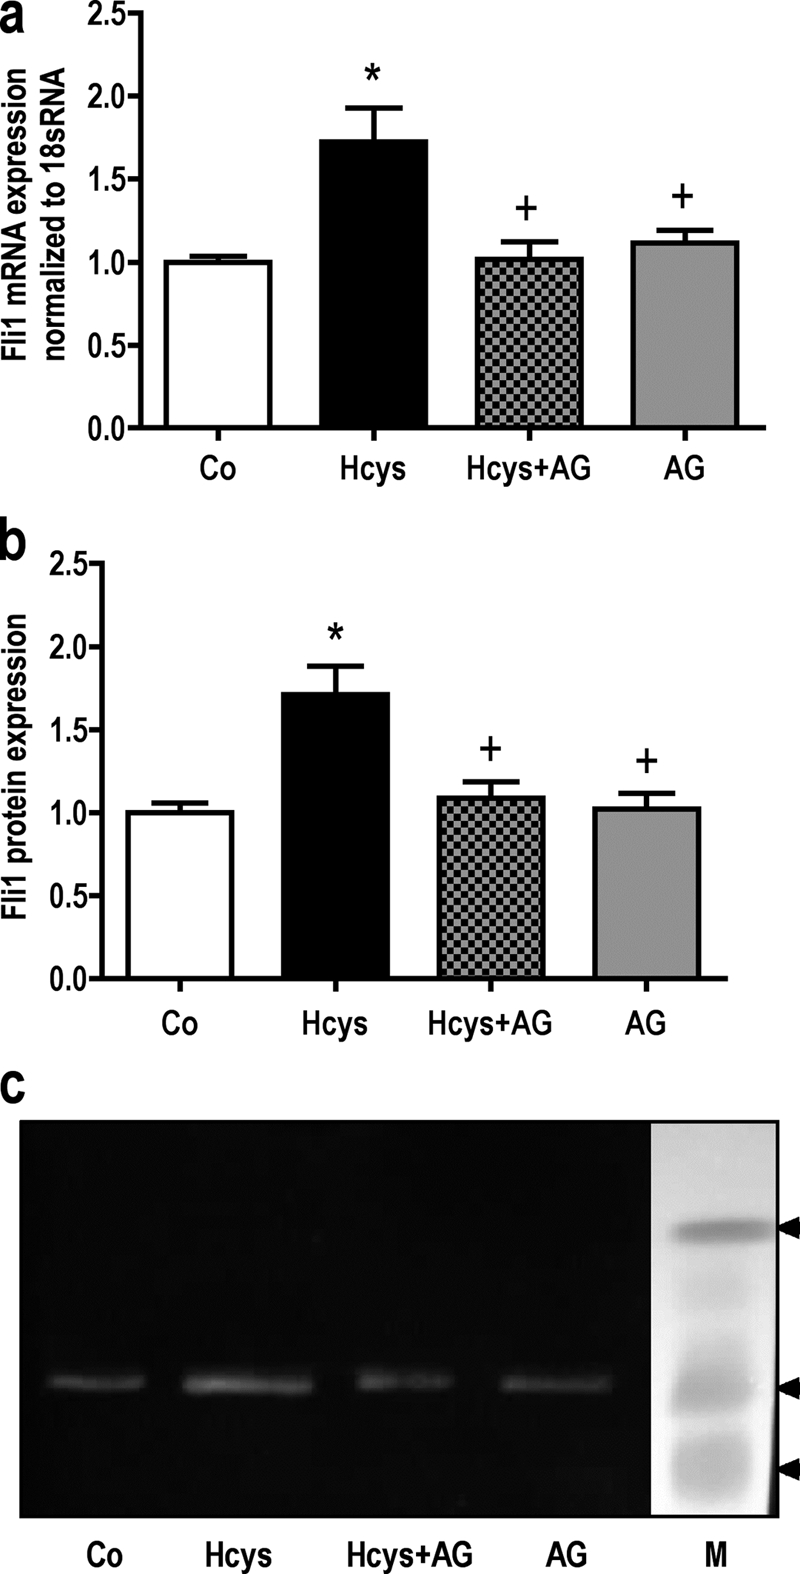
Hcys stimulated Fli1 expression is inhibited by AG490, an inhibitor of JAK2 activity. After 6 days of Hcys treatment, inhibition of JAK2 by AG490 (AG) (30 μm) abrogated the effect of Hcys (3.6 mm) on up-regulation of Fli1 on the mRNA (a) as well as on the protein level (b and c). To analyze Fli1 mRNA expression, RNA was isolated and analyzed by qRT-PCR. Gene expression was normalized to 18 S rRNA. 30 μg of protein of each sample were fractionated by SDS-gel electrophoresis and immunoblotted. Values are represented as mean ± S.D.; untreated control (Co) is set to 1, and treated probes are referred as fold change to control. *, p ≤ 0.05; +, p ≤ 0.05 refers to significance to Hcys-treated probes; for all graphs n = 3. One representative immunoblot is shown. Lane M refers to protein molecular weight standards.
Hcys Stimulates the Expression of Genes Involved in Epigenetic DNA Methylation
Gene chip analysis indicated an Hcys-dependent mRNA up-regulation of genes involved in DNA methylation (Table 3). The results on the regulation of DNA methylation-related genes obtained by gene chip analysis were confirmed by qRT-PCR. Furthermore, Dnmt1 and Hells expressions were also studied by immunoblot analysis. As shown, when compared with untreated controls, after 3 days of culture 3.6 mm Hcys slightly induced the mRNA expression of Dnmt1 (Fig. 7a) and Dnmt3b (Fig. 9) and significantly induced (p ≤ 0.05) the mRNA expression of Hells (Fig. 8a). However, after 6 days of treatment, Hcys up-regulated the mRNA expression of all three genes significantly. At this time, Hcys increased the mRNA expression of Dnmt1 1.80-fold (p ≤ 0.01, Fig. 7a), the DNMT1 protein expression 3.13-fold (p ≤ 0.05, Fig. 7, b and c), the mRNA expression of Hells 3.1-fold (p ≤ 0.05, Fig. 8a), the protein expression of HELLS 1.78-fold (p ≤ 0.05, Fig. 8, b and c), and the mRNA expression of Dnmt3b 1.84-fold (p ≤ 0.001, Fig. 9) when compared with untreated control. After 14 days of Hcys treatment, the mRNA expression of all three genes was still significantly increased (Figs. 7a, 8, and 9).
FIGURE 7.

mRNA expression of Dnmt1, a gene involved in DNA methylation, is enhanced by Hcys in MC3T3-E1 cells. As demonstrated in a, when compared with untreated control (Co), mRNA expression of the DNA methylation-related gene Dnmt1 was significantly enhanced by 3.6 mm Hcys after 6 and 14 days (d) of treatment. Hcys-dependent up-regulation of DNMT1 was confirmed at the protein level after 6 days of treatment (b and c). To analyze mRNA expressions, RNA was isolated and analyzed by qRT-PCR. Gene expression was normalized to 18 S rRNA. 30 μg of protein of each sample were fractionated by SDS-gel electrophoresis and immunoblotted. Values are represented as mean ± S.D.; untreated control (Co) is set to 1, and treated probes are referred as fold change to control. *, p ≤ 0.05; ***, p ≤ 0.001; for all graphs n = 3. One representative immunoblot is shown. Lane M refers to protein molecular weight standards.
FIGURE 9.

mRNA expression of Dnmt3b, a gene involved in DNA methylation, is enhanced by Hcys in MC3T3-E1 cells. As demonstrated, when compared with untreated control (Co), mRNA expression of the DNA methylation-related gene Dnmt3b was significantly enhanced by 3.6 mm Hcys after 6 and 14 days (d) of treatment. To analyze mRNA expressions, RNA was isolated and analyzed by qRT-PCR. Gene expression was normalized to 18 S rRNA. Values are represented as mean ± S.D.; untreated control is set to 1, and treated probes are referred as fold change to control. *, p ≤ 0.05; ***, p ≤ 0.001; n = 3.
FIGURE 8.

mRNA expression of Hells, a co-regulator of DNA methylation, is enhanced by Hcys in MC3T3-E1 cells. As demonstrated in a, when compared with untreated control (Co), mRNA expression of the DNA methylation-related gene Hells was significantly enhanced at all times measured. Hcys-dependent up-regulation of HELLS was confirmed at the protein level after 6 days (d) of treatment (b and c). To analyze mRNA expressions, RNA was isolated and analyzed by qRT-PCR. Gene expression was normalized to 18 S rRNA. 30 μg of protein of each sample were fractionated by SDS-gel electrophoresis and immunoblotted. Values are represented as mean ± S.D.; untreated control (Co) is set to 1, and treated probes are referred as fold change to control. *, p ≤ 0.05; **, p ≤ 0.01; for all graphs n = 3. One representative immunoblot is shown. Lane M refers to protein molecular weight standards.
Hcys-mediated Up-regulation of Dnmt1 Is IL-6- and FLI1-dependent
To demonstrate that IL-6 is involved in Hcys-dependent up-regulation of Dnmt1, as for Fli1, we co-treated MC3T3-E1 cells with Hcys and IL-6 antibody. As shown in Fig. 10a, Hcys up-regulation of Dnmt1 was abrogated by co-treatment of the cells with an IL-6 antibody. This demonstrates that the increase of Dnmt1 expression by Hcys is IL-6-dependent.
FIGURE 10.

Hcys-mediated up-regulation of Dnmt1 is IL-6- and Fli1-dependent. After 1 week of Hcys treatment, IL-6 Ab significantly abrogated the effect of Hcys on Dnmt1 expression while leaving Dnmt1 mRNA expression in Hcys-untreated cells unaffected (a). Involvement of FLI1 transcription factor in Hcys-driven Dnmt1 up-regulation was shown by chromatin immunoprecipitation analysis (ChIP) (b). After 1 week, Hcys-treated cells showed a significant increase of FLI1 binding affinity to the selected Dnmt1 promoter sequence. mRNA expressions as well as ChIP-DNA were analyzed by qRT-PCR. Gene expression was normalized to 18 S rRNA. For ChIP quantitation, DNA signals of the FLI1-precipitated chromatin were normalized to the unprecipitated chromatin fraction (1% of the total chromatin). Values are represented as mean ± S.D.; untreated control (Co) is set to 1, and treated probes are referred as fold change to control. *, p ≤ 0.05; ++, p ≤ 0.01 refers to significance to Hcys-treated probes; for all graphs n = 3.
Results of our experiments shown in Fig. 3c and at 3 days suggest the involvement of a transcription factor belonging to the E-twenty six (ETS) transcription factor family because deletion or mutation of the GGAA sites in the Dnmt1 promoter abrogated IL-6-dependent promoter activation. After 6 days of Hcys treatment, chromatin immunoprecipitation with an antibody against FLI1 transcription factor was used to demonstrate the interaction of this transcription factor with the Dnmt1 promoter in vivo.
Fig. 10b clearly shows that FLI1 bound to the Dnmt1 promoter sequence exhibiting three GGAA sites. This demonstrates FLI1 occupancy on the Dnmt1 proximal promoter in MC3T3-E1 cells. Moreover, Hcys treatment of MC3T3-E1 cells increased FLI1 binding to this Dnmt1 promoter area by 1.97-fold (p ≤ 0.05) proving involvement of FLI1 in Hcys-mediated Dnmt1 up-regulation. These results demonstrate that in Hcys-dependent stimulation of Dnmt1 expression in mouse pre-osteoblasts, IL-6 as well as the transcription factor FLI1 play a main role.
Hcys Suppressed Lox Expression by CpG Methylation
As we have already shown before, Hcys suppresses the mRNA expression of Lox (9). Fig. 11a demonstrates that Lox mRNA expression was not affected after 3 days of Hcys treatment but was significantly decreased after 6 days (1.82-fold, p ≤ 0.05) and after 14 days (1.71-fold, p ≤ 0.05) at 3.6 mm Hcys. Analysis of the Lox promoter showed a CpG-rich region ranging from the proximal Lox promoter into the first exon (Fig. 1b), which was used to study CpG methylation. As shown in Fig. 11b, inversely to Lox mRNA expression, Lox promoter methylation of the investigated region was significantly increased after 6 days (1.8-fold, p ≤ 0.05) and after 14 days (2.1-fold, p ≤ 0.05) of treatment with Hcys; although the difference in Hcys-mediated CpG methylation between 6 and 14 days was not significantly different.
FIGURE 11.

Hcys affects Lox mRNA expression by promoter methylation in pre-osteoblastic MC3T3-E1 cells. After 6 and 14 days of treatment with 3.6 mm Hcys in the culture medium, a significant (p ≤ 0.05) decrease of Lox mRNA expression was observed when compared with control (Co) (a). To the contrary, CpG methylation of Lox promoter and the first untranslated exon was significantly (p ≤ 0.05) increased after 6 and 14 days of treatment with 3.6 mm Hcys (b). Addition of the CpG methylation inhibitor zebularine (50 μm) to Hcys-treated MC3T3-E1 cells (3.6 mm) abrogated the repressive effect of Hcys on Lox mRNA expression (c). To analyze mRNA expression of Lox (a and c), RNA was isolated and analyzed by qRT-PCR. Gene expression was normalized to 18 S rRNA. For promoter methylation (b), DNA was isolated, and the ratio of methylated to unmethylated CpGs was analyzed by MECP2 binding. Values are represented as mean ± S.D.; untreated controls (Co) are set to 1, and treated probes are referred as fold change to controls for *, p ≤ 0.05; **, p ≤ 0.01; ++, p ≤ 0.01 refers to significance to Hcys-treated probes. For all graphs n = 3.
To prove the role of DNA methylation in Hcys-dependent down-regulation of Lox expression, MC3T3-E1 cells were cultured for 6 days with or without 3.6 mm Hcys in the presence or absence of 50 μm zebularine, an inhibitor of DNA CpG methylation. As shown in Fig. 11c, Hcys again attenuated expression of Lox mRNA expression significantly. Zebularine when added to the Hcys-treated cells significantly increased Lox expression, even above the expression level of untreated cells, thus indicating a prevalent basal CpG methylation.
To test whether the IL-6-JAK2-FLI1 pathway was a prerequisite for Lox suppression, MC3T3-E1 cells were treated for 6 days with or without Hcys and for the last 3 culture days in the absence or presence of the JAK2 inhibitor AG490. As shown in Fig. 12a, Hcys down-regulated the mRNA expression of Lox, whereas AG490, having no effect on basal expression, abolished the Hcys-dependent repression of Lox. Very similar effects were observed on the protein level by immunoblot analysis (Fig. 12, b and c). At the protein level, again, Hcys down-regulated LOX protein expression, whereas AG490 treatment induced Lox expressions when compared with control; however, only the difference between Hcys and Hcys + AG490 was statistically significant.
FIGURE 12.
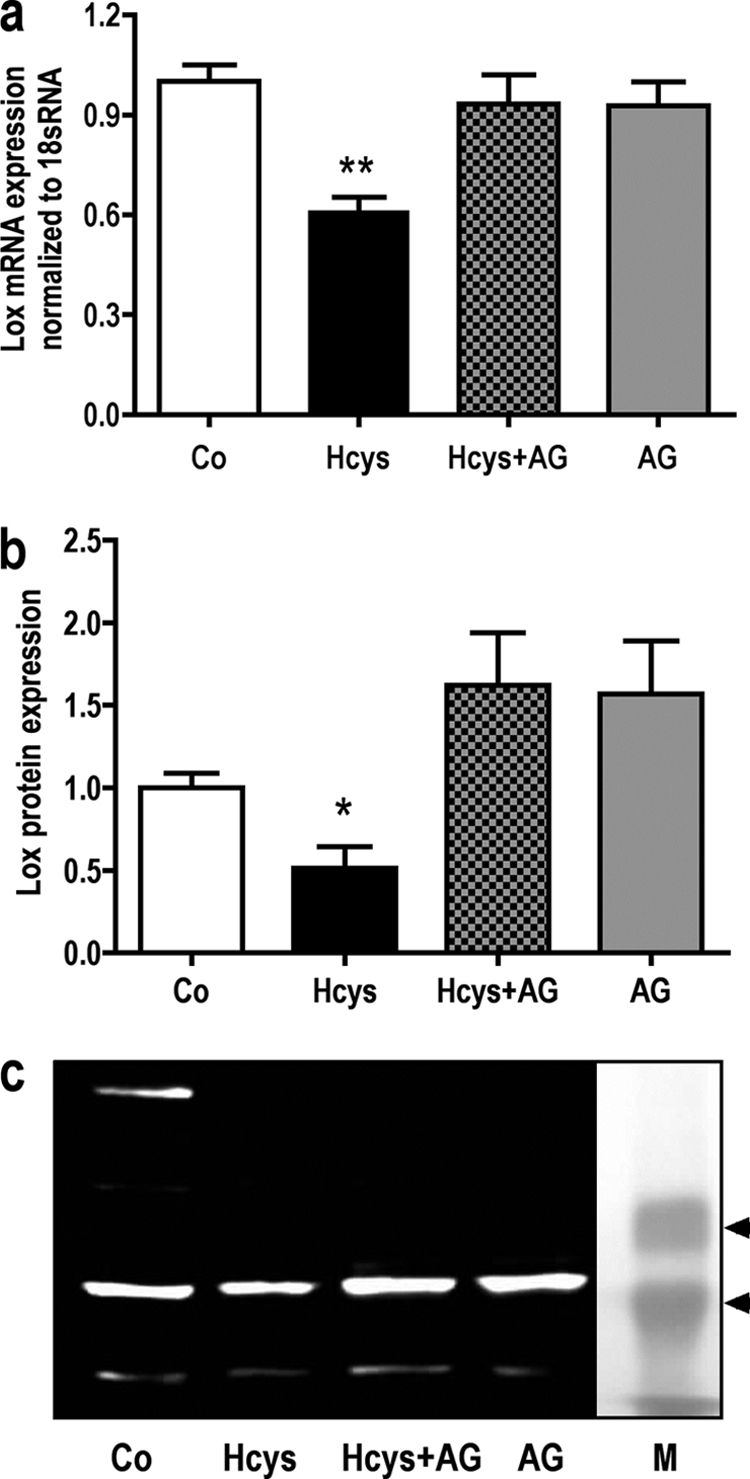
Hcys-attenuated Lox mRNA expression is abrogated by the JAK2 inhibitor AG490. Co-treatment of MC3T3-E1 cells with Hcys (3.6 mm) and the JAK2 inhibitor AG490 (AG) (30 μm) erased the suppressive effect of Hcys (3.6 mm) on Lox mRNA expression. Treatment of AG490 alone did not influence Lox mRNA expression in the pre-osteoblasts (a). A similar effect was observed when protein expression was analyzed (b and c). RNA was isolated and analyzed by qRT-PCR. Gene expression was normalized to 18 S rRNA. 30 μg of protein of each sample were fractionated by SDS-gel electrophoresis and immunoblotted. Values are represented as mean ± S.D., untreated controls (Co) are set to 1, and treated probes are referred to as fold change to controls for *, p ≤ 0.05; **, p ≤ 0.01; +, p ≤ 0.05; ++, p ≤ 0.01 refers to significance to Hcys-treated probes. For all graphs n = 3. One representative immunoblot is shown. Lane M refers to protein molecular weight standards.
DISCUSSION
Genome-wide mRNA expression analysis of Hcys-treated MC3T3-E1 cells revealed a strong up-regulation of IL-6 and of several genes involved in IL-6/JAK2-dependent signal transduction pathways. The up-regulation of IL-6 by Hcys was confirmed at the protein level by measurements with an ELISA. The IL-6 concentrations were in the range expected to permit the stimulation of Fli1 and Dnmt1 via JAK2.
The stimulation of IL-6 expression by Hcys in the pre-osteoblastic MC3T3-E1 cell line per se was an unexpected finding of these experiments; it suggests that Hcys affects via IL-6 both osteoblasts, the bone-forming cells, and osteoclasts, the bone-resorbing cells (24).
The published reports concerning the effects of IL-6 on bone cells are conflicting (24–26). IL-6-deficient mice have no obvious bone phenotype, but they are protected from bone loss caused by estrogen depletion (27). In bone marrow cultures from ovariectomized mice, the increased osteoclast formation could be prevented by 17β-estradiol or by a neutralizing IL-6-antibody (28, 29). It was also reported that IL-6 stimulates RANKL expression in osteoblasts (30), which induces osteoclastogenesis. On the other hand, it was shown that IL-6 inhibits RANKL-induced osteoclast formation and bone resorption (31). These contradictory effects of IL-6 might be attributed to the ambivalent character of this cytokine. IL-6 activates via Jak1/2 several intracellular pathways. Activation of STAT protein pathways induces expression of genes implicated in growth inhibition, apoptosis, and differentiation, whereas activation of MAPK, protein-kinase B (Akt), or PKCδ counterbalances these signals (24, 26). As we have shown previously, Hcys weakly down-regulates cell multiplication, triggers cell differentiation (9), and favors the expression of the pro-apoptotic gene Fas (data not shown). The stimulation of Fli1 expression by IL-6, as described in this work, was shown to be STAT3-dependent but MAPK-independent in erythroleukemia cells (23), suggesting that Hcys-dependent up-regulation of Fli1 and Dnmt1 in MC3T3-E1 cells depends on the STAT pathway.
Analysis of the mouse Dnmt1 promoter revealed three putative binding sites for FLI1 with identical sequence and a structure comparable with the human promoter (19). Truncation of the promoter as well as mutation of the putative FLI1-binding sites demonstrated that all three binding sites were necessary for full expression. As already mentioned, IL-6 activates several intracellular signaling pathways, which can stimulate transcription of DNMT1. In colon cancer cells, IL-6 was also shown to mediate gene silencing via epigenetic DNA methylation by DNMT1 involving STAT signaling (32). In malignant T-lymphocytes, DNMT1 was stimulated by STAT3, which binds to the promoter of DNMT1 (33). Similarly to human erythroleukemia cells (19), in MC3T3-E1 cells we clearly show that IL-6 stimulates Dnmt1 via FLI1. Nevertheless, we cannot fully exclude STAT3-binding sites upstream of the used Dnmt1 promoter fragment, which may regulate Dnmt1 directly. All those data support our finding of an IL-6-induced expression of Dnmt1 by Hcys, which in turn mediates Lox down-regulation (Fig. 13).
FIGURE 13.

Schematic representation of the suggested pathway for the down-regulation of Lox by Hcys. Hcys stimulates IL-6 expression, which in turn activates JAK2 kinase (IL-6 as well as JAK2 kinase can be blocked by an IL-6 Ab as well as by the inhibitor AG490, respectively), leading to an up-regulation of the Dnmt1 transcription factor Fli1. This increases Dnmt1 expression, which provokes promoter methylation of Lox and thus its transcriptional depletion (co-treatment of the cells with the DNA (cytosine-5)-methyltransferase (Dnmt) inhibitor zebularine abrogates Hcys Lox promoter methylation). Consequently, the post-translational collagen cross-link formation is reduced. Abbreviations used are as follows: Hcys, homocysteine; IL-6, interleukin 6; IL-6 Ab, interleukin 6 antibody; IL-6R, interleukin 6 receptor; Fli1, Friend leukemia virus integration 1; Dnmt1, DNA methyltransferase 1; Lox, lysyl oxidase; CH3, methyl group.
Epigenetic DNA methylation controls important cellular events like apoptosis (17, 34) or cell differentiation (35). The influence of Hcys on epigenetic CpG methylation is mainly discussed in light of the role of Hcys as metabolite in the DNA methylation cycle (16). As presented in this study, in pre-osteoblastic MC3T3-E1 cells Hcys increases the expression of genes involved in DNA methylation, namely Dnmt1, Dnmt3b, and Hells, but no regulation was found for the gene Dnmt3a. Hells was suggested to play an important role in bone cells as Hells-depleted mice develop osteopenia and osteoporosis (36). These are interesting aspects as Hells was shown to play a crucial role for a proper CpG methylation by recruiting Dnmt1 and Dnmt3b to promoters (37).
According to the literature, Dnmt1 is mainly related to maintenance of DNA global methylation, whereas Dnmt3a and Dnmt3b are described as de novo DNA methyltransferases (38). However, it was shown that for efficient CpG island methylation of the gene HOXB13, a transcription factor indispensable for vertebrate embryonic development, cooperation of DNMT1 with DNMT3b is essential (39). As we have shown here, inhibition of JAK2 eliminates Hcys-dependent Fli1 and thus Dnmt1 stimulation and abolishes Hcys-mediated Lox down-regulation. These results underline the necessity of both JAK2 and Dnmt1 for Hcys-dependent Lox methylation. Therefore, we hypothesize that besides the role of Dnmt1 as keeper of global DNA methylation, under certain circumstances specific DNA methylation involves Dnmt1.
As already mentioned, Hcys inhibits LOX (7) enzymatic activity similarly to lathyrogens like β-aminopropionitrile and affects bone quality because of disturbed cross-linking (14). As shown previously (9, 10) and as demonstrated here, the effect of Hcys on collagen cross-link formation does not exclusively rely on Hcys enzymatic inhibition of LOX. Besides its function in collagen cross-linking, the N-terminal peptide of Lox acts as a tumor suppressor. In tumors, Lox expression is prevented by CpG methylation of the promoter as shown in humans (40–42) and mice (34). Treatment of MC3T3-E1 cells with zebularine, an inhibitor of DNA methyltransferases, prevented attenuation of Lox by Hcys. Methylation analysis of the Lox promoter revealed that treatment of MC3T3-E1 cells with Hcys increased promoter methylation of a CpG-rich region around the transcription start, which represents a common epigenetic mechanism involved in silencing of gene expression (17, 34).
In conclusion, we demonstrate that Hcys stimulates IL-6 synthesis, which could modulate osteoclast development and differentiation via a general inflammatory response or by direct activation resulting in increased bone resorption. Moreover, Hcys inhibits proper collagen cross-linking biochemically by inhibiting LOX enzymatic activity, and as demonstrated here, it attenuates Lox expression epigenetically via IL-6, JAK2, Fli, and Dnmt1 leading to decreased bone matrix quality (14). All these findings, including accelerated differentiation of osteoblasts by Hcys (9, 10), could explain high bone turnover in some patients with elevated Hcys serum levels (43). This also has significant implications for other cells and tissues. Silencing of Lox in skin and blood vessels, for example, could reduce tissue strength. Finally, this gene acts as a tumor suppressor in several tissues. Our findings add new mechanistic insights to the role of Hcys as a risk factor for bone health.
This work was supported by the Fonds zur Foerderung der Wissenschaftlichen Forschung from the Austrian Science Fund Project P20646-B11, the Social Health Insurance Vienna, and the Austrian Social Insurance for Occupational Risk.
- Hcys
- homocysteine
- Lox
- lysyl oxidase
- qRT
- quantitative RT
- Hells
- helicase, lymphoid-specific
- STAT
- signal transducer and activator of transcription.
REFERENCES
- 1. Iannucci C. V., Capoccia D., Calabria M., Leonetti F. (2007) Curr. Pharm. Des. 13, 2148–2168 [DOI] [PubMed] [Google Scholar]
- 2. Audelin M. C., Genest J., Jr. (2001) Atherosclerosis 159, 497–511 [DOI] [PubMed] [Google Scholar]
- 3. Raisz L. G. (2004) N. Engl. J. Med. 350, 2089–2090 [DOI] [PubMed] [Google Scholar]
- 4. McLean R. R., Jacques P. F., Selhub J., Tucker K. L., Samelson E. J., Broe K. E., Hannan M. T., Cupples L. A., Kiel D. P. (2004) N. Engl. J. Med. 350, 2042–2049 [DOI] [PubMed] [Google Scholar]
- 5. van Meurs J. B., Dhonukshe-Rutten R. A., Pluijm S. M., van der Klift M., de Jonge R., Lindemans J., de Groot L. C., Hofman A., Witteman J. C., van Leeuwen J. P., Breteler M. M., Lips P., Pols H. A., Uitterlinden A. G. (2004) N. Engl. J. Med. 350, 2033–2041 [DOI] [PubMed] [Google Scholar]
- 6. Gjesdal C. G., Vollset S. E., Ueland P. M., Refsum H., Meyer H. E., Tell G. S. (2007) J. Bone Miner. Res. 22, 747–756 [DOI] [PubMed] [Google Scholar]
- 7. Liu G., Nellaiappan K., Kagan H. M. (1997) J. Biol. Chem. 272, 32370–32377 [DOI] [PubMed] [Google Scholar]
- 8. Raposo B., Rodríguez C., Martínez-González J., Badimon L. (2004) Atherosclerosis 177, 1–8 [DOI] [PubMed] [Google Scholar]
- 9. Thaler R., Spitzer S., Rumpler M., Fratzl-Zelman N., Klaushofer K., Paschalis E. P., Varga F. (2010) Bone 46, 703–709 [DOI] [PubMed] [Google Scholar]
- 10. Turecek C., Fratzl-Zelman N., Rumpler M., Buchinger B., Spitzer S., Zoehrer R., Durchschlag E., Klaushofer K., Paschalis E. P., Varga F. (2008) Calcif. Tissue Int. 82, 392–400 [DOI] [PubMed] [Google Scholar]
- 11. Claes L., Schmalenbach J., Herrmann M., Olkü I., Garcia P., Histing T., Obeid R., Schorr H., Herrmann W., Pohlemann T., Menger M. D., Holstein J. H. (2009) Calcif. Tissue Int. 85, 17–21 [DOI] [PubMed] [Google Scholar]
- 12. Leboff M. S., Narweker R., LaCroix A., Wu L., Jackson R., Lee J., Bauer D. C., Cauley J., Kooperberg C., Lewis C., Thomas A. M., Cummings S. (2009) J. Clin. Endocrinol. Metab. 94, 1207–1213 [DOI] [PMC free article] [PubMed] [Google Scholar]
- 13. Zhu K., Beilby J., Dick I. M., Devine A., Soós M., Prince R. L. (2009) Osteoporos Int. 20, 1183–1191 [DOI] [PubMed] [Google Scholar]
- 14. Blouin S., Thaler H. W., Korninger C., Schmid R., Hofstaetter J. G., Zoehrer R., Phipps R., Klaushofer K., Roschger P., Paschalis E. P. (2009) Bone 44, 959–964 [DOI] [PubMed] [Google Scholar]
- 15. Esteller M., Herman J. G. (2002) J. Pathol. 196, 1–7 [DOI] [PubMed] [Google Scholar]
- 16. Yi P., Melnyk S., Pogribna M., Pogribny I. P., Hine R. J., James S. J. (2000) J. Biol. Chem. 275, 29318–29323 [DOI] [PubMed] [Google Scholar]
- 17. Thaler R., Karlic H., Spitzer S., Klaushofer K., Varga F. (2010) Apoptosis 15, 728–737 [DOI] [PubMed] [Google Scholar]
- 18. Pfaffl M. W. (2001) Nucleic Acids Res. 29, e45. [DOI] [PMC free article] [PubMed] [Google Scholar]
- 19. Hodge D. R., Xiao W., Clausen P. A., Heidecker G., Szyf M., Farrar W. L. (2001) J. Biol. Chem. 276, 39508–39511 [DOI] [PubMed] [Google Scholar]
- 20. Kishikawa S., Murata T., Kimura H., Shiota K., Yokoyama K. K. (2002) Eur. J. Biochem. 269, 2961–2970 [DOI] [PubMed] [Google Scholar]
- 21. Kanehisa M., Araki M., Goto S., Hattori M., Hirakawa M., Itoh M., Katayama T., Kawashima S., Okuda S., Tokimatsu T., Yamanishi Y. (2008) Nucleic Acids Res. 36, D480–D484 [DOI] [PMC free article] [PubMed] [Google Scholar]
- 22. Kanehisa M., Goto S. (2000) Nucleic Acids Res. 28, 27–30 [DOI] [PMC free article] [PubMed] [Google Scholar]
- 23. Hodge D. R., Li D., Qi S. M., Farrar W. L. (2002) Biochem. Biophys. Res. Commun. 292, 287–291 [DOI] [PubMed] [Google Scholar]
- 24. Blanchard F., Duplomb L., Baud'huin M., Brounais B. (2009) Cytokine Growth Factor Rev. 20, 19–28 [DOI] [PubMed] [Google Scholar]
- 25. Wong P. K., Campbell I. K., Egan P. J., Ernst M., Wicks I. P. (2003) Arthritis Rheum. 48, 1177–1189 [DOI] [PubMed] [Google Scholar]
- 26. Franchimont N., Wertz S., Malaise M. (2005) Bone 37, 601–606 [DOI] [PubMed] [Google Scholar]
- 27. Poli V., Balena R., Fattori E., Markatos A., Yamamoto M., Tanaka H., Ciliberto G., Rodan G. A., Costantini F. (1994) EMBO J. 13, 1189–1196 [DOI] [PMC free article] [PubMed] [Google Scholar]
- 28. Jilka R. L., Hangoc G., Girasole G., Passeri G., Williams D. C., Abrams J. S., Boyce B., Broxmeyer H., Manolagas S. C. (1992) Science 257, 88–91 [DOI] [PubMed] [Google Scholar]
- 29. Schiller C., Gruber R., Redlich K., Ho G. M., Katzgraber F., Willheim M., Pietschmann P., Peterlik M. (1997) Endocrinology 138, 4567–4571 [DOI] [PubMed] [Google Scholar]
- 30. Karmakar S., Kay J., Gravallese E. M. (2010) Rheum. Dis. Clin. North Am. 36, 385–404 [DOI] [PMC free article] [PubMed] [Google Scholar]
- 31. Duplomb L., Baud'huin M., Charrier C., Berreur M., Trichet V., Blanchard F., Heymann D. (2008) Endocrinology 149, 3688–3697 [DOI] [PubMed] [Google Scholar]
- 32. Foran E., Garrity-Park M. M., Mureau C., Newell J., Smyrk T. C., Limburg P. J., Egan L. J. (2010) Mol. Cancer Res. 8, 471–481 [DOI] [PubMed] [Google Scholar]
- 33. Zhang Q., Wang H. Y., Woetmann A., Raghunath P. N., Odum N., Wasik M. A. (2006) Blood 108, 1058–1064 [DOI] [PMC free article] [PubMed] [Google Scholar]
- 34. Gazin C., Wajapeyee N., Gobeil S., Virbasius C. M., Green M. R. (2007) Nature 449, 1073–1077 [DOI] [PMC free article] [PubMed] [Google Scholar]
- 35. Dean W., Santos F., Reik W. (2003) Semin. Cell Dev. Biol. 14, 93–100 [DOI] [PubMed] [Google Scholar]
- 36. Sun L. Q., Lee D. W., Zhang Q., Xiao W., Raabe E. H., Meeker A., Miao D., Huso D. L., Arceci R. J. (2004) Genes Dev. 18, 1035–1046 [DOI] [PMC free article] [PubMed] [Google Scholar]
- 37. Myant K., Stancheva I. (2008) Mol. Cell. Biol. 28, 215–226 [DOI] [PMC free article] [PubMed] [Google Scholar]
- 38. Bestor T. H. (2000) Hum. Mol. Genet. 9, 2395–2402 [DOI] [PubMed] [Google Scholar]
- 39. Ghoshal K., Motiwala T., Claus R., Yan P., Kutay H., Datta J., Majumder S., Bai S., Majumder A., Huang T., Plass C., Jacob S. T. (2010) PLoS One 5, e10338. [DOI] [PMC free article] [PubMed] [Google Scholar] [Retracted]
- 40. Kaneda A., Wakazono K., Tsukamoto T., Watanabe N., Yagi Y., Tatematsu M., Kaminishi M., Sugimura T., Ushijima T. (2004) Cancer Res. 64, 6410–6415 [DOI] [PubMed] [Google Scholar]
- 41. So K., Tamura G., Honda T., Homma N., Waki T., Togawa N., Nishizuka S., Motoyama T. (2006) Cancer Sci. 97, 1155–1158 [DOI] [PMC free article] [PubMed] [Google Scholar]
- 42. Tamura G., So K., Miyoshi H., Honda T., Nishizuka S., Motoyama T. (2009) Pathol. Int. 59, 895–899 [DOI] [PubMed] [Google Scholar]
- 43. Gerdhem P., Ivaska K. K., Isaksson A., Pettersson K., Väänänen H. K., Obrant K. J., Akesson K. (2007) J. Bone Miner. Res. 22, 127–134 [DOI] [PubMed] [Google Scholar]