

Abstract
Echogenic liposomes (ELIP) were developed as ultrasound-triggered targeted drug or gene delivery vehicles (Lanza et al., 1997; Huang et al., 2001). Recombinant tissue-type Plasminogen Activator (rt-PA), a thrombolytic, has been loaded into ELIP (Tiukinhoy-Laing et al., 2007). These vesicles have the potential to be used for ultrasound-enhanced thrombolysis in the treatment of acute ischemic stroke, myocardial infarction, deep vein thrombosis, or pulmonary embolus. A clinical diagnostic ultrasound scanner (Philips HDI 5000) equipped with a linear array transducer (L12-5) was employed for in vitro studies using rt-PA-loaded ELIP (T-ELIP). The goal of this study was to quantify ultrasound-triggered drug release from rt-PA-loaded echogenic liposomes. T-ELIP samples were exposed to 6.9-MHz B-mode pulses at a low pressure amplitude (600 kPa) to track the echogenicity over time under four experimental conditions: 1) flow alone to monitor gas diffusion from the T-ELIP, 2) pulsed 6.0-MHz color Doppler exposure above the acoustically driven threshold (0.8 MPa) to force gas out of the liposome gently, 3) pulsed 6.0-MHz color Doppler above the rapid fragmentation threshold (2.6 MPa), or 4) Triton X-100 to rupture the T-ELIP chemically as a positive control. Release of rt-PA for each ultrasound exposure protocol was assayed spectrophotometrically. T-ELIP were echogenic in the flow model (5 ml/min) for thirty minutes. The thrombolytic drug remained associated with the liposome when exposed to low-amplitude B-mode pulses over 60 min and was released when exposed to color Doppler pulses or Triton X-100. The rt-PA released from the liposomes had similar enzymatic activity as the free drug. These T-ELIP are robust and echogenic during continuous fundamental 6.9-MHz B-mode imaging at a low exposure output level (600 kPa). Furthermore, a therapeutic concentration of rt-PA can be released by fragmenting the T-ELIP with pulsed 6.0-MHz color Doppler ultrasound above the rapid fragmentation threshold (1.59 MPa).
Keywords: ultrasound-enhanced thrombolysis, drug delivery, therapeutic ultrasound, echogenic liposomes, ultrasound contrast agents, destruction thresholds
INTRODUCTION
Ultrasound contrast agents (UCAs) composed of microbubbles stabilized by a biocompatible material, such as a lipid, protein or polymer (Van Liew and Burkard, 1996; Bouakaz and de Jong, 2007) are currently used in the United States for left ventricular opacification and for enhanced endocardial border delineation. Second-generation UCAs contain low solubility, high molecular weight gases such as perfluorocarbon (Porter and Xie, 1995). Optison®, an UCA approved by the United States Food and Drug Administration, has a mean diameter of 2.5 to 4.5 microns and with an octofluoropropane gas core. The gas core enhances the impedance mismatch between tissue and blood causing the bloodstream to appear brighter. Phospholipid vesicles, or liposomes, are of great interest because of their potential use as targeted drug delivery vehicles (Huang, 2008a; Torchilin, 2009).
Echogenic liposomes (ELIP) were developed to be both an ultrasound contrast agent and ultrasound-activated drug delivery vehicle as depicted in Figure 1. The ELIP shell is mechanically stabilized with biocompatible phospholipids for increased persistence in the bloodstream. ELIP are more stable against diffusion in a liquid medium than albumin-shelled Optison® microspheres (Smith et al., 2007). Air micro- or nanobubbles and drug are incorporated into ELIP for contrast imaging. In addition, these microbubbles can nucleate acoustic cavitation during the pressure rarefaction of an ultrasound pulse (Apfel and Holland, 1991). This concentration of mechanical energy can be potentially harnessed for therapeutic benefit (i.e. sonothrombolysis, drug or gene delivery, sonoporation). Upon exposure to suitable ultrasound pulses, activation of the encapsulated bubbles triggers the liposome shell disruption and concomitant release of the drug (Huang, 2008a).
Figure 1.
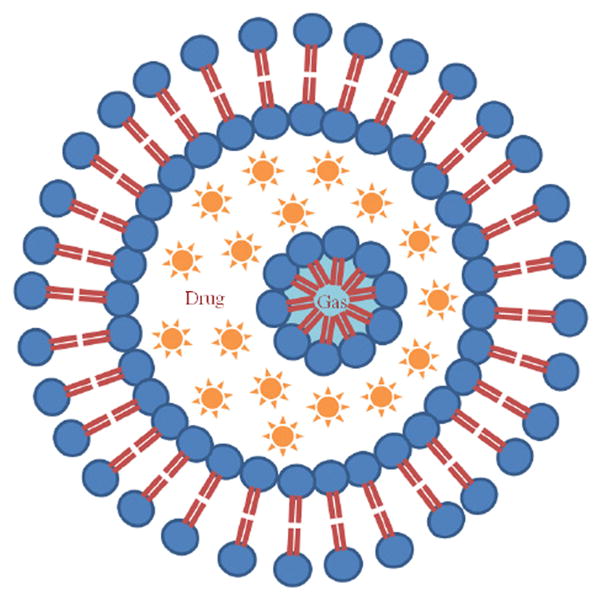
Proposed structure of an echogenic liposome (ELIP) with an outer phospholipid bilayer. A lipid monolayer shell surrounds a gas bubble in the internal aqueous compartment of the liposome. The gas core provides the acoustic impedance mismatch necessary for ELIP to be used as contrast agents in diagnostic ultrasound imaging. Note that the aqueous contents, shown as an encapsulated drug, may be triggered to release by an ultrasound pulse.
Pulsed ultrasound, when used as an adjuvant to recombinant tissue-type plasminogen activator (rt-PA), has been shown to enhance thrombolysis. Ultrasound-enhanced thrombolysis (UET) for the treatment of thrombo-occlusive disease (i.e. acute myocardial infarction, deep vein thrombosis, acute ischemic stroke) is becoming an increasingly attractive concept due to the promising results of the recent randomized international multicenter phase II CLOTBUST (Combined Lysis of Thrombus in Brain Ischemia Using Transcranial Ultrasound and Systemic T-PA) trials (Alexandrov, 2006). These trials have concluded that 2.0-MHz transcranial Doppler (TCD) ultrasound, used to monitor the recanalization of the occluded intracranial artery, may potentiate the thrombolytic effect of systemic intravenous infusion of rt-PA in acute ischemic stroke patients (within the first 3 hours of stroke onset). In another clinical trial, boluses of galactose-based air-filled microbubbles (Levovist™) were administered along with the rt-PA infusion and 2.0-MHz TCD monitoring which resulted in more complete recanalization (Molina et al., 2006). The CLOTBUST-PRO (PROspective) trials are currently being conducted to ascertain if early recanalization within 1 hour of stroke onset using both rt-PA infusion and TCD monitoring correlates with better short-term outcome (Saqqur et al., 2008). Therefore, UET has the potential to treat a wider pool of patients suffering from acute ischemic stroke thus decreasing the likelihood and cost of long-term or permanent disability.
Novel rt-PA-loaded ELIP, or T-ELIP, were developed to aid the visualization of the site of arterial occlusion and release rt-PA locally (Tiukinhoy-Laing et al., 2007; Huang et al., 2008b). Feasibility of loading rt-PA into ELIP was demonstrated with a maximum loading efficiency of 50%. Of the 50%, 15% of the rt-PA was truly encapsulated in the liposomes, whereas 35% was associated with the lipid bilayer. Thus, the term, ‘loaded’, for describing T-ELIP refers to both the rt-PA associated with the lipid bilayer, as well as the full encapsulation of the drug within the liposomal aqueous phase (Heeremans et al., 1995). A maximum of 200 ± 16 μg of rt-PA can be loaded per 8.2 ± 0.6 mg of liposomal lipid (Tiukinhoy-Laing et al., 2007). Kopechek et al. (2009) assessed preparations of nondrug-loaded echogenic liposomes in 0.5% bovine serum albumin via dynamic light scattering and the Coulter principle. These nondrug-loaded echogenic liposomes exhibited a broad size distribution ranging from 40 nm to 6 μm with a peak number density at 59 nm (Kopechek et al., 2009).
Chomas et al. (2001) were the first to demonstrate three mechanisms of contrast agent destruction experimentally: static diffusion, acoustically driven diffusion, and rapid fragmentation. Static diffusion is the slow diffusion of gas across the stabilizing shell into the surrounding liquid medium (Kalbanov et al., 1998). Acoustically driven diffusion is the forced change in diameter of the bubble (due to insonification) resulting in an increased gas diffusion rate and a decreased dissolution time. Rapid fragmentation is the complete disruption of the surrounding shell in microseconds due to the transmitted ultrasound pulse. Fragmentation of a contrast agent may cause one or a combination of the following to occur: complete diffusion of the encapsulated gas, breaking the shell into smaller fragments (Chomas et al., 2001), coalescence of small bubbles released (Postema et al., 2004), or the release of a free gas bubble (Bouakaz et al., 2005; Bevan et al., 2008).
The objective of these in vitro studies was to investigate the potential of T-ELIP for image-guided ultrasound-triggered drug delivery. The release of rt-PA from T-ELIP exposed to 6.0-MHz color Doppler ultrasound pulses was quantified and the concomitant loss in echogenicity was assessed over time using a flow model and a clinical diagnostic ultrasound scanner. By utilizing a clinical scanner, the use of color Doppler ultrasound (a scanned mode) enables a larger number of ELIP to be exposed per unit time than spectral Doppler (an unscanned mode). The size distribution of T-ELIP was also assessed using the Coulter principle.
MATERIALS AND METHODS
The stability of T-ELIP echogenicity was assessed using diagnostic B-mode imaging at 4.5-MHz. The acoustic behavior of T-ELIP was compared to nondrug-loaded ELIP and Optison® microbubbles (Amersham Health, Princeton, NJ, USA). In addition, the destruction thresholds (acoustically driven diffusion and rapid fragmentation) were determined for static T-ELIP suspensions in an anechoic chamber exposed to pulsed Doppler imaging at 6.0-MHz at one fixed pulse duration (PD) and pulse repetition frequency (PRF) combination.
An in vitro flow model was developed to circulate T-ELIP in a suspension of 0.5% bovine serum albumin (BSA) at 37 °C with a constant flow rate through an ultrasound exposure volume to evaluate changes in T-ELIP echogenicity and rt-PA release over time. A flow rate of 5 ml/min was chosen to circulate the entire 7 ml T-ELIP suspension twice through a 3.2 mm × 16.5 mm color Doppler window within three minutes. Ultrasound exposure conditions corresponding to the three regimes of UCA destruction were employed. Each T-ELIP suspension was exposed to low pressure amplitude (600 kPa) B-mode imaging to track the echogenicity for up to one hour under one of the following exposure conditions: 1) flow alone to monitor gas diffusion from the T-ELIP 2) pulsed 6.0-MHz color Doppler exposure above the acoustically driven threshold (Pr = 0.8 MPa), 3) pulsed 6.0-MHz color Doppler above the rapid fragmentation threshold (Pr = 2.6 MPa), or 4) Triton X-100 to rupture the T-ELIP chemically as a positive control.
Preparation of T-ELIP
Nondrug-loaded ELIP were prepared at UTHSC by the same sonication-lyophilization-rehydration method in previously published studies (Huang et al., 2001; Huang and MacDonald, 2004). However, a different liposomal composition of dipalmitoylphosphatidylcholine (DPPC), dioleoylphosphatidylcholine (DOPC), dipalmitoylphosphatidylglycerol (DPPG) and cholesterol (CH) in a 46:24:24:6 molar ratio was used. It was found that this composition optimized the stability and echogenicity of the liposomes (Buchanan et al., 2008). The component lipids were dissolved in chloroform and the solvent was allowed to evaporate completely. The resulting lipid film was placed under vacuum for complete removal of the solvent and hydrated with distilled, deionized water. This dispersion was sonicated for five minutes. D-mannitol (0.2 M) was added to the liposome suspension and the sample was frozen at −70 °C. The samples were lyophilized for 48 hours and re-suspended with 0.1 M PBS. The final concentration used for the dilution was 10 mg lipid/ml PBS. Recombinant tissue-plasminogen activator (Activase™, Genentech Inc., San Francisco, CA) was used as the thrombolytic agent. For the T-ELIP preparation, 1 mg/ml of rt-PA solution was used for the initial rehydration of the lipid film. Recombinant tissue-plasminogen activator (rt-PA) associated with lipid was separated from the free rt-PA by centrifugation at 16,000 rpm for 10 minutes at 37 °C (Tiukinhoy-Laing et al., 2007).
The hydrated mixture was sonicated in a water bath for five minutes. An equal volume of 0.32 M mannitol was thereafter added. The lipid dispersion was divided into 6 mg aliquots and frozen for 2 hours at −70 °C. The frozen samples were immediately lyophilized under a vacuum of 50 mTorr with a condensation chamber temperature of −50 °C for 24 hours (Huang et al., 2002). Each sample contained 6 mg lipid and 240 μg of rt-PA. The samples were shipped (by overnight delivery service with ice packs) to the University of Cincinnati ultrasound laboratory where they were immediately stored in a refrigerator at 3.5 ± 1.5 °C until needed.
Stability and Destruction Thresholds of rt-PA-loaded ELIP
The acoustic behavior of T-ELIP was compared with nondrug-loaded ELIP or Optison®. The loss of echogenicity from static T-ELIP suspensions were monitored over 5 minutes by a Philips HDI 5000 diagnostic ultrasound scanner equipped with a calibrated L12-5 linear array transducer (Philips Medical Systems, Bothell, WA, USA) mounted on a three-axis positioner over an anechoic chamber as previously described (Smith et al., 2007). T-ELIP were suspended in 0.5% BSA at room temperature (20.5 ± 0.5 °C). The size distribution of one sample of reconstituted T-ELIP at a lipid concentration of 0.0025 mg/ml in 0.5% BSA was assessed with a Multisizer 3 (Beckman Coulter, Inc., Miami, FL, USA) equipped with a 20-μm aperture and a Zetasizer Nano ZS (Malvern, Westborough, MA, USA). First, the stability of T-ELIP was compared to ELIP and Optison® microbubbles over five minutes using continuously scanned 4.5-MHz harmonic B-mode pulses at low acoustic pressure (Mechanical Index, MI = 0.04; peak rarefactional pressure, Pr = 0.12 MPa). In addition, the destruction thresholds (acoustically driven diffusion and rapid fragmentation) for T-ELIP exposed to 6.0-MHz Doppler pulses at one fixed PD and PRF combination (PD = 3.33 μs and PRF = 1.25 kHz) for 30 seconds were determined and compared to destruction thresholds for nondrug-loaded ELIP at the same PD and PRF combination used in a previously published study (Smith et al., 2007).
For each ultrasound contrast sample, 0.5% BSA was pipetted into the anechoic chamber for proper transducer alignment. Optison® microspheres were pipetted into PBS to yield a clinical concentration of 5 to 8 × 10⁴ microspheres/ml (Coussios et al., 2004; Porter et al., 2006). The position of the L12-5 linear array was adjusted axially so that the acoustic stand-off layer appeared in the image 1.4 cm from the transducer face. The focal depth was placed at 1.0 cm from the transducer face. All T-ELIP suspensions were prepared by reconstituting 6 mg of lyophilized liposomes in 0.6 ml of 0.2 μm filtered, deionized water with resistivity of 17.8 MΩ·cm (NANOpure® Type I Water Purification System, Barnstead International, Dubuque, IA, USA) saturated with air (100% oxygen saturation at 20.5 ± 0.5 °C; Oakton® Dissolved Oxygen 100 Series meter, Oakton Instruments, Vernon Hills, IL, USA). The reconstituted T-ELIP (10 mg lipid/ml and 400 μg rt-PA/ml) were pipetted into BSA to yield a final lipid concentration of 0.125 mg/ml and rt-PA concentration of 5 μg/ml. This rt-PA concentration was chosen to be within the therapeutic concentration range in humans of 1 to 10 μg/ml (Seifried et al., 1989; Tanswell et al., 1991). The number density of nondrug-loaded ELIP at this particular lipid concentration is estimated to be 1.7 × 10⁸ liposomes/ml, based on flow cytometry data (Coussios et al., 2004). The peak number density of ELIP is known to be smaller than Optison® microbubbles; therefore, a higher concentration of ELIP is needed to achieve a similar back scattering cross-section (Coussios et al., 2004).
All ultrasound contrast samples were stirred gently by hand with a pipette tip and left to settle in the anechoic chamber for approximately 20 to 30 seconds prior to insonification to allow bulk fluid motion to cease. No stirring of the sample was performed thereafter. Each experiment was repeated at least five times with a fresh contrast agent suspension to assess variability. Freeze-captured grayscale images were acquired for the duration of each ultrasound exposure. The mean gray scale value (MGSV) within a ROI of each freeze-captured image was quantified and converted to a mean digital intensity (MDI) using a polynomial equation determined from a tissue-mimicking phantom (Multipurpose Phantom, ATS Laboratories, Inc, Bridgeport, CT) (Smith et al., 2007).
Gas Diffusion from T-ELIP in Suspension
To determine the T-ELIP stability in suspension and to ensure that B-mode pulses with MI < 0.04 did not cause liposome destruction, echogenicity data was gathered over time for continuously scanned suspensions. The exposure output (MI) for the stability studies was chosen below the acoustically driven diffusion threshold for nondrug-loaded ELIP suspensions insonified with harmonic B-mode pulses at a center frequency of 4.5-MHz (MI = 0.04; Pr = 0.12 MPa) using a customized HDI 5000 setting. Images were captured every 5 seconds for 120 seconds, and then every 10 seconds thereafter for the next 180 seconds for a total of 43 freeze-captured images. For every harmonic B-mode image, a 20-mm2 ROI was analyzed to determine a MGSV value using NIH ImageJ software (National Institutes of Health, Bethesda, MD, USA). The MGSV was converted to an MDI value using the polynomial equation y = − (3.0 × 10−4)x2 + (1.8 × 10⁻¹)x. Furthermore, a comparison of the gas diffusion in static suspensions of nondrug- loaded ELIP, T-ELIP or Optison® was performed by including data previously acquired (Smith et al., 2007). MDI versus time curves were both normalized to the MDI at time zero and not normalized in order to illustrate the difference in the initial scattering amplitudes of these three UCAs.
Destruction Thresholds of T-ELIP exposed to duplex Doppler Imaging
The echogenicity of T-ELIP suspensions exposed to 6.0-MHz duplex Doppler imaging pulses was measured over time for a range of output levels (0.04 ≤ MI ≤ 0.43) at a fixed PD of 3.33 μs and PRF of 1.25 kHz using a customized HDI 5000 setting. The lower limit MI limit of 0.04 was selected because at this output level an image could be rendered. The upper MI limit of 0.43 was the maximum output attainable for the specific PRF and image depth setting. Images were captured at 5 s intervals for 30 seconds. The change in echogenicity was analyzed within each ROI equal to the Doppler sample volume for each image frame as a function of time using NIH ImageJ software and converted to an MDI value using the same polynomial equation as defined above. The MDI values over time were normalized to the MDI at time zero for each applied pressure. To quantify the decay rate of each curve, a least-squares fit of the data to an exponential decay function of the form Ae−kt + N was performed, where A + N is the amplitude at time zero, N is the background echogenicity, or noise in the image data, k is the decay constant, and t is time (Porter et al., 2006; Smith et al., 2007). The correlation coefficient, R2, for each fit was also computed using Microsoft Excel® (Microsoft Corporation, Redmond, WA, USA) software.
To determine the pressure threshold for acoustically driven diffusion, statistical analysis was performed on the B-mode image data acquired with different acoustic pressure amplitudes as previously described (Smith et al., 2007). Each B-mode data set (MDI versus time) was subtracted from the least-squares fit for echogenicity data taken for the next lowest exposure amplitude. A two-sample unequal variance Student’s t-test was performed on these calculated difference sets for adjacent acoustic exposure outputs. The pressure threshold for acoustically driven diffusion was defined as the first peak rarefactional pressure (Pr) that resulted in a data set that was significantly different statistically from the experimental run with lower acoustic pressure amplitude (p < 0.01). The pressure threshold for rapid fragmentation was defined as the first Pr for which the MDI reduced to the background level (normalized MDI < 0.2) in the second freeze-captured image at five seconds (Smith et al., 2007).
Evaluation of the Release of rt-PA from T-ELIP Exposed to Color Doppler Ultrasound in a Flow Model
A custom-built in vitro flow model was developed to circulate T-ELIP in a suspension of 0.5% bovine serum albumin (BSA) through tubing in a water-filled tank. Similar image acquisition (Philips HDI 5000 and L12-5 linear array) and post-processing techniques as previously described (Porter et al., 2006; Smith et al., 2007) were used to determine a quantitative measure of echogenicity within a ROI in an image of T-ELIP suspensions over time. In addition to tracking the T-ELIP echogenicity in the flow model, a portion of the suspension was recovered at various timed points to determine the rt-PA concentration using a spectrophotometric method.
Exposure Flow Model
The experimental setup for the flow model is diagrammed in Figure 2. T-ELIP suspensions were pumped at 5 ml/min through latex tubing (inner diameter, ID = 1/8 in, outer diameter, OD = 3/16 in, wall thickness = 1/32 in, McMaster-Carr, Atlanta, GA, USA) using a peristaltic pump (Rabbit, Model RP-1, Rainin, France) with PVC tubing (ID = 1/8 in) for the pump rollers during operation. The flow rate of the pump was calibrated from 5 to 16 ml/min using graduated cylinders and a stop watch. One end of the latex tubing was connected to PVC tubing coursing through the peristaltic pump while the other end was attached to a Luer-lock three-way stopcock. A 10 cm segment of the latex tubing was submersed in a 30 × 15 × 20-cm3 glass aquarium tank (Perfecto Manufacturing, Inc., Noblesville, IN, USA) filled with 0.2 μm filtered deionized water with resistivity of 17.8 MΩ·cm (NANOpure® Type I Water Purification System, Barnstead International, Dubuque, IA, USA). The total volume of fluid for the entire tubing length of 100 cm (latex and PVC) was 7.0 ml. The L12-5 linear array transducer was mounted to a three-axis positioner (not shown in Figure 2) over the tank. The transducer face was submerged 3.5 cm above the model. Acoustic absorbing material (AptFlex F28, Precision Acoustics Ltd, Dorchester, UK) was placed below the latex tubing to prevent acoustic reflections. The tubing was held in place by aquarium plastic air hose clips with suction cups attached to the acoustic absorbing material. Water in the tank was maintained at a temperature of 37 ± 1 °C using three small aquarium heaters (50 W, Hagen, Mansfield, USA). The temperature of the water was continuously monitored by an immersed aquarium temperature probe (Rainbow LifeGard®/Pentair Aquatics, El Monte, CA, USA).
Figure 2.

Schematic of the in vitro flow model. ELIP or T-ELIP suspensions were pumped through tubing using a peristaltic pump at 5 ml/min. A 10 cm portion of the latex tubing was submersed in an aquarium tank of 0.2 μm filtered, deionized water and the transducer face of a Philips L12-5 linear array was immersed 3.5 cm above the model. Acoustic absorber material was placed 1.5 cm below the model to prevent the reflection of ultrasound. Aquarium heaters were placed inside the tank to keep water temperature at 37 °C. T-ELIP suspensions were collected into a disposable cuvette at various timed points using a three-way valve.
Initially, the latex tube, filled with 0.5% BSA, was aligned within the scanner image display before conducting experiments. The position of the L12-5 linear array was adjusted axially so that the center of the latex tube appeared in the image 3.7 cm from the transducer face. At time equal to zero, the liposomes were reconstituted and transferred to a 10 ml syringe connected to a three-way stopcock within the flow model. The peristaltic pump was turned on two minutes after the liposomes were reconstituted, the UCA suspension was gently infused into the flow model, and a baseline B-mode image was acquired using a low acoustic output (Pr = 600 kPa, MI = 0.04). After circulating each T-ELIP suspension through the flow model for a fixed period of time, 1.9 ml aliquots were collected into a disposable cuvette for subsequent spectrophotometric analysis using a separate three-way valve at 5, 15, 30, 45, or 60 min after ELIP reconstitution. T-ELIP suspensions were imaged again using the same parameters just prior to collection of T-ELIP for spectrophotometric analysis.
Transducer Calibration for color Doppler Imaging
The transducer output was calibrated with a 40-μm needle hydrophone (Precision Acoustics, Ltd., Dorchester, UK). In fundamental B-mode, the probe transmitted multiple single cycle pulses with a center frequency of 6.9 MHz. In color Doppler mode, the probe transmitted pulses with a center frequency of 6.0 MHz. The fixed color Doppler window encompassed the entire lumen of the latex tube of the flow model as depicted in Figure 3. An MI of 0.7 was the maximum output attainable for a PRF of 1.0 kHz and image depth setting of 4.8 cm. This MI of 0.7 corresponded to a Pr of 1.7 MPa which was well above the rapid fragmentation threshold for nondrug-loaded ELIP suspensions insonified at 6.0-MHz (Pr = 1.59 MPa) as previously described (Smith et al., 2007). Similarly, an MI of 0.22 corresponded to a Pr of 0.6 MPa which is above the acoustically driven threshold for nondrug-loaded ELIP suspensions insonified at 6.0-MHz (Pr = 0.56 MPa).
Figure 3.
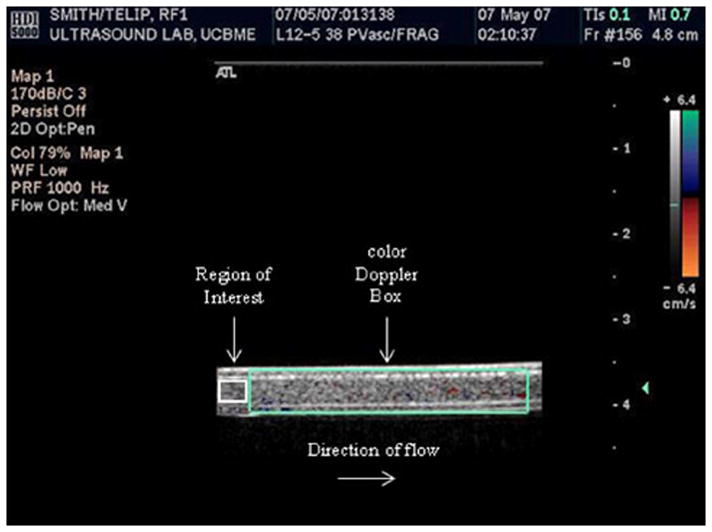
Freeze-captured image of T-ELIP circulating in the flow model. The probe was transmitting maximal color Doppler pulses (fc = 6.0 MHz) with simultaneous fundamental B-mode pulses (fc = 6.9 MHz). The fixed color Doppler window (large teal box) encompassed the entire lumen of the latex tube and a 12-mm2 region of interest was drawn within the lumen of the latex tube (small white box). Note that flow was from left to right in this image. fc = center frequency
The latex tubing used in the flow model was placed in the calibration tank to quantitate the sound transmission loss of the 6.0-MHz Doppler pulses transmitted by the L12-5 linear array using a 0.2-mm diameter needle hydrophone (Precision Acoustics, Ltd., Dorchester, UK). It was found that 79 ± 4% of the sound beam was transmitted through the latex wall. Thus, an in situ MI of 0.7 corresponded to a Pr of 2.6 MPa and an in situ MI of 0.22 corresponded to a Pr of 0.8 MPa.
Calibration of rt-PA Concentration Using a Spectrophotometric Method
The Verheijen method (1985) was used to quantify the concentration of active rt-PA present in aliquots of the T-ELIP suspension. Recombinant tissue-type plasminogen activator is a serine protease that hydrolyzes tripeptide chromogenic substrates. The rt-PA activity was determined by measuring the rate at which p-nitroaniline (pNA) was released from the substrate and the amount of pNA formed was measured spectrophotometrically at 405 nm. The enzyme, rt-PA, is maximally active at 37 °C with the chromogenic substrate (Hemker, 1983). The correlation between the change in absorbance per minute (ΔA/min) and the rt-PA activity is linear (Verheijen et al., 1985).
An rt-PA concentration curve was determined to enable conversion of spectrophotometric data (ΔA/min) to rt-PA concentration (μg/ml) using a chromogenic substrate (S-2288, Chromogenix, DiaPharma Group, Inc., Westchester, OH, USA) and solutions free rt-PA (Chmlelewska and Wlman, 1986). The contribution of the encapsulated air and the presence of the lipid itself in ELIP were also quantified experimentally by repeating the concentration experiments using nondrug-loaded ELIP in the rt-PA solutions. The consequence of adding a non-ionic detergent, Triton X-100 (Sigma-Aldrich, St. Louis, MO, USA) to the ELIP suspension was also measured. The concentration of Triton X-100 to cause instantaneous complete loss of echogenicity was determined experimentally to be 0.07% v/v in preliminary studies using nondrug-loaded ELIP suspensions that circulated in the flow model. Therefore, three rt-PA concentration calibration curves were generated to include the effects of nondrug-loaded ELIP and Triton X-100 on the concentrative curve generated by this spectrophotometric technique: 1) rt-PA alone, 2) rt-PA plus nondrug-loaded ELIP, and 3) rt-PA plus nondrug-loaded ELIP and Triton X-100. The rt-PA concentrations chosen for the calibration curves were from 1 to 10 μg/ml which is the therapeutic concentration range in humans (Seifried et al., 1989; Tanswell et al., 1991).
Pure rt-PA was obtained as a lyophilized powder (rt-PA, Activase, Genentech, San Francisco, CA). The powder was mixed with sterile water to a concentration of 1 mg/ml, as per manufacturer’s instructions, then immediately aliquoted into 1.0 ml centrifuge tubes (Fisher Scientific), and stored at −80 °C (Meunier et al., 2007). Individual aliquots of rt-PA (containing 1 mg of rt-PA) were allowed to thaw for calibration experiments, and unused portions safely discarded following completion of the experiment.
Nondrug-loaded ELIP suspensions were prepared as previously described (Smith et al., 2007). The reconstituted liposomes were pipetted into 0.5% BSA (at room temperature, 20.5 ± 0.5 °C) already placed in a small Pyrex® flask to yield a lipid concentration that would presumably match the same rt-PA concentration released for a given T-ELIP suspension used in forthcoming studies (described in the next subsection). For example, 0.125 ml of reconstituted T-ELIP (10 mg lipid/ml and 400 μg rt-PA/ml) will give a lipid concentration equal to 0.125 mg/ml and an rt-PA concentration equal to 5 μg/ml. Therefore, the reconstituted nondrug-loaded liposomes pipetted into the BSA would need to yield a lipid concentration of 0.125 mg/ml.
A spectrophotometer (UV-1700, Shimadzu, Japan) with a temperature controller (TCC-240A, Shimadzu, Japan) was used for all optical absorption measurements. The temperature controller maintained the spectrophotometer cell at 37 ± 0.5 °C for each suspension in a 4.5 ml Fisherbrand disposable cuvette. For each measurement, 1.78 ml of 0.5% BSA, nondrug-loaded ELIP suspension, or nondrug-loaded ELIP plus Triton X-100 suspension was gently pipetted into the cuvette already placed in the spectrophotometer cell. The cuvette was capped, and the suspension was allowed to reach 37 °C for 2 minutes. Next, a volume of pure rt-PA (2 to 20 μl), dependent on the rt-PA concentration desired (1 to 10 μg/ml, respectively), was pipetted into the cuvette. Again, the cuvette was capped, and the suspension was allowed to reach 37 °C for another 2 minutes. Thereafter, 100 μl of reconstituted chromogenic substrate (25 mg of lyophilized powder with 8.65 ml of distilled water) mixed with 100 μl of distilled water was pipetted into the cuvette. The cuvette was capped and the acquisition of absorbance data was started. After 5 minutes of acquisition, the spectrophotometer displayed the absorbance change over time (ΔA/min). Each experiment was repeated at least three times with a fresh rt-PA suspension to assess variability.
Color Doppler Exposure of rt-PA ELIP and Assessment of rt-PA Release
The assessment of T-ELIP echogenicity and concomitant rt-PA release over 60 min was determined using continuously scanned 6.9-MHz fundamental B-mode pulses of low acoustic pressure (Pr = 600 kPa; MI = 0.04) at a temperature of 37 °C and flow rate of 5 ml/min in four separate exposure conditions: 1) Five T-ELIP samples were exposed to flow alone to monitor the diffusion of gas at each of 5 time points (5, 15, 30, 45, 60 min). 2) Five samples were exposed to 6.0-MHz duplex color Doppler pulses (PD = 3.33 μs and PRF = 1 kHz) at an MI of 0.22 for three minutes ending at each of three time points (5, 30, 60 min). This acoustic output was chosen to be above the acoustically driven diffusion threshold in order to force gas gently out of flowing liposomes. 3) Five samples were exposed to color Doppler pulses at an MI of 0.7 for three minutes ending at the same three time points (5, 30, 60 min). This higher acoustic output was chosen to be above the rapid fragmentation threshold, which forces the gas out the entire T-ELIP suspension. 4) For a positive control, a non-ionic detergent (Triton X-100) was added to the T-ELIP suspension before insertion into the flow model to rupture the liposomal structure chemically in order to measure the total rt-PA associated with the ELIP at three time points (5, 30, 60 min). For the suspensions exposed to color Doppler, 6.9-MHz B-mode images were acquired just prior to the color Doppler exposure. For all four exposure conditions, B-mode images were acquired just prior to collection of the T-ELIP suspension from the flow model for spectrophotometric measurement of rt-PA release.
The exposure time to color Doppler ultrasound was 3 minutes to allow for at least two full circuits through the flow phantom. Since the width of the color Doppler window was 3.25 cm (along the length of the tubing), and the flow rate was 5 ml/min, the ELIP were exposed to color Doppler pulses for approximately 3.1 s during each pass through the color Doppler window. The color Doppler pulse repetition frequency was 1 kHz, thus each liposome was exposed to approximately 3100 color Doppler pulses.
All T-ELIP suspensions were prepared as previously described for the stability and destruction threshold studies. The reconstituted T-ELIP (10 mg lipid/ml and 400 μg rt-PA/ml) were pipetted into 0.5% BSA (at room temperature, 20.5 ± 0.5 °C) already placed in a small Pyrex® flask to yield a final lipid concentration of 0.125 mg/ml and therapeutic rt-PA concentration of 5 μg/ml. For the positive control, 55 μl (or 0.07% v/v) of Triton X-100 (Sigma-Aldrich, St. Louis, MO, USA) was also added to the flask. All samples were stirred gently by hand in the small Pyrex® flask to ensure a homogeneous solution and then immediately pipetted into the 10 ml syringe. Each experiment was repeated at least five times with a fresh T-ELIP suspension to assess variability.
For each freeze-captured image, the MGSV of a 12-mm2 ROI within the lumen of the latex tube (as shown in Figure 3) was quantified and converted to a MDI using a polynomial equation (Porter et al., 2006; Smith et al., 2007). Note that the MDI versus time curves were not normalized in order to illustrate the difference in the initial scattering amplitudes. The mean and standard deviation of the rt-PA concentration at each time point (N = 5) was calculated using Microsoft Excel® (Microsoft Corporation, Redmond, WA, USA) software. The rt-PA concentrations for samples exposed to color Doppler, or detergent at 5, 30, and 60 min were compared to the rt-PA release for samples exposed to flow alone. Statistical analysis was performed on the MDI and spectrophotometric data using a two-tailed Student’s t-test in Microsoft Excel®, where p < 0.01 indicated statistical significance.
RESULTS
The size distribution of reconstituted rt-PA-loaded ELIP in 0.5% BSA is shown in Figure 4. These drug-loaded liposomes range in diameter from 0.4 to 9 μm with a peak number density at a diameter of 1.6 μm. The 20-μm aperture of the Multisizer 3 has an accurate detection limit of 0.6 μm. However, the Zetasizer Nano ZS data did not reveal liposomes smaller than this limit. Therefore, the number density of T-ELIP at the lipid concentration of 0.125 mg/ml used in the rt-PA release studies is estimated to be 9.8 × 10⁵ liposomes/ml. The T-ELIP number density is a factor of 1.7 × 10² smaller than the non-drug loaded ELIP number density at the same lipid concentration.
Figure 4.

Diameter size distribution of T-ELIP assessed by a Beckman-Coulter Multisizer 3 counter using a 20-μm aperture. Note the peak number density (count/ml) of T-ELIP is at a diameter of 1.6 μm.
Stability of T-ELIP versus nondrug-loaded ELIP or Optison®
The stability of T-ELIP, nondrug-loaded ELIP, and Optison® suspensions against gas diffusion in a static fluid is shown in Figure 5. After 1 minute, the nondrug-loaded ELIP suspensions lost 25% of their initial echogenicity, but the T-ELIP suspensions maintained close to 100% of their initial echogenicity. After 5 minutes, the T-ELIP suspension continued to maintain 100% of their initial echogenicity and the nondrug-loaded ELIP suspensions maintained approximately 50% of their initial echogenicity, but the Optison® suspensions completely lost all echogenicity. However, note that the Optison® initial scattering amplitude is twice the T-ELIP initial scattering amplitude and is five times the nondrug-loaded ELIP initial scattering amplitude.
Figure 5.

Loss of echogenicity of three different contrast agent suspensions during scanned harmonic B-mode imaging (fc = 4.5 MHz) at MI = 0.04 (Pr = 0.12 MPa) shown as non-normalized mean digital intensity over time. MI = Mechanical Index, Pr = peak rarefactional pressure, fc = center frequency
Destruction Thresholds of T-ELIP versus nondrug-loaded ELIP
In Figure 6, the normalized MDI is shown as a function of time for T-ELIP suspensions exposed to 6.0-MHz Doppler pulses at a PD of 3.33 μs and PRF of 1.25 kHz. Note that six data sets (N = 30) were acquired at incremental MI values. The acoustically driven diffusion threshold for this PD and PRF combination occurred at a Pr of 0.56 MPa (MI = 0.15) with an R2 of 0.99. The rapid fragmentation threshold occurred at a Pr of 1.59 MPa (MI = 0.43) with an R2 of 1.00. Note that T-ELIP suspensions exhibited the same destruction thresholds as nondrug- loaded ELIP for the same exposure to 6.0-MHz Doppler pulses at a PD of 3.33 μs and PRF of 1.25 kHz (Smith et al., 2007).
Figure 6.

Graph for 6.0-MHz duplex Doppler imaging (PD = 3.33 μs, PRF = 1.25 kHz) of normalized digital intensity as a function of time for prolonged exposure to peak rarefactional pressures (Pr) of (◆) 0.22 MPa, (■) 0.30 MPa, (×) 0.41 MPa, (●) 0.56 MPa, (*) 0.78 MPa, and (▲) 1.59 MPa of rt-PA-loaded echogenic liposome suspensions (N = 5). Note that the acoustically driven diffusion threshold was defined at Pr = 0.56 MPa (MI = 0.15) and the rapid fragmentation threshold was defined at Pr = 1.59 MPa (MI = 0.43). The smoothed lines represent the least squares fit of the data to an exponential decay function of the form Ae−kt + N. PD = pulse duration, PRF = pulse repetition frequency, MI = Mechanical Index
Calibration Curve of rt-PA Concentration Using a Spectrophotometric Method
The three rt-PA concentration calibration curves are shown in Figure 7. A linear least squares fit was performed to each data set. Statistical analysis was performed using a two-tailed Student’s t-test using Microsoft Excel® (Microsoft Corporation, Redmond, WA, USA) software, where p < 0.01 indicated statistical significance. Note that the slope of the rt-PA plus nondrug-loaded ELIP concentration curve (y = 0.0128x + 0.0085, R2 = 1.00) is lower than the rt-PA alone curve (y = 0.0148x + 0.0108, R2 = 0.99, p < 0.01). At 405 nm, the light absorption in the rt-PA solution (10 μg/ml) without ELIP was 0.14 arbitrary units (AU) and with the ELIP (0.25 mg lipid/ml) was 0.29 AU. Both the air pockets and the lipid in the ELIP may contribute to this increased absorption. The slope between the rt-PA plus nondrug-loaded ELIP and the rt-PA plus nondrug-loaded ELIP including Triton X-100 was not significantly different statistically (p ≫ 0.01). Therefore, by using the data set for rt-PA plus ELIP, the concentration of rt-PA (μg/ml) can be determined from simple absorbance measurements over time (ΔA/min) using the polynomial equation, x = (y − 0.0085)/0.0128.
Figure 7.

Nondrug-loaded rt-PA concentration curves for the absorbance change (ΔA/min) at 405 nm versus rt-PA alone (y = 0.0148x + 0.0108, R2 = 0.99), rt-PA plus nondrug-loaded ELIP (y = 0.0128x + 0.0085, R2 = 1.00), or rt-PA plus nondrug-loaded ELIP and Triton X-100 (y = 0.0129x + 0.0066, R2 = 1.00). Note that the rt-PA concentrations chosen were from 1 to 10 μg/ml or the therapeutic concentration range in humans.
Color Doppler Exposure of rt-PA ELIP and rt-PA Release
The echogenicity of T-ELIP suspensions, expressed as MDI (in dB), over time for the four different ultrasound exposure conditions with a flow rate of 5 ml/min and temperature of 37 °C is illustrated in Figure 8. The echogenicity of T-ELIP suspensions was reduced to background level (non-normalized MDI < 10) at 5 minutes for exposure to continuously scanned fundamental 6.9-MHz B-mode pulses with color Doppler pulses at an MI of 0.7 (Pr = 2.6 MPa) or Triton X-100 at an MI of 0.04 (Pr = 600 kPa). In contrast, the echogenicity of T-ELIP suspensions exposed to only continuously scanned fundamental 6.9-MHz B-mode pulses at an MI of 0.04 (Pr = 600 kPa) remained echogenic for approximately 30 minutes. For T-ELIP suspensions exposed to continuously scanned fundamental 6.9-MHz B-mode pulses and color Doppler pulses at an MI of 0.22 (Pr = 0.8 MPa) or between the acoustically driven diffusion and rapid fragmentation thresholds, the liposomes remained echogenic at the five minute point. However, the MDI significantly decreased as compared to the MDI for only continuously scanned B-mode pulsed suspensions at this same time point.
Figure 8.

Loss of echogenicity over time for T-ELIP suspensions at 37 °C and 5 ml/min exposed to continuously scanned fundamental B-mode pulses at a center frequency of 6.9-MHz (MI = 0.04, Pr = 600 kPa) in four separate exposures conditions; 1) flow alone, 2) color 6.0-MHz Doppler pulses above acoustically driven threshold (MI = 0.22, Pr = 0.8 MPa), 3) color 6.0-MHz Doppler pulses above rapid fragmentation threshold (MI = 0.7, Pr = 2.6 MPa), and 4) Triton X-100 (0.07% v/v). The T-ELIP were reconstituted at time zero. Note that the data shown at time points (2, 37 and 57 min) correspond to the echogenicity of T-ELIP suspensions (N = 5) with flow alone before being exposed to the color Doppler pulses for the next three minutes. Pr = peak rarefactional pressure, MI = Mechanical Index
The rt-PA concentration (μg/ml) released from T-ELIP suspensions over time for the four different ultrasound exposure conditions with a flow rate of 5 ml/min and temperature of 37 °C is shown in Figure 9. For suspensions exposed to continuously scanned fundamental 6.9-MHz B-mode pulses with color Doppler pulses at an MI of 0.7 (above rapid fragmentation threshold) or Triton X-100 (positive control) at an MI of 0.04, the average rt-PA concentration measured at the time point of 5 min was 2.57 ± 0.14 μg/ml and 2.63 ± 0.11 μg/ml, respectively. For suspensions exposed to continuously scanned fundamental 6.9-MHz B-mode pulses with color Doppler pulses above acoustically driven diffusion threshold at an MI of 0.22, the average rt-PA concentration measured at 5 min was 2.01 ± 0.18 μg/ml. For suspensions exposed to continuously scanned B-mode pulsed only at an MI of 0.04, the average rt-PA concentration measured at 5 min was 1.36 ± 0.08 μg/ml. There was a significant change (p ≪ 0.01) in average rt-PA concentration for samples exposed to color Doppler pulses or Triton X-100 at 5, 30, and 60 min when compared to the rt-PA release for samples exposed to flow alone.
Figure 9.

Concentration of rt-PA over time for T-ELIP suspensions at 37 °C and 5 ml/min exposed to continuously scanned fundamental B-mode pulses at a center frequency of 6.9-MHz (MI = 0.04, Pr = 600 kPa) in four separate exposures conditions; 1) flow alone, 2) color 6.0-MHz Doppler pulses above acoustically driven threshold (MI = 0.22, Pr = 0.8 MPa), 3) color 6.0-MHz Doppler pulses above rapid fragmentation threshold (MI = 0.7, Pr = 2.6 MPa), and 4) Triton X-100 (0.07% v/v). The T-ELIP were reconstituted at time, 0. Pr = peak rarefactional pressure, MI = Mechanical Index
DISCUSSION
Stability of T-ELIP versus nondrug-loaded ELIP or Optison®
The stability of T-ELIP against gas diffusion in a static suspension of 0.5% BSA was explored using harmonic B-mode pulses at an output level (Pr = 0.12 MPa; MI = 0.04), well below the acoustically driven diffusion threshold for nondrug-loaded ELIP at 4.5-MHz (Pr > 1.74 MPa; MI > 0.60). Both types of echogenic liposomes (nondrug-loaded ELIP and T-ELIP) effectively scattered incident pulses over the entire 5 minutes of insonation versus Optison® (Figure 5). Note that the Optison® digital intensity decreases rapidly to the initial T-ELIP scattering amplitude after 60 seconds and to the nondrug-loaded ELIP scattering amplitude after 130 seconds. Therefore, the rt-PA-loaded liposomes are more robust in their acoustic scattering behavior and exhibit twice the scattering amplitude as nondrug-loaded echogenic liposomes. This could be due to the different viscoelastic properties of the shell due to the attraction of rt-PA for lipid and the change in size distribution of rt-PA-loaded ELIP (peak number density at a diameter of 1.6 μm) versus nondrug-loaded ELIP (peak number density at a diameter of 59 nm).
Destruction Thresholds of T-ELIP
Figure 6 illustrates that the loss of echogenicity from rt-PA-loaded liposomes exposed to pulsed 6.0-MHz Doppler ultrasound results from either acoustically driven diffusion of the encapsulated gas or rapid fragmentation of the liposome shell, depending on the exposure pressure amplitude. Interestingly, T-ELIP exhibited the same destruction thresholds as nondrug-loaded ELIP for the same exposure to 6.0-MHz Doppler pulses at a PD of 3.33 μs and PRF of 1.25 kHz. Therefore, the newly developed rt-PA-loaded liposomes are echogenic upon exposure to B-mode pulses, and can be fragmented with Doppler pulses.
Fragmentation of T-ELIP and rt-PA Concentration Released
The concentration of rt-PA from T-ELIP exposed to four different ultrasound exposure conditions was quantified with the concomitant loss in echogenicity temporally using an in vitro flow model (Figures 8 and 9). We have demonstrated that T-ELIP can be fragmented and release a clinically relevant concentration of rt-PA using color Doppler ultrasound. Note that the desired initial concentration of each T-ELIP suspension was reconstituted at 5 μg/ml. An average rt-PA concentration of 2.6 μg/ml was released for T-ELIP suspensions exposed to color Doppler pulses (MI = 0.7) or the detergent, Triton X-100. Therefore, approximately 52% of the rt-PA was loaded (entrapped or adsorbed) during the manufacturing of T-ELIP and this rt-PA was still active upon release, which confirms the previous finding of 50% entrapment efficiency (Tiukinhoy-Laing et al., 2007). For T-ELIP suspensions exposed to continuous B-mode pulses only, the average rt-PA concentration was measured to be approximately 1.4 μg/ml. Thus 54% of the rt-PA is either adsorbed to the outside of the liposomes or in free solution.
The rt-PA concentration measured for each exposure condition at each time point did not change significantly from the initial measured concentration at five minutes as illustrated in Figure 9. Thus, the release of the rt-PA from the liposomes is triggered by exposure to color Doppler ultrasound for 3 minutes. Additionally, rt-PA was not released when interrogated with continuous fundamental B-mode pulses at an MI of 0.04 for up to sixty minutes. This indicates that rt-PA did not leak through the liposome shell, become detached from the lipid, or lose its enzymatic activity, even though the encapsulated air was continually diffusing out through the liposome shell over the entire sixty minutes as evidenced by the loss in echogenicity in Figure 8. We hypothesize that the nanobubbles encapsulated within the liposomes decrease in size over time after reconstitution, making them less echogenic at 6.9 MHz. However, these nanobubbles continue to interact with the color Doppler pulses to nucleate the release of rt-PA. Therefore, the thrombolytic drug remained encapsulated or associated with the lipid bilayer when exposed to B-mode pulses. The drug was released only when exposed to color Doppler pulses or to the detergent. Interestingly, when T-ELIP suspensions were exposed to color Doppler pulses above the acoustically driven diffusion threshold, but below the rapid fragmentation threshold at an MI of 0.22, only some of the rt-PA was released. Therefore, it may be possible to release a variable amount of drug by simply changing the amplitude of the insonating Doppler pulse.
For ultrasound-triggered drug release, in which acoustic pulses are intended to liberate a sequestered drug payload into the circulation, the effects of ultrasound on lipid-shelled microbubbles have only just begun to be studied. Borden et al. (2005) demonstrated that the phospholipid composition of the liposome shell has a significant impact on its acoustic behavior when interrogated by ultrasound pulses. The lipid bilayer of ELIP is held together by hydrophobic forces, which can reseal after the surface ruptures. This can occur when the peak rarefaction pressure of an ultrasound pulse leads to an expansion of the encapsulated air pocket (Huang, 2008a; Huang et al., 2008b). Most importantly, the acoustic parameters chosen can manipulate the liposome to behave within the three different regimes of destruction thresholds (static diffusion, acoustically driven diffusion, and rapid fragmentation) as first defined by Chomas et al. (2001). At higher concentrations of T-ELIP, effects of shadowing may obfuscate the ability to measure the threshold of acoustically driven diffusion using this technique (Soetanto and Chan, 2000). Future studies interrogating single particles are needed to confirm the thresholds measured in our study.
T-ELIP suspensions were circulated in the flow model at a low flow rate of 5 ml/min, which is only observed in small peripheral vessels in humans (Nichols and O’Rourke, 1990). In addition, the acoustic behavior of T-ELIP was detected by video intensity measurements. However, a tissue-mimicking phantom was used to elucidate the logarithmic compression and background intensity of the freeze-captured images (Porter et al., 2006; Smith et al., 2007). Further studies utilizing a flow phantom are needed to determine the effects of different flow rates on echogenicity loss and drug release of ELIP.
Smikahl et al. (2005) determined that rt-PA exposed to low-power ultrasound pulses in vitro remained active and stable for as long as six minutes. Note that there was active rt-PA present in T-ELIP suspensions exposed to continuous B-mode pulses for sixty minutes as shown in Figure 9. It is important to note that plasminogen activator inhibitors found in plasma would be present in vivo. Furthermore, recent studies using a microscopic imaging technique have shown enhanced thrombolysis of in vitro blood clots in plasma exposed to 120 kHz and T-ELIP for 30 minutes (Meunier et al., 2008; Shaw et al., 2009). The co-encapsulation of a drug and gas into liposomes is still in the development stages and the entrapment efficiency will likely increase as manufacturing methods continually improve (Huang, 2008a; Huang et al., 2008b). Nevertheless, this study demonstrates that a therapeutic concentration of rt-PA for humans was released from T-ELIP. The potential for T-ELIP to be used for localized drug delivery has the potential to reduce the systemic effects of rt-PA in humans.
The most widely used methods to quantitate the amount of drug release from liposomes require water-soluble markers using several detection methods such as fluorescence, optical density, enzymatic reaction, and radio-labeled molecules (Torchilin and Weissig, 2003). Tartis et al. (2006) examined the cellular effects of ultrasound-mediated delivery of paclitaxel, a lipophilic drug, from acoustically activated lipospheres in vitro, but did not measure release of paclitaxel directly. Chen et al. (2003 and 2006) demonstrated that ultrasound can deliver water-soluble genes from liposomes into cardiac muscle and pancreatic islet cells in vivo. Kopechek et al. (2007) were able to use color 6.0-MHz Doppler pulses to release calcein, a hydrophilic agent, from ELIP using the same flow model using a different linear array transducer (Philips CL15-7). We note that the echogenicity alone cannot be used to determine drug release.
CONCLUSION
A recently developed ultrasound contrast agent, rt-PA-loaded echogenic liposomes, was assessed in vitro using a clinical diagnostic ultrasound scanner equipped with a linear array transducer. The results indicate that ELIP loaded with rt-PA are very robust during continuous fundamental B-mode imaging and can be rapidly fragmented with color Doppler pulsed ultrasound. The rt-PA released from the liposomes also has similar enzymatic activity as the free drug. The rt-PA entrapment efficiency of 52% was similar to recent results (Tiukinhoy-Laing et al., 2007). In addition, a therapeutic concentration could be released upon fragmentation of the reconstituted T-ELIP. We also showed that T-ELIP exposed to B-mode pulses provided image contrast while the rt-PA remained encapsulated in the ELIP. In addition, the encapsulated rt-PA can be released by fragmenting the ELIP with color Doppler ultrasound. Future studies will ascertain the stability and targeting efficiency of drug-entrapped echogenic liposomes as well as their potential use with therapeutic ultrasound to enhance drug uptake.
Acknowledgments
The authors would like to thank Kate Hitchcock, M.S., for her help with the flow model development. This work was supported by National Institutes of Health NS047603 and HL074002.
Footnotes
Publisher's Disclaimer: This is a PDF file of an unedited manuscript that has been accepted for publication. As a service to our customers we are providing this early version of the manuscript. The manuscript will undergo copyediting, typesetting, and review of the resulting proof before it is published in its final citable form. Please note that during the production process errors may be discovered which could affect the content, and all legal disclaimers that apply to the journal pertain.
References
- Alexandrov AV. Ultrasound enhanced thrombolysis for stroke. Seminars in Cerebrovascular Diseases and Stroke. 2006;5:106–110. [Google Scholar]
- Apfel RE, Holland CK. Gauging the likelihood of cavitation from short-pulse, low-duty cycle diagnostic ultrasound. Ultrasound Med Biol. 1991;17:179–185. doi: 10.1016/0301-5629(91)90125-g. [DOI] [PubMed] [Google Scholar]
- Bevan DP, Karshafian R, Burns PN. The influence of fragmentation on the acoustic response from shrinking bubbles. Ultrasound Med Biol. 2008;34 (7):1152–1162. doi: 10.1016/j.ultrasmedbio.2007.12.016. [DOI] [PubMed] [Google Scholar]
- Borden MA, Kruse DE, Caskey CF, Zhao S, Dayton PA, Ferrara KW. Influence of lipid shell physiochemical properties on ultrasound-induced microbubble destruction. IEEE Trans Ultrason Ferroelectr Freq Control. 2005;52:1992–2002. doi: 10.1109/tuffc.2005.1561668. [DOI] [PMC free article] [PubMed] [Google Scholar]
- Bouakaz A, de Jong N. WFUMB safety symposium on echo-contrast agents: Nature and types of ultrasound contrast agents. Ultrasound Med Biol. 2007;33:187–196. doi: 10.1016/j.ultrasmedbio.2006.07.008. [DOI] [PubMed] [Google Scholar]
- Bouakaz A, Versluis M, de Jong N. High-speed optical observations of contrast agent destruction. Ultrasound Med Biol. 2005;31:391–399. doi: 10.1016/j.ultrasmedbio.2004.12.004. [DOI] [PubMed] [Google Scholar]
- Chen S, Shohet RV, Bekeredjian R, Frenkel P, Grayburn CB. Optimization of ultrasound parameters for cardiac gene delivery of adenoviral or plasmid deoxyribonucleic acid by ultrasound-targeted microbubble destruction. J Am Coll Cardiol. 2003;42:301–308. doi: 10.1016/s0735-1097(03)00627-2. [DOI] [PubMed] [Google Scholar]
- Chen S, Ding JH, Bekeredjian R, Yang B-Z, Shohet RV, Johnston RV, Hohmeier HE, Newgard CB, Grayburn CB. Efficient gene delivery to pancreatic islets with ultrasonic microbubble destruction technology. Proc Natl Acad Sci USA. 2006;103:8469–8474. doi: 10.1073/pnas.0602921103. [DOI] [PMC free article] [PubMed] [Google Scholar]
- Chmlelewska J, Wlman B. Determination of tissue plasminogen activator and its “fast” inhibitor in plasma. Clin Chem. 1986;32:482–485. [PubMed] [Google Scholar]
- Chomas JE, Dayton P, Allen J, Morgan K, Ferrara KW. Mechanisms of contrast agent destruction. IEEE Trans Ultrason Ferroelectr Freq Control. 2001;48:232–248. doi: 10.1109/58.896136. [DOI] [PubMed] [Google Scholar]
- Coussios CC, Holland CK, Jakubowska L, Huang SL, MacDonald RC, Nagaraj A, McPherson DD. In vitro characterization of echogenic liposomes and Optison® by acoustic scattering at 3.5 MHz. Ultrasound Med Biol. 2004;30:181–190. doi: 10.1016/j.ultrasmedbio.2003.10.015. [DOI] [PMC free article] [PubMed] [Google Scholar]
- Heeremans JLM, Gerritsen HR, Meusen SP, Mijnheer FW, Panday RSG, Prevost R, Kluft, Crommelin DJA. The preparation of tissue-type plasminogen activator (t-PA) containing liposomes: Entrapment efficiency and ultracentrifugation damage. J Drug Targeting. 1995;3:301–310. doi: 10.3109/10611869509015959. [DOI] [PubMed] [Google Scholar]
- Hemker HC. Handbook of Synthetic Substrates: For the coagulation and fibrinolytic system. Martinus Nijhoff Publishers; Boston: 1983. [Google Scholar]
- Huang SL, Hamilton AJ, Nagaraj A, Tiukinhoy SD, Klegerman ME, McPherson DD, MacDonald RC. Improving ultrasound reflectivity and stability of echogenic liposomal dispersions for use as targeted ultrasound contrast agents. J Pharm Sci. 2001;90:1917–26. doi: 10.1002/jps.1142. [DOI] [PubMed] [Google Scholar]
- Huang S-L, Hamilton AJ, Pozharski E, Nagaraj A, Klegerman ME, McPherson DD, MacDonald RC. Physical correlates of the ultrasonic reflectivity of lipid dispersions suitable as diagnostic contrast agents. Ultrasound Med Biol. 2002;28:339–348. doi: 10.1016/s0301-5629(01)00512-9. [DOI] [PubMed] [Google Scholar]
- Huang S-L, MacDonald RC. Acoustically active liposomes for drug encapsulation and ultrasound-triggered release. Biochim Biophys Acta. 2004;1665:134–141. doi: 10.1016/j.bbamem.2004.07.003. [DOI] [PubMed] [Google Scholar]
- Huang S-L. Liposomes in ultrasonic drug and gene delivery. Adv Drug Deliv Rev. 2008a;60 (10):1167–1176. doi: 10.1016/j.addr.2008.03.003. [DOI] [PubMed] [Google Scholar]
- Huang S-L, McPherson DD, MacDonald RC. A method to co-encapsulate gas and drugs in liposomes for ultrasound-controlled drug delivery. Ultrasound Med Biol. 2008b;34 (8):1272–1280. doi: 10.1016/j.ultrasmedbio.2008.01.005. [DOI] [PMC free article] [PubMed] [Google Scholar]
- Kalbanov A, Klein D, Pelura T, Schutt E, Weers J. Dissolution of multicomponent microbubbles in the bloodstream: 1. Theory Ultrasound Med Biol. 1998;24:739–749. doi: 10.1016/s0301-5629(98)00034-9. [DOI] [PubMed] [Google Scholar]
- Kee PH, Abruzzo TA, Smith DAB, Kopechek JA, Wang B, Huang SL, MacDonald RC, Holland CK, McPherson DD. Synthesis, acoustic stability, and pharmacologic activities of papaverine-loaded echogenic liposomes for ultrasound controlled drug delivery. J Liposome Res. 2008;18(4):263–77. doi: 10.1080/08982100802354558. [DOI] [PMC free article] [PubMed] [Google Scholar]
- Kopechek JA, Abruzzo TA, Wang B, Chrzanowski SM, Smith DAB, Kee PH, Huang S, Collier JH, McPherson DD, Holland CK. Ultrasound-mediated release of hydrophilic and lipophilic agents from echogenic liposomes. J Ultrasound Med. 2008;27:1597–1606. doi: 10.7863/jum.2008.27.11.1597. [DOI] [PMC free article] [PubMed] [Google Scholar]
- Kopechek JA, Porter TM, Coussios CC, Perrin SR, Huang S, McPherson DD, Holland CK. Acoustic characterization of echogenic liposomes: Attenuation and quantitative backscatter. J Acoust Soc Am. 2009;125(4):2713. doi: 10.1121/1.3626124. [DOI] [PMC free article] [PubMed] [Google Scholar]
- Lanza GM, Onhyuksel H, Klegerman ME, Vonish MJ, McPherson DD. Acoustically reflective liposomes and methods to make and use same. 5,612,057. Northwestern University; U.S. Pat. 1997
- Meunier JM, Holland CK, Lindsell CJ, Shaw GJ. Duty cycle dependence of ultrasound enhanced thrombolysis in a human clot model. Ultrasound Med Biol. 2007;33:576–583. doi: 10.1016/j.ultrasmedbio.2006.10.010. [DOI] [PMC free article] [PubMed] [Google Scholar]
- Meunier J, Smith D, Holland C, Huang S-L, McPherson D, Shaw G. 120 kHz pulsed ultrasound enhanced thrombolysis with t-PA loaded echogenic liposomes. Cerebrovascular Diseases. 2008 Jul;26(suppl 1):17. [Google Scholar]
- Molina CA, Ribo M, Rubiera M, Montaner J, Santamarina E, Delgado-Mederos R, Arenillas JF, Huertas R, Purroy F, Delgado P, Alvarez-Sabin J. Microbubble administration accelerates clot lysis during continuous 2-MHz ultrasound monitoring in stroke patients treated with intravenous tissue plasminogen activator. Stroke. 2006;37:425–9. doi: 10.1161/01.STR.0000199064.94588.39. [DOI] [PubMed] [Google Scholar]
- Nichols WW, O’Rourke MF. McDonald’s blood flow in arteries. Lea and Febiger; Philadelphia: 1990. [Google Scholar]
- Porter TR, Xie F. Transient myocardial contrast after initial exposure to diagnostic ultrasound pressures with minute doses of intravenously injected microbubbles. Circulation. 1995;92:2391–2395. doi: 10.1161/01.cir.92.9.2391. [DOI] [PubMed] [Google Scholar]
- Porter TM, Smith DAB, Holland CK. Acoustic techniques for assessing the Optison® destruction threshold. J Ultrasound Med. 2006;25:1519–1529. doi: 10.7863/jum.2006.25.12.1519. [DOI] [PMC free article] [PubMed] [Google Scholar]
- Postema M, Marmottant P, Lancee CT, Hilgenfeldt S, de Jong N. Ultrasound-induced microbubble coalescence. Ultrasound Med Biol. 2004;30:1337–1344. doi: 10.1016/j.ultrasmedbio.2004.08.008. [DOI] [PubMed] [Google Scholar]
- Saqqur M, Tsivgoulis G, Molina CA, Demchuk AM, Garami C, Barreto A, Spengos K, Forteza A, Mikulik R, Sharma VK, Brunser A, Martinez P, Montaner J, Kohrmann M, Schellinger PD Alexandrov AV for the CLOTBUST-PRO Investigators. Design of a PROspective multi-national CLOTBUST collaboration on reperfusion therapies for stroke (CLOTBUST-PRO) Intl J of Stroke. 2008;3:66–72. doi: 10.1111/j.1747-4949.2008.00167.x. [DOI] [PubMed] [Google Scholar]
- Seifried E, Tanswell P, Ellbruck D, Haerer W, Schmidt A. Pharmacokinetics and haemostatic status during consecutive infusion of recombinant tissue-type plasminogen activator in patients with acute myocardial infarction. Thromb Haemostat. 1989;61:497–501. [PubMed] [Google Scholar]
- Shaw GJ, Meunier JM, Huang S-L, Lindsell CJ, McPherson DD, Holland CK. Ultrasound-enhanced thrombolysis with t-PA-loaded echogenic liposomes. Thrombosis Research. 2009 doi: 10.1016/j.thromres.2009.01.008. [DOI] [PMC free article] [PubMed] [Google Scholar]
- Smikahl J, Yeung D, Wang S, Semba C. Alteplase stability and bioactivity after low-power ultrasonic energy delivery with the Omnisonics resolution system. J Vasc Interv Radiol. 2005;16:385–389. doi: 10.1097/01.RVI.0000147066.97599.87. [DOI] [PubMed] [Google Scholar]
- Smith DAB, Porter TM, Martinez J, Huang S-L, MacDonald RC, McPherson DD, Holland CK. Destruction thresholds of echogenic liposomes with clinical diagnostic ultrasound. Ultrasound Med Biol. 2007;33:797–809. doi: 10.1016/j.ultrasmedbio.2006.11.017. [DOI] [PubMed] [Google Scholar]
- Soetanto K, Chan M. Fundamental studies on contrast images from different-sized microbubbles: Analytical and experimental studies. Ultrasound Med Biol. 2000;26:81–91. doi: 10.1016/s0301-5629(99)00107-6. [DOI] [PubMed] [Google Scholar]
- Tanswell P, Seifried E, Stang E, Krause J. Pharmacokinetics and hepatic catabolism of tissue-type plasminogen activator. Arzneim-Forsch/Drug Res. 1991;12:1310–1319. [PubMed] [Google Scholar]
- Tartis MS, McCallan J, Lum AF, LaBell R, Stieger SM, Matsunaga TO, Ferrara KW. Therapeutic effects of paclitaxel-containing ultrasound contrast agents. Ultrasound Med Biol. 2006;32:1771–1780. doi: 10.1016/j.ultrasmedbio.2006.03.017. [DOI] [PubMed] [Google Scholar]
- Tiukinhoy-Laing SD, Huang S, Klegerman M, Holland CK, McPherson DD. Ultrasound-facilitated thrombolysis using tissue-plasminogen activator-loaded echogenic liposomes. Thrombosis Research. 2007;119:777–784. doi: 10.1016/j.thromres.2006.06.009. [DOI] [PMC free article] [PubMed] [Google Scholar]
- Torchilin V, Weissig V. Liposomes Second Edition: A Practical Approach. New York: Oxford University Press; 2003. [Google Scholar]
- Torchilin V. Multifunctional and stimuli-sensitive pharmaceutical nanocarriers. Euro J Pharma and Biopharma. 2009;71:431–444. doi: 10.1016/j.ejpb.2008.09.026. [DOI] [PMC free article] [PubMed] [Google Scholar]
- Van Liew HD, Burkard ME. Relationship of oxygen content to PO2 for stabilized bubbles in the circulation: Theory. J Appl Physiol. 1996;81:500–508. doi: 10.1152/jappl.1996.81.1.500. [DOI] [PubMed] [Google Scholar]
- Verheijen JH, de Jong YF, Chang GTG. Quantitative analysis of the composition of mixtures of one-chain and two-chain tissue-type plasminogen activator with a spectrophotometric method. Thrombosis Research. 1985;39:281–88. doi: 10.1016/0049-3848(85)90223-3. [DOI] [PubMed] [Google Scholar]