Abstract
The auditory system calibrates to reliable properties of a listening environment in ways that enhance sensitivity to less predictable (more informative) aspects of sounds. These reliable properties may be spectrally local (e.g., peaks) or global (e.g., gross tilt), but the time course over which the auditory system registers and calibrates to these properties is unknown. Understanding temporal properties of this perceptual calibration is essential for revealing underlying mechanisms that serve to increase sensitivity to changing and informative properties of sounds. Relative influence of the second formant (F2) and spectral tilt was measured for identification of ∕u∕ and ∕i∕ following precursor contexts that were harmonic complexes with frequency-modulated resonances. Precursors filtered to match F2 or tilt of following vowels induced perceptual calibration (diminished influence) to F2 and tilt, respectively. Calibration to F2 was greatest for shorter duration precursors (250 ms), which implicates physiologic and∕or perceptual mechanisms that are sensitive to onsets. In contrast, calibration to tilt was greatest for precursors with longer durations and higher repetition rates because greater opportunities to sample the spectrum result in more stable estimates of long-term global spectral properties. Possible mechanisms that promote sensitivity to change are discussed.
INTRODUCTION
Outside of anechoic chambers, acoustic properties of sounds are filtered by the listening environment. Different frequencies of energy are reinforced or dampened by acoustic reflective or absorbent properties, respectively, of surfaces and objects in the environment. The challenge of detecting signal properties, apart from acoustic consequences of the physical environment in which those sounds are transmitted, has been present ever since the very first auditory systems. For audition in the contemporary world, particularly for speech, the same challenge is present when spectra of sounds are shaped by transmission channel properties such as those for telephones, hearing aids, and even for automatic speech recognition systems.
To the extent that auditory perception can calibrate to, or filter out, acoustic properties of a listening context, detection and discrimination of sounds to which one is listening will be enhanced. There have been multiple demonstrations that perception is indeed sensitive to reliable characteristics of a listening context, or, that predictable characteristics of a context are factored out of perception. In many respects, speech is an ideal signal with which to demonstrate these effects. Adult listeners have ample experience categorizing speech sounds, so they require no special training in order to make subtle discriminations along multiple acoustic dimensions. In addition, perception of speech sounds in isolation, devoid of acoustic context, is particularly sensitive to acoustic properties (e.g., spectral peaks and overall spectral tilt) that could otherwise be attributed to filter characteristics of the environment or talker.
One classic demonstration of context effects in speech is Ladefoged and Broadbent (1957). They varied the first formant frequency, F1, of a context sentence that preceded a synthesized vowel series that varied perceptually from [bIt] to [bεt] and acoustically in F1 frequency (low and high, respectively). Results showed that perception of the vowel series was contrastive to the long-term spectrum of the context sentence. When high F1 was a reliable property of the preceding context, perception was biased toward ∕bɪt∕ (low F1), and when low F1 was a reliable property of the preceding context, perception was biased toward ∕bεt∕ (high F1).
Conversely, Darwin et al. (1989) demonstrated that changes in vowel perception, caused by a filter that altered the relative amplitudes of formants, was perceptually undone when the same filter was applied to the preceding context, which consisted of a three-word precursor phrase separated from the target by 500 ms. Listeners calibrated to the spectral consequences of the filter such that perception of the following vowel again matched that for unfiltered vowels heard in isolation. Watkins (1991) and Watkins and Makin (1994) demonstrated perceptual calibration to long-term spectral characteristics of the listening context by creating filters that captured the differences in spectral shapes between vowels ∕ɪ∕ and ∕ε∕ and applying these filters to a precursor sentence that preceded an “etch” to “itch” series. When the preceding context was passed through the ∕ɪ∕ minus ∕ε∕ difference filter, probability of listeners responding “etch” increased. The opposite response pattern was found when the difference filter was reversed (i.e., ∕ε∕ minus ∕ɪ∕). In each case, listeners were more likely to report hearing the vowel sound that shared the least in common with the precursor spectrum. Because spectral similarities to one vowel (e.g., ∕ɪ∕) in the long-term spectrum of the precursor were perceptually mitigated and spectral differences to the other vowel (e.g., ∕ε∕) were enhanced, Watkins and Makin (1994) characterize this calibration as “inverse filtering.” This perceptual calibration and contrast were demonstrated across different speech contexts that varied in talker gender, spatial position, ear of presentation, forward or time-reversed, and even for speech-shaped, signal-correlated noise.
These effects are not restricted to speech sounds or even to sounds with which listeners are highly familiar. Stilp et al. (2010) demonstrated complementary sensitivity to difference filters created from French horn and tenor saxophone spectra applied to precursors that were passages from a string quintet or a female talker. Both filtered music and speech precursors shifted identification of a morphed series between stylized French horn and tenor saxophone, highlighting the fact that the perceptual system calibrates to spectral characteristics of the listening context irrespective of the apparent identity of sources.
Kluender and colleagues (e.g., Kluender and Kiefte, 2006; Kluender and Alexander, 2007; Kiefte and Kluender, 2008) have proposed that one useful way to characterize this calibration to listening context is that, by registering and factoring out reliable acoustic spectral properties, the auditory system becomes more sensitive to less predictable, hence more informative, spectral characteristics. Stilp et al. (2010) suggest that this auditory process is functionally similar to color constancy in vision. The spectral distribution of light entering the eye depends on both the spectrum of illumination and the spectral characteristics light encounters on its path to the eye (Nassau, 1983). To achieve color constancy, the visual system extracts reliable spectral properties across an entire image in order to estimate inherent spectral properties of objects within the scene (Boynton, 1988; Churchland and Sejnowski, 1988; Foster et al., 1997).
Despite multiple demonstrations incorporating both speech and non-speech signals (e.g., Holt, 2005, 2006; Kiefte and Kluender, 2008; Stilp et al., 2010; Watkins, 1991; Watkins and Makin, 1994), relatively little is known about processes underlying perceptual calibration to listening context. Particularly with respect to applications of modern signal processing technology, natural biological mechanisms of perceptual calibration need to be better understood. For example, hearing aids and cell phones have the capability of dynamically altering spectrally global and local filter characteristics every few seconds to accommodate differences in speech or noise level across frequency (multichannel compression and noise reduction schemes). In addition, these devices modify sounds in response to acoustic feedback (e.g., notch filtering) and talker position (i.e., different directional polar patterns). It is not clear how such technological signal modifications complement, enhance, or hinder natural processes.
Context effects are often tested in one of two ways: (1) varying target stimuli along a single dimension and (2) varying target stimuli along two dimensions simultaneously. Speech sounds in isolation are the preferred stimuli because speech is the signal that people care most about and is readily classified by untrained listeners. The traditional method of testing speech context effects is to form a series of target stimuli that vary acoustically along a single dimension (e.g., low to high F2 frequency) and perceptually from one speech sound to another (e.g., ∕u∕ to ∕i∕, respectively). Following sounds with different acoustic compositions (e.g., with relatively low- or high-frequency content), a context effect is quantified by the difference in the overall proportion of responses or by a shift in the crossover point for the stimulus series where each response is equally likely. Another method of testing context effects that is more suitable for observing perceptual calibration is to form a matrix of stimuli that vary along more than one acoustic dimension (e.g., spectral peak and tilt) but along a single perceptual dimension (e.g., from ∕u∕ to ∕i∕), as in a trading relationship. Contexts are then matched along one of the two dimensions and perceptual calibration is observed by measuring a change in degree to which listeners use each dimension for stimulus classification.
Following methods similar to those developed by Kiefte and Kluender (2008), the current study attempts to better define processes of perceptual calibration to both spectrally local and spectrally global properties, thereby illuminating the relative temporal courses for both, and providing insights into physiological processes that may be implicated. Based on prior work (Kiefte and Kluender, 2005) that demonstrated identification of vowels ∕u∕ and ∕i∕ to be sensitive to both F2 frequency (spectrally local) and gross spectral tilt (spectrally global), Kiefte and Kluender (2008) used for their target stimuli a matrix of vowels that varied perceptually from ∕u∕ to ∕i∕ and acoustically in F2 center frequency and overall spectral tilt. Listeners identified these vowels following forward or time-reversed precursor sentences that were filtered on a trial-by-trial basis to match either the F2 or spectral tilt of target vowels. They demonstrated that when precursor sentences had F2-matching filters, F2 information in target vowels was perceptually minimized and listeners identified vowels principally on the basis of spectral tilt. Likewise, when precursor sentences had tilt-matching filters, effects of spectral tilt for perception of target vowels was largely diminished and listeners identified vowels on the basis of F2 alone.
While the extent to which absolute spectral tilt plays a role in phonetic perception is generally unresolved (see, e.g., Hillenbrand et al., 1995; Bladon and Lindblom, 1981; Zahorian and Jagharghi, 1993; Ito et al., 2001), changes in tilt across time clearly influence perception of speech by normal-hearing listeners (Alexander and Kluender, 2008), and especially by hearing-impaired listeners (Alexander and Kluender, 2009) for whom spectral peaks are often obscured by abnormal cochlear processing. Furthermore, it is known that rapid changes in spectral tilt can substantially impair sentence identification (Van Dijkhuizen et al., 1987, 1989, 62; Haggard et al., 1987). In light of modern signal processing schemes that are capable of producing rapid spectral changes, it is important to know the time course of auditory processes responsible for minimizing their influence on speech perception.
To better understand underlying mechanisms involved in perceptual calibration, experiments in this current series of investigations will examine how the relative influence of F2 and spectral tilt on identification of vowel targets (∕u∕ and ∕i∕) is affected by the duration and sampling statistics of F2-matched or tilt-matched non-speech precursors. One hypothesis is that, for continuously varying spectra like running speech, perceptual calibration to global spectral properties (e.g., absolute tilt) may require a longer sampling period of the broad spectral context given continuously changing local spectral composition. Local spectral properties like formant onsets, offsets, and trajectories tend to be brief, and calibration effects may be correspondingly transitory. However, because of the inherent reliability associated with the long-term spectrum, its influence on perception should sustain over a longer period.1
EXPERIMENT 1: EFFECTS OF PRECURSOR DURATION
Synthesis of ∕u∕–∕i∕ target stimuli
The vowel target stimuli consisted of a matrix that varied acoustically in both F2 frequency and spectral tilt and perceptually from [u] to [i]. First, a series of five vowel sounds varying from [u] to [i] in the F2 dimension was constructed using the parallel branch of a speech synthesizer (Klatt and Klatt, 1990) at a sampling rate of 22050 Hz with 16 bits of resolution and 5-ms update rate. Vowels had a fundamental frequency of 100 Hz and were 90 ms in total duration with 5-ms onset∕offset ramps. F1, F3, and F4 were held constant at 300, 2700, and 3600 Hz, respectively. F2 varied in five 300-Hz steps from 1000 to 2200 Hz. The bandwidths (BWs) for F1–F4 were 60, 160, 260, and 360 Hz, respectively. Nominal values for formant amplitudes (A1V–A4V) in the synthesizer were manipulated so that each vowel had a reasonably constant spectral tilt of −3 dB∕oct for each F2 frequency. To maintain a constant tilt, nominal amplitudes of F2 (A2V) decreased as frequency increased: 1000 Hz (75 dB), 1300 Hz (71 dB), 1600 Hz (69 dB), 1900 Hz (67 dB), and 2200 Hz (65 dB). A1V, A3V, and A4V were fixed at 52, 75, and 80 dB, respectively. Spectral analysis using a 256-point fast Fourier transform (FFT) with 50% Hamming window overlap confirmed that the spectral tilt between each pair of formants was reasonably constant.
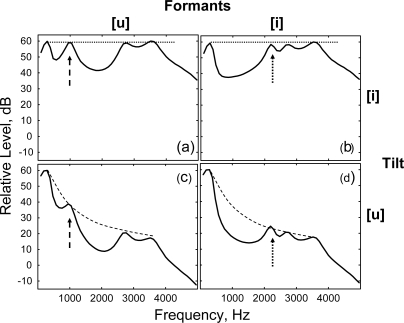
Next, a matrix of 25-vowel sounds was created by imposing five different spectral tilt slopes (−12 to 0 dB∕oct in 3 dB∕oct steps) on the five-step F2 series. Parametric manipulations of spectral tilt between 212 and 4800 Hz were made using 90-tap finite impulse response (FIR) filters created in matlab.2 Base stimuli already had a constant −3 dB∕oct tilt, so filter slopes varied from −9 to +3 dB∕oct to achieve the desired slopes. Vowel targets were upsampled to 48828 Hz with 24-bit resolution, then low-pass filtered with a 86-tap FIR filter with an upper cutoff at 4800 Hz and a stopband of −90 dB at 6400 Hz. Vowels were then scaled to 75 dB sound pressure level (SPL). Corner stimuli of this vowel matrix are shown in Fig. 1. Stimuli in the left column have the most [u]-like F2 frequency (1000 Hz, dashed arrow) and stimuli in the right column have the most [i]-like F2 frequency (2200 Hz, dotted arrow). Stimuli in the upper row have the most [i]-like tilt spectral tilt (0 dB∕oct, dotted line) and stimuli the bottom row have the most [u]-like spectral tilt (−12 dB∕oct, dashed line).
Figure 1.
Corner stimuli of the target vowel matrix used for all experiments. Stimuli in the left column have the most [u]-like F2 frequency (1000 Hz, dashed arrow) and stimuli in the right column have the most [i]-like F2 frequency (2200 Hz, dotted arrow). Stimuli in the upper row have the most [i]-like tilt spectral tilt (0 dB∕oct, dotted line) and stimuli in the bottom row have the most [u]-like spectral tilt (−12 dB∕oct, dashed line).
Sinusoidal pole precursors
A novel method of generating vowel-like, non-speech precursors was used to create sounds that shared some physical characteristics of speech but had no silent intervals and were not perceived as speech. Precursors had continuously varying local spectral peaks with a full representation of energy across the spectrum similar to speech. Four poles or resonances with sinusoidal frequency modulation were designed to cover the entire spectrum from 100 to 4000 Hz with a reasonably smooth −6 dB∕oct tilt, similar to long-term average speech spectra (see Appendix for details). The “voicing” source for precursors was a sawtooth waveform with a fundamental frequency of 100 Hz, matching the fundamental frequency of vowel targets. Center frequencies, Fc, of the four poles were 600, 1600, 2600, and 3600 Hz with nominal BWs equal to 10% of each Fc. The frequency excursion, Ac, of each pole was ±430 Hz. The modulation rate of each pole was 4 Hz, meaning that the entire spectrum was sampled every 250 ms. The phase of each pole was reset every cycle with 50-point hanning window onset∕offset ramps such that every 250-ms sample had a unique spectral microstructure. The starting phase, θ, for each pole was sampled without replacement at π∕2, π, 3∕2π, or 2π, with every phase occurring over a 1000-ms precursor duration. In this way, unique precursors could be generated with a set size varying from 24 for the 250-ms duration precursors to more than 1.1 × 10⁹ for the 2000-ms duration precursors.
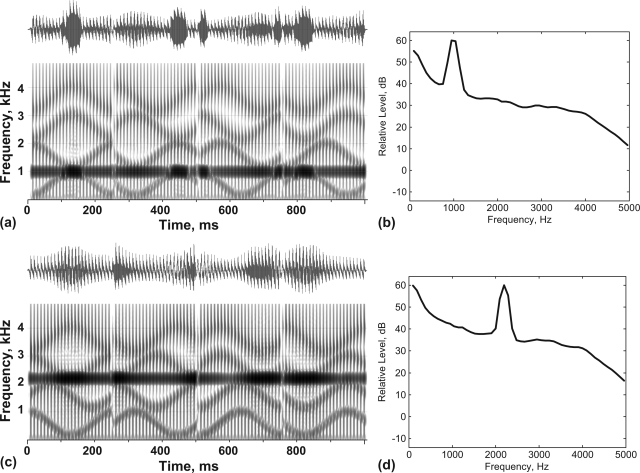
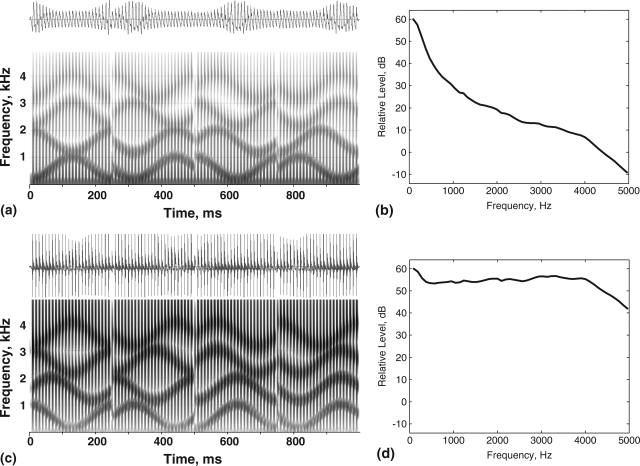
Precursors were generated with a 48828 Hz sampling rate and 24-bit resolution, and given 10-ms cosine2 onset∕offset ramps. In different experiments, precursors were filtered to match either the F2 frequency (experiment 1A) or tilt (experiment 1B) of the following vowel. F2-matched precursors were filtered by a 1200-tap FIR filter centered on vowel F2 (1000–2200 Hz in 300-Hz steps). Filters had 24.5 dB gain with 50-Hz wide passbands and ±165-Hz stopbands. As shown in Fig. 2, because the spectral composition of precursors was modulated, additional energy corresponding to target F2 increased and decreased across the duration of precursors. Examples of tilt-matched precursors are shown in Fig. 3. Tilt-matched precursors were filtered in the same way as vowel targets but with 200-tap FIR filters (equivalent to 90-tap with a sampling rate of 22050 Hz). Because precursors already had constant −6 dB∕oct tilt, filter slopes varied from −6 to +6 dB∕oct to achieve the desired final slopes. Filtered precursors were then low-pass filtered with a 86-tap FIR filter with an upper cutoff at 4800 Hz and a stopband of −90 dB at 6400 Hz. They were then scaled to the same 75-dB SPL level as the vowels. Vowels were appended to their matching precursors with a 50-ms interstimulus silent interval.
Figure 2.
Sample 1000-ms precursors with 4-Hz modulation rate for experiment 1A. (a) Time waveform and spectrogram for a sample precursor filtered to have a spectral peak that matched the F2 frequency (1000 Hz) of the following vowel. (b) Spectrum of (a). (c) Time waveform and spectrogram for a sample precursor filtered to have a spectral peak that matched the F2 frequency (2200 Hz) of the following vowel. (d) Spectrum of (c). Note that because the spectral composition of precursors was modulated, additional energy corresponding to target F2 increased and decreased across the duration of precursors.
Figure 3.
Sample 1000-ms precursors with 4-Hz modulation rate for experiment 1B. (a) Time waveform and spectrogram for a sample precursor with −12 dB∕oct spectral tilt. (b) Spectrum of (a). (c) Time waveform and spectrogram for a sample precursor with 0 dB∕oct spectral tilt. (d) Spectrum of (c).
Method
Listeners
Listeners were undergraduate students from the University of Wisconsin-Madison and participated as part of course credit. No listener participated in more than one experiment. One to three listeners participated in the experiments concurrently. Each individual was seated in an isolated single-walled sound chamber and had a unique random presentation order of stimuli. Listeners were recruited for each experiment until data were collected on at least 20 listeners. All reported that they were native speakers of American English and had normal hearing. Because of the large number of conditions, a between-subjects experiment design was used and a new group of listeners was recruited for each condition. Nine groups of listeners identified the 25-vowel matrix in one of the following conditions: No precursor (n = 23); F2-matched precursors (experiment 1A) with durations of 250, 500, 1000, or 2000 ms (n = 21, 20, 20, and 23, respectively); and, tilt-matched precursors (experiment 1B) with durations of 250, 500, 1000, or 2000 ms (n = 20, 21, 21, and 21, respectively).
Procedure
Following one warm-up block consisting of the full matrix (25 trials), data were collected on eight subsequent blocks (200 trials). Stimuli were presented diotically to listeners through Beyerdynamic DT150 headphones at an average level of 75 dB SPL. In a two-alternative forced-choice task, listeners indicated their responses by pressing one of two buttons labeled “ee” and “oo.”
Results
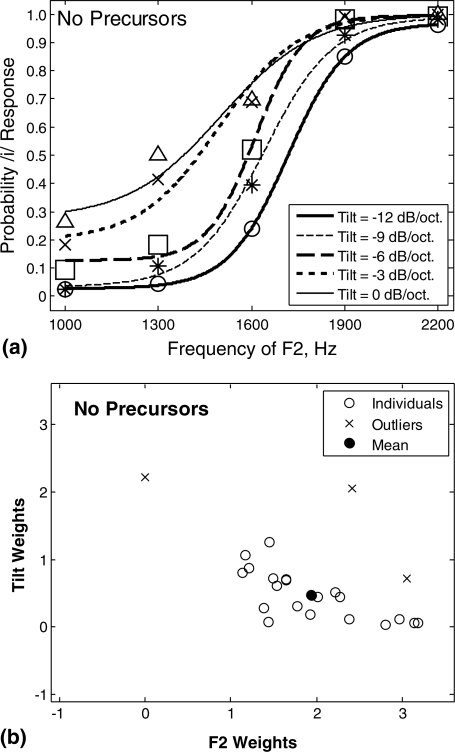
Figure 4a displays mean identification rates for the control condition in which no precursors were present. The probability of listeners responding ∕i∕ is plotted as a function of F2 frequency (abscissa) for each vowel tilt with circles, asterisks, squares, x’s, and triangles representing mean data for −12, −9, −6, −3, and 0 dB∕oct, respectively. For display purposes, data points for each vowel tilt were fit to a maximum likelihood psychometric function using the psignifit toolbox for matlab (Wichmann and Hill, 2001).3 Results showed that listeners were highly influenced by F2, with identification rates that approach floor or ceiling performance near F2-series endpoints. The influence of tilt is indicated by the systematic separation of functions for each vowel tilt, with increasingly greater identification rates for ∕i∕ (leftward shift of functions along the abscissa) with progressively flatter vowel tilts. To test for differences in the influence of F2 and spectral tilt on perception of vowel targets, listeners’ responses were regressed against F2 and spectral tilt of each stimulus using a logistic model (glmfit in matlab). For each listener, weights for each acoustic property (F2 and spectral tilt) were obtained from standardized regression coefficients. A scatter plot of F2 (abscissa) and tilt (ordinate) weights for each listener (open circles) in the control condition is shown in Fig. 4b. The x’s are excluded multivariate outliers and the filled circle is the mean of the remaining data. The minimum generalized variance (MGV) method was used to detect outliers (Wilcox, 2005, pp. 228–231). The mean weights and standard errors (in parentheses) for vowel targets in isolation were 1.94 (0.15) for F2 and 0.47 (0.08) for tilt.
Figure 4.
(a) Mean identification rates for vowels in isolation (i.e., no precursors) with probability of responding ∕i∕ as a function of F2 frequency plotted separately for each vowel tilt. Circles, asterisks, squares, x’s, and triangles represent mean data for vowel tilts of −12, −9, −6, −3, and 0 dB∕oct, respectively. Maximum likelihood fits of identification rates are displayed for mean data at each vowel tilt as different lines (see legend). (b) Scatter plot of F2 (abscissa) and tilt (ordinate) weights (standardized regression coefficients) for each listener in the control condition plotted as open circles. x’s indicate excluded multivariate outliers and the filled circle is the mean of the remaining data.
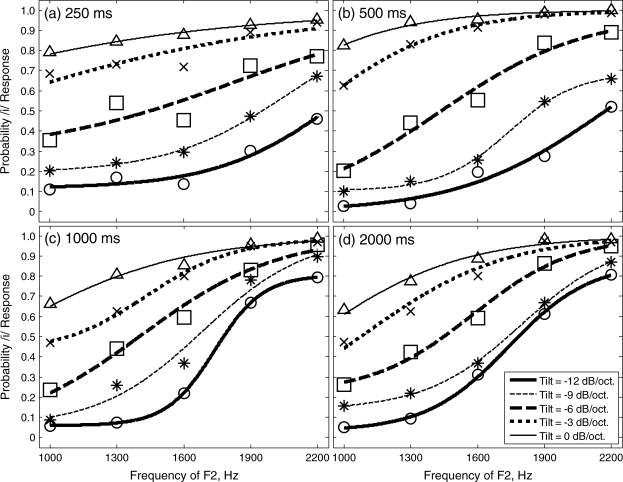
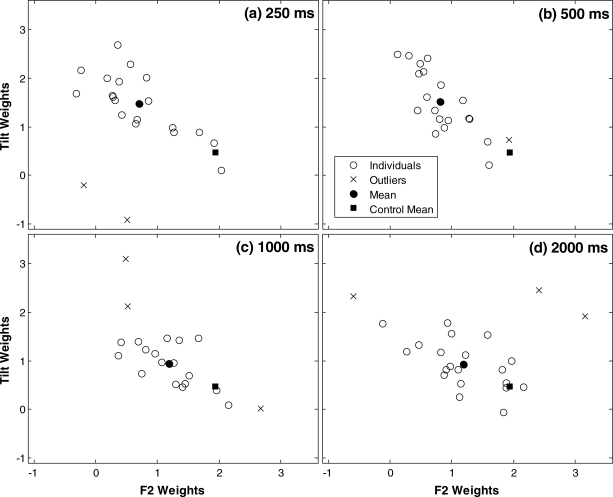
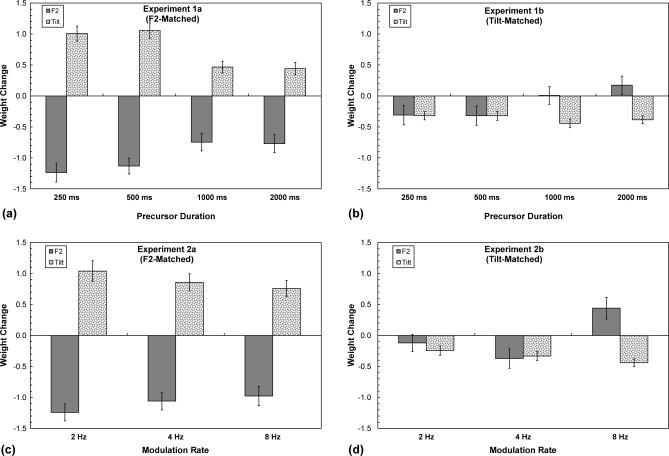
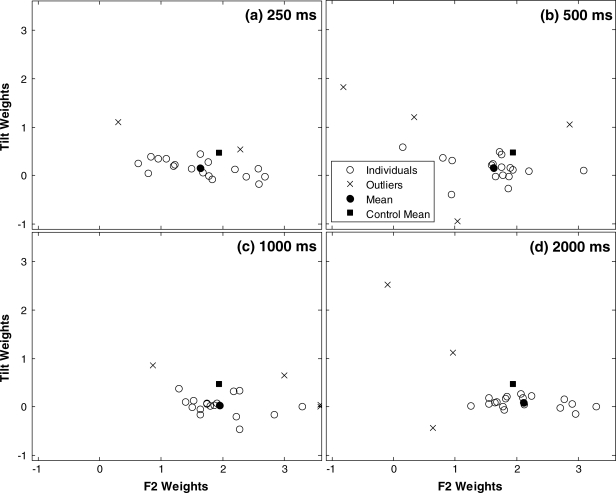
Panels in Fig. 5 display identification rates and maximum likelihood fits of mean data for different F2-matched precursor durations in experiment 1A. As demonstrated by large separations of identification functions representing different vowel tilts, it is clear that F2-matched precursors resulted in a greater influence of tilt for all precursor durations compared to the control with no precursors [Fig. 4a]. The mean F2 and tilt weights across individuals and standard errors are shown for each duration in Table TABLE I.. For each precursor duration, panels in Fig. 6 display scatter plots of F2 and tilt weights, with x’s representing excluded outliers, the filled circle representing the mean of the remaining points, and the filled square representing the mean from the control experiment with no precursors. Perceptual calibration to F2-matched precursors is exhibited by a decrease in F2 weights and an increase in tilt weights, that is, a shift toward the upper left quadrant, relative to the control condition. For each precursor duration, the change in both F2 and tilt weights was statistically significant (p ≤ 0.01, for each comparison after Bonferroni correction on Student’s t-test). It can be seen that as precursor duration decreases, the point representing the mean for each experiment (filled circles) moves farther from the point representing the mean for the control (filled square), indicating that perceptual calibration increases with decreases in the duration of F2-matched precursors. This is better viewed in Fig. 7a, which displays differences in weights (i.e., perceptual calibration) for vowels with different durations of F2-matched precursors compared to vowels in isolation. A multivariate analysis of variance (MANOVA) revealed that the pattern of weights differed as a function of precursor duration [Λ = 0.79, F(3,71) = 3.2, p < 0.01]. Separate analyses of variances (ANOVAs) were conducted with precursor duration as the dependent variable and F2 weights and tilt weights as the independent variables. ANOVA results revealed that both F2 weights and tilt weights depended on precursor duration [F(3,71) = 4.0, p = 0.01] and [F(3,71) = 6.2, p < 0.001], respectively. Tukey honestly significantly difference (HSD) post-hoc tests showed that the change in F2 weight for the 250-ms precursor was significantly greater compared to the 1000- and 2000-ms precursors (p < 0.05 for each). No other differences in F2 weights were significant (p > 0.05). In addition, changes in tilt weights were significantly greater for shorter duration precursors (250 and 500 ms) compared to longer duration precursors (1000 and 2000 ms) (p < 0.05). Tilt weights did not differ between 250- and 500-ms precursor durations or between 1000- and 2000-ms precursor durations (p > 0.05).
Figure 5.
Plotted in different panels are mean identification rates for different durations of F2-matched precursors in experiment 1A. See Fig. 4a caption for details.
Table 1.
Means across listeners in experiments 1A (F2-matched precursors) and 1B (tilt-matched precursors) of standardized logistic regression weights for F2 and tilt at each precursor duration (standard errors in parentheses). Mean F2 and tilt weights and standard errors for vowel targets in isolation were 1.94 (0.15) and 0.47 (0.08), respectively.
| Experiment 1A (F2-matched) precursor duration | ||||
|---|---|---|---|---|
| 250 ms | 500 ms | 1000 ms | 2000 ms | |
| F2 | 0.70 | 0.81 | 1.19 | 1.17 |
| (0.16) | (0.10) | (0.12) | (0.14) | |
| Tilt | 1.48 | 1.52 | 0.94 | 0.91 |
| (0.15) | (0.16) | (0.16) | (0.12) | |
| Experiment 1B (tilt-matched) precursor duration | ||||
|---|---|---|---|---|
| 250 ms | 500 ms | 1000 ms | 2000 ms | |
| F2 | 1.63 | 1.62 | 1.95 | 2.11 |
| (0.16) | (0.16) | (0.13) | (0.14) | |
| Tilt | 0.15 | 0.15 | 0.03 | 0.09 |
| (0.05) | (0.16) | (0.05) | (0.03) | |
Figure 6.
Scatter plots of individual F2 and tilt weights (open circles) for each duration of F2-matched precursors in experiment 1A. x’s indicate excluded multivariate outliers, the filled circle is the mean of the remaining data, and the filled square is the mean of the control condition from Fig. 4b.
Figure 7.
For experiments 1 and 2 (top and bottom panels, respectively), the change in F2 weights (solid bars) and tilt weights (speckled bars) attributed to F2-matched precursors (left panels) and tilt-matched precursors (right panels) are plotted as a function of precursor duration. Error bars represent standard error.
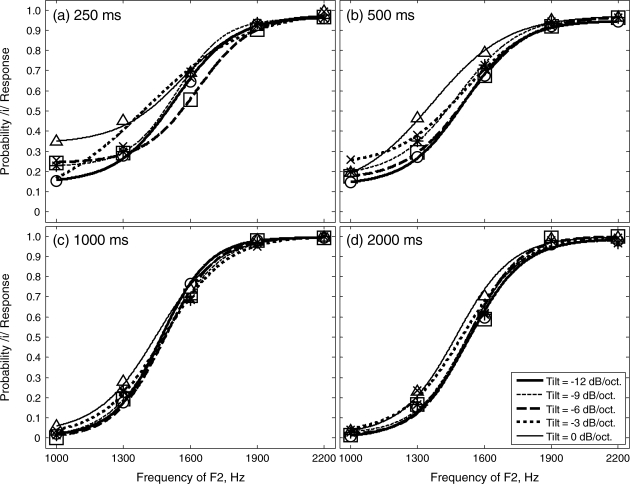
Panels in Fig. 8 display identification rates and maximum likelihood fits of mean data for different tilt-matched precursor durations in experiment 1B. Compared to F2-matched precursors (experiment 1A), tilt-matched precursors resulted in less influence of tilt at all precursor durations as demonstrated by overlapping identification functions representing different vowel tilts. Mean F2 and tilt weights across individuals and standard errors are shown for each duration in Table TABLE I.. For each precursor duration, panels in Fig. 9 display scatter plots of F2 and tilt weights in the same manner as Fig. 6. This time, perceptual calibration to tilt-matched precursors is exhibited by an increase in F2 weights and a decrease in tilt weights, that is, a shift toward the lower right quadrant, relative to the control condition. For all precursor durations, the decrease in tilt weights was statistically significant (p < 0.05 for the 500-ms precursors, and p < 0.01, for all other durations after Bonferroni correction on Student’s t-test). There was no significant difference between F2 weights in the control and the precursor conditions (p > 0.05, for each comparison). There is a trend toward smaller F2 weights for the 250- and 500-ms conditions because of a relative bias for ∕i∕ responses for low F2 frequencies (that is, the identification rates for the 1000-Hz F2 series endpoint do not pass through 0).
Figure 8.
Plotted in different panels are mean identification rates for different durations of tilt-matched precursors in experiment 1B. See Fig. 4a caption for details.
Figure 9.
Scatter plots of individual F2 and tilt weights for each duration of tilt-matched precursors in experiment 1B. See Fig. 6 caption for details.
Figure 7b displays differences in weights for vowels with different durations of tilt-matched precursors (re: vowels in isolation). A MANOVA revealed that differences in the pattern of weights as a function of precursor duration were only marginally significant [Λ = 0.85, F(3,66) = 1.85, p = 0.095; Roy’s Largest Root = 0.14, F(3,66) = 3.1, p = 0.03]. ANOVAs revealed that, while tilt weights did not depend on precursor duration [F(3,66) = 1.6, p > 0.05], F2 weights did [F(3,66) = 2.9, p = 0.04]. Tukey HSD post-hoc tests showed that F2 weight for the 2000-ms precursor was marginally greater compared to the 250- and 500-ms precursors (p = 0.086 and p = 0.085, respectively), suggesting that listeners were possibly more sensitive to F2 cues in the vowel targets following the longer tilt-matched precursor.
Discussion
It was hypothesized that perceptual calibration to spectrally local properties (i.e., F2) would be equally evident with short- and long-duration precursors because detailed spectral changes in speech, like formant onsets, offsets, and transitions, are relatively brief (Lehiste and Peterson, 1961). In addition, low-level signal analysis at the auditory periphery and lower brainstem is characterized by short time constants and narrow frequency tuning. Consistent with our hypothesis, there was significant perceptual calibration to the shortest duration F2-matched precursors (250 ms). Unexpectedly, perceptual calibration was greatest for short-duration precursors (250 and 500 ms) and weakest for long-duration precursors (1000 and 2000 ms). That is, relative to vowels in isolation, the largest changes in F2 and tilt weights were observed with short-duration F2-matched precursors and were significantly smaller than changes observed with long-duration precursors.
One explanation for the pattern of results for F2-matched precursors is that onsets are more heavily weighted by processes responsible for perceptual calibration to spectral peak information. Greater effects for shorter than longer precursor durations were also found by Coady et al. (2003). Coady et al. examined contrast effects for a ∕ba∕ to ∕da∕ series varying in F2 onset frequency (low and high, respectively) following vowels and harmonic stimuli with spectra complementary to vowels (troughs replaced peaks and vice versa). For precursors composed of spectral peaks with energy just below F2 onset for ∕ba∕ or just above F2 onset for ∕da∕, effects did not depend on duration and were not diminished by intervening silence or acoustic energy with a neutral spectrum. However, for precursors composed of spectral troughs in the place of spectral peaks, effects depended on the time between precursor onset and target onset (i.e., the inter-onset interval) and not on the duration per se. Therefore, when inter-onset intervals were made longer by introducing longer silent intervals or by making precursors longer, contrast effects diminished.
Our results and results of Coady et al. (2003) are consistent with the viewpoint that at least some forms of adaptation operate mostly to enhance spectral properties of onsets (e.g., Delgutte, 1996; Houtgast, 1974). With adaptation, nerve fibers with characteristic frequencies (CFs) near a peak in the spectrum have an initial strong response that quickly decays so that they are relatively less responsive to continuation of energy in that region (Smith, 1977, 1979). If subsequent energy falls in a different spectral region, where nerve fibers are relatively non-adapted, the response will be comparatively greater than in the adapted region. This is one way the auditory system calibrates to reliable spectral characteristics and increases sensitivity to contrast at shorter timescales.
Recall that F2-matched energy in our precursors was not constant but rather increased and decreased with changes in frequencies of the sinusoidal resonances, with energy maxima occurring once or twice per cycle and not usually at onset (cf. Fig. 2). Another hypothesis for the decrease in perceptual calibration to F2 with increased precursor duration is that listeners calibrated to the final pass of the sinusoidal filter through the F2-matched peak instead of the initial pass as predicted by a mechanism that emphasizes onsets. That is, with each successive pass of the sinusoidal filter (i.e., a single sampling of the entire spectrum), spectral peak information in the precursor decreased as each sample is redundant with the first. The net result is reduced effectiveness of the final peak to influence perception of a vowel target. A similar argument has been made for perceptual calibration of the binaural system. Hafter et al. (1988) examined the relationship between listeners’ lateralization judgments and characteristics of a train of dichotic clicks differing in intensity or phase [i.e., with a given interaural level difference (ILD) or interaural timing difference (ITD), respectively]. In a two-alternative, forced-choice task, the ILD∕ITD was reversed between intervals. The listeners’ task was to indicate the direction of perceived movement of the sound source. With an increasing number or rate of click presentation, threshold for ITDs and ILDs (i.e., perception of movement) decreased at a rate less than predicted by signal detection theory (by the square root of n; Green and Swets, 1966). In effect, the authors found that lateralization depended on the length (duration) of the click train with each successive click being less informative than its predecessor in cueing perceived movement (i.e., less effective in further reducing threshold). Hafter et al.’s findings suggest that the critical feature for perceptual calibration to F2 for our precursors may be the repetition of information in spectral peaks rather than the duration or onsets per se.
Compared to F2-matched precursors which had widely separated identification functions across vowel tilts, tilt-matched precursors had overlapping identification functions across vowel tilts at all precursor durations. Thus, effects for spectral peaks contrast with effects for spectral tilt. Perceptual calibration was hypothesized to be greater with increased precursor duration because of greater opportunities to sample the broadband spectrum. Results of experiment 1B, at best, showed weak evidence that increased precursor duration per se results in increased perceptual calibration to spectral tilt. The evidence rests on a marginally significant increase in F2 weights for the 2000-ms tilt-matched precursor compared to the 250- and 500-ms precursors. It is possible that providing more samples of the spectrum using precursors with longer durations or with greater rates of frequency modulation will lead to greater perceptual calibration.
EXPERIMENT 2: EFFECTS OF PRECURSOR MODULATION RATE
Rationale
The purpose of experiment 2 is to separate confounding variables of information (sampling) and time on processes of auditory perceptual calibration when varying precursor duration. For experiment 1, it was hypothesized that longer duration tilt-matched precursors would lead to greater perceptual calibration because they provide increased opportunities to sample the spectrum (i.e., greater information), hence, provide more stable estimates of reliable global spectral properties. Only weak evidence was found that increasing precursor duration was effective at inducing greater perceptual calibration. Furthermore, longer duration F2-matched precursors in experiment 1 were significantly less effective at inducing perceptual calibration compared to shorter duration precursors. One hypothesis is that listeners calibrate to the most recent instance of the F2-matched peaks, which decreases its informational value with each preceding repetition. Here, we explicitly test both of these hypotheses by keeping duration constant and varying the rate of information presentation.
Method
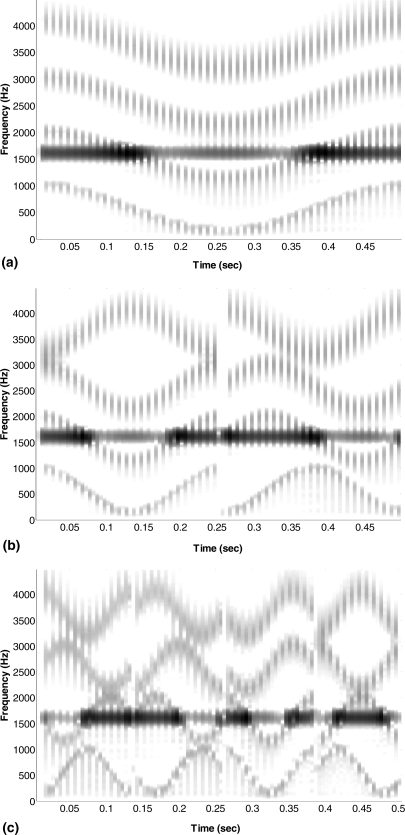
Four new groups of listeners identified the 25-vowel matrix following 500-ms precursors. Precursors were F2-matched to the following vowel (experiment 2A) with 2- or 8-Hz sinusoidal resonance modulation (n = 21 for both) or were tilt-matched (experiment 2B) with 2- or 8-Hz modulation (n = 21 and 20, respectively). Figure 10 shows graphically how the amount of spectral sampling varied with resonance modulation frequency. For the 2-Hz modulation rate (top panel), sinusoidal resonances sample the entire spectrum once during the 500-ms precursor duration, compared to the 8-Hz modulation rate (bottom panel) in which the entire spectrum is sampled four times. This increase in spectral sampling with modulation rate is equivalent to increasing the duration of the fixed 4-Hz modulated precursors in experiment 1 from 250 to 1000 ms. Precursors were generated and filtered in the same manner as in experiment 1. For each condition, listeners heard each target in the 25-vowel matrix once per trial block in randomized order. Following one warm-up block consisting of the full matrix, data were collected on eight subsequent blocks (200 trials). Stimulus presentation and response details were the same as in experiment 1.
Figure 10.
Spectrograms of sample precursors with 2-, 4-, or 8-Hz modulation rates (top, middle, and bottom panels, respectively) for experiment 2A that were filtered to have a spectral peak that matched the F2 frequency (1600 Hz) of the following vowel. Increases in modulation rate increases the number of times the full spectrum is sampled.
Results and discussion
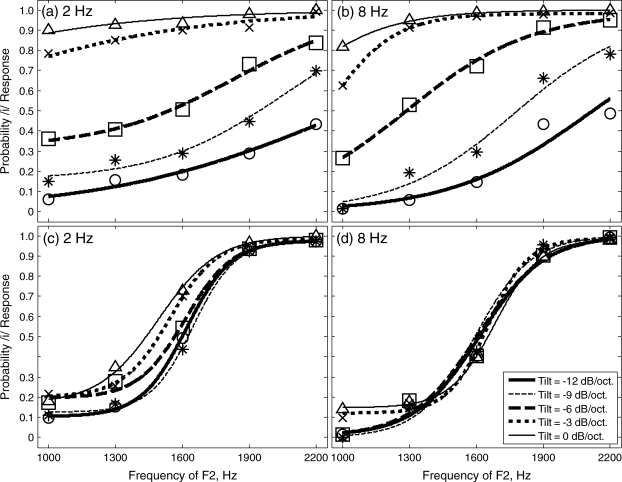
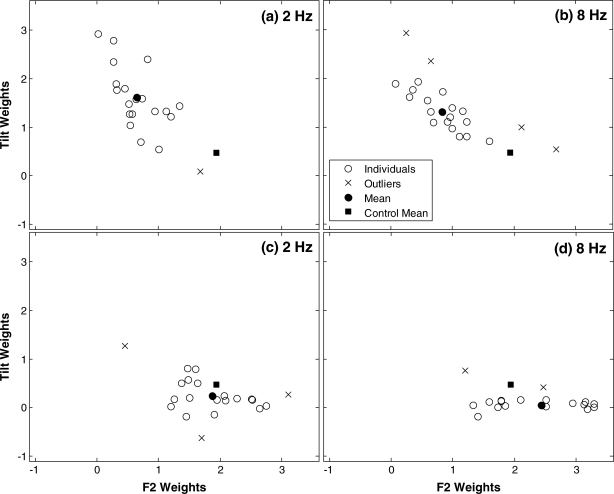
Top panels (a) and (b) in Fig. 11 display identification rates and maximum likelihood fits of mean data for F2-matched precursors and bottom panels (c) and (d) display mean data for tilt-matched precursors. Mean F2 and tilt weights across individuals with standard errors are shown for each condition in Table TABLE II. along with data for the 500-ms precursors in experiment 1, which represent the 4-Hz condition. For each condition, panels in Fig. 12 display scatter plots of F2 and tilt weights [not shown is one outlier in panel (a) with F2 and tilt weights of 0.31 and 4.2, respectively, and one outlier in panel (d) with F2 and tilt weights of 5.4 and 0.0, respectively].
Figure 11.
Mean identification rates for 2- and 8-Hz modulation rates of F2-matched precursors in experiment 2A are plotted in panels (a) and (b), respectively. 2- and 8-Hz modulation rates of tilt-matched precursors in experiment 2B are plotted in panels (c) and (d), respectively. See Fig. 4a caption for details.
Table 2.
Means across listeners in experiments 2A (F2-matched precursors) and 2B (tilt-matched precursors) of standardized logistic regression weights for F2 and tilt at different sinusoidal modulation rates (standard errors in parentheses). Data for the 4-Hz condition are from 500-ms precursors in experiment 1.
| Experiment 2A (F2-matched) modulation rate | |||
|---|---|---|---|
| 2 Hz | 4 Hz | 8 Hz | |
| F2 | 0.65 | 0.81 | 0.83 |
| (0.08) | (0.10) | (0.10) | |
| Tilt | 1.61 | 1.52 | 1.31 |
| (0.15) | (0.16) | (0.10) | |
| Experiment 2B (tilt-matched) modulation rate | |||
|---|---|---|---|
| 2 Hz | 4 Hz | 8 Hz | |
| F2 | 1.87 | 1.62 | 2.43 |
| (0.12) | (0.16) | (0.20) | |
| Tilt | 0.24 | 0.15 | 0.04 |
| (0.07) | (0.06) | (0.03) | |
Figure 12.
Scatter plots of individual F2 and tilt weights for 2- and 8-Hz modulation rates of F2-matched precursors in experiment 2A are plotted in panels (a) and (b), respectively. 2- and 8-Hz modulation rates of tilt-matched precursors in experiment 2B are plotted in panels (c) and (d), respectively. See Fig. 6 caption for details.
For F2-matched precursors, a MANOVA revealed no significant differences in the pattern of weights as a function of precursor modulation rate [Λ = 0.92, F(2,52) = 1.1, p > 0.05]. Figure 7c displays differences in weights (re: vowels in isolation) for vowels with F2-matched precursors of different modulation rates. The lack of an effect for modulation rate differs from experiment 1A in which perceptual calibration significantly increased for shorter duration precursors. Because perceptual calibration to F2 was constant when precursor duration was held constant and information rate varied in experiment 2A, this suggests that in experiment 1A precursor duration (and inter-onset interval, by inference) was the critical feature for observed differences in perceptual calibration to F2 and not repetition of spectral peak information.
Unlike F2-matched precursors, the pattern of weights for tilt-matched precursors differed significantly as a function of the precursor modulation rate [Λ = 0.72, F(2,49) = 4.3, p < 0.01]. ANOVAs revealed that both F2 and tilt weights depended significantly on the precursor modulation rate [F(2,49) = 7.0, p < 0.01] and [F(2,49) = 3.2, p < 0.05], respectively. Figure 7d displays differences in weights (re: vowels in isolation) for vowels with different modulation rates of tilt-matched precursors. Tukey HSD post-hoc tests revealed that the fastest modulation rate, 8 Hz, resulted in a significantly greater change in F2 weights compared to slower modulation rates, 4 and 2 Hz (p < 0.001 and p < 0.05, respectively) and a significantly greater change in tilt weights compared to the 2-Hz modulation rate (p < 0.05). No other differences were significant (p > 0.05). This pattern of results indicates that, indeed, providing increased opportunities to sample the spectrum results in a more stable estimate of reliable long-term global spectral properties thereby increasing perceptual calibration to tilt.
GENERAL DISCUSSION
Summary
Using synthesized vowels and frequency-modulated resonance filters, the current studies were conducted to better understand the temporal course of auditory perceptual calibration, in which relatively reliable filter characteristics of the environment or listening context are perceptually attenuated or “inverse filtered” (Watkins and Makin, 1994). Two filter characteristics, local spectral peaks and gross spectral tilt, were examined because of their codetermination in the phonetic identity of the vowels ∕u∕ and ∕i∕. It was hypothesized that the perceptual effectiveness of global spectral properties in a spectrally varying context would increase with longer sampling periods. This is because, unlike spectrally local properties where a single exposure is sufficient to highlight the presence of a spectral peak, more information about the entire spectrum (i.e., a greater number of coefficients in a cepstral analysis of the frequency envelope) is needed to infer spectral tilt (the relative distribution of low- vs high-frequency energy).
Overall, our findings are informative with respect to signal processing schemes that are capable of producing rapid spectral changes. For both F2- and tilt-matched precursors, results showed strong perceptual calibration (change in F2 and tilt weights in a direction away from those for vowel identification in isolation) for the shortest duration precursors (250 ms). Perceptual calibration to F2-matched precursors was unexpectedly greater for short-duration precursors compared to long-duration precursors. The finding that modulation rate of the resonance filters in the precursors had no effect on perceptual calibration suggests that for F2-matched precursors, the key influence on perceptual calibration was duration and not repetition of peak information. One hypothesis for this unexpected finding is that onsets are more heavily weighted by processes responsible for perceptual calibration to detailed spectral information. Evidence supports the physiologic importance of onsets in auditory nerve fibers, cochlear nucleus (e.g., Rhode, 1991; Winter and Palmer, 1995; Delgutte et al., 1998), inferior colliculus (Delgutte et al., 1998), and at increasing levels of the auditory system up to auditory cortex (Heil, 1997a,b; Phillips and Hall, 1990). Onsets between precursors and targets are closer in time with shorter duration precursors and consequently result in greater perceptual calibration. It is important to note that although perceptual calibration to longer duration F2-matched precursors was relatively weaker, it still exerted substantial influence on listeners’ use of F2 and spectral tilt when identifying following vowels.
Because our precursors lacked modulations in amplitude envelope, it is possible that perceptual calibration would be stronger with speech precursors, which are characterized by multiple onsets (cf. Kiefte and Kluender, 2008). That is, in the absence of intervening silence, the effectiveness of the responsible mechanisms gradually decreases with time. Future studies examining temporal properties of auditory perceptual calibration will benefit from a detailed examination of the importance of different onset properties on auditory perceptual calibration (e.g., rise time, relative phase, and onset synchrony across frequency). Furthermore, it is worth investigating whether continuous amplitude modulation associated with repeated speech onsets elicits stronger responses from processes responsible for perceptual calibration, thus showing greater effects.
For tilt-matched precursors, there was only weak evidence that the longest duration precursor, 2000 ms, was more effective (greater F2 weights) than short-duration precursors. Part of the reason for this is that spectral tilt in the identification of the vowels ∕u∕ and ∕i∕ in isolation (control condition) is much less perceptually salient since weights for F2 are large and weights for tilt are small. With a tilt-matched precursor, the only way to observe perceptual calibration is an increase in F2 weights and a decrease in tilt weights. With the 250-ms precursor, tilt weights were decreased significantly with very little room to show further effect. However, keeping tilt-matched precursor duration constant and varying precursor modulation rate demonstrated that providing a greater number of samples of the broadband spectrum results in greater perceptual calibration, presumably because the relative certainty of the long-term spectrum is greater.
Findings for tilt-matched precursors demonstrate that the perceptual system is sensitive not only to changes in tilt (Alexander and Kluender, 2008, 2009) but also to reliability of tilt across time. Again, while the role of spectral tilt in phonetic perception is unresolved (Hillenbrand et al., 1995; Bladon and Lindblom, 1981; Zahorian and Jagharghi, 1993; Ito et al., 2001), changes in tilt between speech segments have been shown to greatly influence speech perception by normal-hearing listeners (Alexander and Kluender, 2008), and especially hearing-impaired listeners (Alexander and Kluender, 2009) for whom spectral peaks are often reduced by abnormal cochlear filtering. The potential role that global spectral properties plays in speech perception is also demonstrated here with F2-matched precursors. Perceptual calibration of F2 reduced the effectiveness of spectrally local information and significantly increased the influence of a secondary cue, spectral tilt, on vowel categorization.
Potential mechanisms
A primary finding is that perceptual calibration (a de-emphasis of spectral similarities between adjacent speech segments) to both F2 and spectral tilt operates on a very short time scale, less than 250 ms. In light of earlier findings with contrast effects (an emphasis of spectral differences between adjacent speech segments), the findings here are not surprising to the extent to that both share similar mechanisms. For example, Coady et al. (2003) found contrast effects in the perception of a ∕ba∕–∕da∕ series varying in F2 onset frequency for preceding sounds with low- or high-frequency peaks with durations in the tens of milliseconds. Alexander and Kluender (2008, 2009) also found enhanced sensitivity to changes in spectral tilt in the perception of ∕ba∕ and ∕da∕ in the presence a 250-ms leading vowel (∕a∕).
Masking
It has been well established that peripheral masking is not responsible for contrast effects. Precursors that are incapable of energetic masking have been shown to induce contrast effects, including precursors distant in time (Holt and Lotto, 2002; Holt 2005, 2006), precursors with dichotic presentation (Holt and Lotto, 2002), and precursors with spectral complements (spectral troughs in place of peaks; cf. Coady et al., 2003). Likewise, findings here indicate that masking is not the primary mechanism responsible for perceptual calibration, at least for F2-matched precursors. First, spectral peaks associated with the matching filters increased and decreased as energy from modulated resonances passed through or near them. Second, longer duration F2-matched precursors resulted in significantly less perceptual calibration, opposite to what one might expect from an energy-based masking account.
Perceptual grouping
Another possible explanation, at least for findings related to F2-matched precursors, is auditory perceptual grouping (e.g., Bregman, 1990). Such explanations rest on assumptions that an auditory element (in this case, a spectral peak) cannot belong to two or more independent sound sources (in this case, a precursor “background” and a vowel target) so that when it is perceptually assigned to one source, it is in a sense, denied any contribution to the opposing source. Thus, an argument is that the F2 peaks in the vowel targets were grouped with the peaks in the precursor as separate and distinct auditory objects or streams. According to the perceptual grouping hypothesis, listeners would have then been forced to rely on spectral tilt alone for identification. While this hypothesis cannot be definitively ruled out, several observations weaken the argument. First, the precursor itself contained varying and unpredictable spectral content, with the intensity of the filtered peak increasing and decreasing randomly over its duration. This should have discouraged grouping processes from operating. Second, there are notable demonstrations that acoustic information can contribute simultaneously to perception of apparently distinct sources, including those involving speech (e.g., Liberman et al., 1981; Moore et al., 1986; see Shinn-Cunningham et al., 2007). Thus even if a tonal element was perceived to be common across precursor and target, this would not preclude other processes from operating.
Adaptation-like effects
A number of neurophysiological studies by Delgutte and colleagues support the importance of adaptation in speech perception, especially for enhancing spectral contrast between successive speech segments (Delgutte, 1980, 1986, 1996; Delgutte et al., 1996; Delgutte and Kiang, 1984). With adaptation, nerve responses with CFs near a peak in the spectrum have an initial strong response that quickly decays so that they are relatively less responsive to a continuation of energy in that region. If subsequent energy falls in a different spectral region, where nerve fibers are relatively non-adapted, the response will be comparatively greater than in the adapted region. Across a population of fibers with a large response difference across frequency, as for a signal with steeply sloping spectral tilt, adaptation would have the effect of flattening spectral tilt in the neural output over time. This may be one way the auditory system calibrates to reliable filter characteristics and increases sensitivity to contrast. Delgutte et al. (1996) notes that adaptation-like effects occur on many time scales, with longer time scales occurring at higher levels in the auditory system. For example, single nerve fibers in the inferior colliculus have been found to increase their response properties following changes from predictable acoustic patterns (Péréz-González et al., 2005; Dean et al., 2008). Higher in the auditory system, Ulanovsky et al. (2003) identify nerve fibers in primary auditory cortex that are sensitive to relative probabilities of different frequency tones embedded in a long tone sequence.
It is important to note that demonstrations of contrast and calibration in higher structures of the auditory system do not imply reduced contributions of peripheral mechanisms. For example, descending (efferent) auditory pathways project all the way back to outer hair cells. Evidence of feedback loops is provided by findings that inner hair cell receptor potentials are at least indirectly influenced by outer hair cell inhibition, with a decompression of the rate-level function leading to an increase in the sensitivity of auditory nerve fibers (Kawase et al., 1993). In addition, the efferent system appears to be sharply tuned at least for projections from the inferior colliculus to the superior olivary complex (Ota et al., 2004), rendering it capable of spectrally detailed auto-calibration. In turn, projections from the medial olivary complex (MOC) to outer hair cells provide adjustments of basilar membrane tuning that have been hypothesized to improve resolution of signals against background noise (e.g., Kawase et al., 1993; Kawase and Liberman, 1993; May and Mequone, 1995; Winslow and Sachs, 1988; Kirk and Smith, 2003). In summary, it is likely that both central and peripheral mechanisms work together to contribute to auditory perceptual calibration and contrast processes.
Mechanisms involving the medial olivocochlear reflex (MOCR) are an attractive explanation for some of our observed findings for several reasons. First, the MOC is innervated by neurons originating from both cochlear nuclei with approximately 2∕3 originating from the ipsilateral side and 1∕3 from the contralateral side (Liberman and Brown, 1986). This innervation pattern could render the MOC capable of responding to dichotic presentations of precursor and target (e.g., Holt and Lotto, 2002). In addition, MOCR effects on the suppression of stimulus-frequency otoacoustic emissions demonstrate a buildup and decay on the order of hundreds of milliseconds (Backus and Guinan, 2006), which could explain the gradual decrease in perceptual calibration in response to longer duration F2-matched precursors. Finally, Strickland (2008) provides a psychophysical account of MOCR function showing that preceding on-frequency stimulation results in a graded decrease in cochlear gain at the signal place, and off-frequency stimulation results in a graded increase in cochlear gain at the signal place in a manner that is similar to an of adaptation of suppression. Thus, neural response properties at CFs near a persistent spectral peak become adapted and their suppressive effect on neighboring spectral components is decreased. The implication is that when a spectral peak (or a broad dominance of low- or high-frequency energy as with sounds with steeply sloping spectral tilts) of a preceding sound is near the same frequency as the sound that immediately follows, cochlear gain is decreased at that frequency region. The result is perceptual calibration to the non-informative (unchanging) parts of the incoming spectrum. However, when a spectral peak (or a low∕high-frequency energy dominance) is in a region away from the following sound, cochlear gain in the suppressive region of the following sound is increased. The result is perceptual contrast to the informative changes in the incoming spectrum. In this way, perceptual calibration (a de-emphasis of spectral similarities) and perceptual contrast (an emphasis of spectral differences) are viewed as two features of the same physiologic mechanism that operates to maximize the transfer of information, that is, to optimize the perceptual response to changes in the environment.
ACKNOWLEDGMENTS
The authors would especially like to thank Danielle L. Jirovec for her invaluable service during the data collection process. This research was supported by grants to the first and second authors from the National Institutes of Health, NIDCD (Grant Nos. T32DC000013 and R01DC04072, respectively).
APPENDIX: SYNTHESIS OF SINUSOIDAL POLE PRECURSORS
The first step in synthesizing sinusoidal pole precursors is to generate a voicing source. A sawtooth waveform with 100-Hz fundamental frequency was used for the source. The source waveform was equal to the duration of one modulation cycle with a 48828 Hz sampling rate. For each pole, instantaneous frequency was determined every 5-ms sample using the update rate
| (A1) |
where Fi is instantaneous frequency, Fc is center frequency of the pole (600, 1600, 2600, or 3600 Hz), Ac is the frequency excursion of each pole (430 Hz), ti is the time point corresponding to the beginning of the update sample, and θ is the starting phase (π∕2, π, 3∕2π, or 2π). For each update period, the source waveform was passed through a digital resonator for formant synthesis [cf. Eq. A2 in Klatt, 1980]
| (A2) |
where BW is the bandwidth of the formant or pole and T is the inverse of the sampling rate. The numerator of the filter is given by A and the denominator is given by the three-element vector: [1, −B, −C]. For each pole, filtered source waveforms for each update period were concatenated in time. As a practical matter, considering the intensive computational processing involved, poles were generated independently and stored as vector for each of the four starting phases. Precursors were then generated for each cycle by adding the waveforms of each of the four selected poles together.
Footnotes
Facts of auditory physiology and of the statistics of natural sound sources support this hypothesis. For example, it is well documented that low levels of processing in auditory nerve and ventral cochlear nucleus have relatively narrow frequency tuning and integrate energy over relatively short periods (e.g., Romand, 1983; Brugge et al., 1981). However, the frequency and time base of integration increases at higher levels in the auditory system as information about initial narrowly tuned properties is encoded in parallel with information about spectrally broader aspects of the signal (e.g., Abeles and Goldstein, 1972; Schreiner and Langer, 1984; Creutzfeldt et al., 1980). For example, Barbour and Wang (2003) identify nerve fibers in primary auditory cortex that are responsive to both spectrally narrow and broad properties when decoding spectral shape. This neural organization complements the acoustics of natural everyday sounds. For example, detailed spectral changes (e.g., formant onsets and offsets) tend to have a relatively short time base compared to broader spectral properties (e.g., spectral tilt) that are best defined over a longer time base. That is, as a complex signal like speech is sampled for a longer period, the average spectrum becomes smoother and its defining properties become more global.
Lowpass filters were created using the Filter Design and Analysis Tool in matlab. Bandpass filters and filters used to manipulate spectral tilt were created using the FIR2 function in matlab.
Software version 2.5.41. See http://bootstrap-software.org/psignifit.
References
- Abeles, M., and Goldstein, M. H. (1972). “Responses of single units in the primary auditory cortex of the cat to tones and to tone pairs,” Brain Res. 42, 337–352. 10.1016/0006-8993(72)90535-5 [DOI] [PubMed] [Google Scholar]
- Alexander, J. M., and Kluender, K. R. (2008). “Relativity of spectral tilt change in stop consonant perception,” J. Acoust. Soc. Am. 123, 386–396. 10.1121/1.2817617 [DOI] [PubMed] [Google Scholar]
- Alexander, J. M., and Kluender, K. R. (2009). “Relativity of spectral tilt change in stop consonant perception by hearing-impaired listeners,” J. Speech. Lang. Hear. Res. 52, 653–670. 10.1044/1092-4388(2008/08-0038) [DOI] [PMC free article] [PubMed] [Google Scholar]
- Backus, B. C., and Guinan, J. J., Jr. (2006). “Time-course of the human medial olivocochlear reflex,” J. Acoust. Soc. Am. 119, 2889–2904. 10.1121/1.2169918 [DOI] [PubMed] [Google Scholar]
- Barbour, D. L., and Wang, X. (2003). “Contrast tuning in auditory cortex,” Science 299, 1073–1075. 10.1126/science.1080425 [DOI] [PMC free article] [PubMed] [Google Scholar]
- Bladon, R. A. W., and Lindblom, B. (1981). “Modeling the judgment of vowel quality differences,” J. Acoust. Soc. Am. 69, 1414–1422. 10.1121/1.385824 [DOI] [PubMed] [Google Scholar]
- Boynton, R. M. (1988). “Color vision,” Annu. Rev. Psychol. 39, 69–100. 10.1146/annurev.ps.39.020188.000441 [DOI] [PubMed] [Google Scholar]
- Bregman, A. S. (1990). Auditory Scene Analysis: The Perceptual Organization of Sound (MIT Press, Cambridge, MA: ), pp. 1–773. [Google Scholar]
- Brugge, J. F., Kitzes, L. M., and Javel, E. (1981). “Postnatal development of frequency and intensity sensitivity of neurons in the anteroventral cochlear nucleus of kittens,” Hear. Res. 5, 217–229. 10.1016/0378-5955(81)90047-2 [DOI] [PubMed] [Google Scholar]
- Churchland, P. S., and Sejnowski, T. J. (1988). “Perspectives on cognitive science,” Science 242, 741–745. 10.1126/science.3055294 [DOI] [PubMed] [Google Scholar]
- Coady, J. A., Kluender, K. R., and Rhode, W. S. (2003). “Effects of contrast onsets of speech and other complex spectra,” J. Acoust. Soc. Am. 114, 2225–2235. 10.1121/1.1608955 [DOI] [PMC free article] [PubMed] [Google Scholar]
- Creutzfeldt, O., Hellweg, F. -C., and Schreiner, C. (1980). “Thalamocortical transformation of responses to complex auditory stimuli,” Exp. Brain Res. 39, 87–104. 10.1007/BF00237072 [DOI] [PubMed] [Google Scholar]
- Darwin, C. J., McKeown, J. D., and Kirby, D. (1989). “Perceptual compensation for transmission channel and speaker effects on vowel quality,” Speech Commun. 8, 221–234. [Google Scholar]
- Dean, I., Robinson, B. L., Harper, N. S., and McAlpine, D. (2008). “Rapid neural adaptation to sound level statistics,” J. Neurosci. 28, 6430–6438. 10.1523/JNEUROSCI.0470-08.2008 [DOI] [PMC free article] [PubMed] [Google Scholar]
- Delgutte, B. (1980). “Representation of speech-like sounds in the discharge patterns of auditory nerve fibers,” J. Acoust. Soc. Am. 68, 843–857. 10.1121/1.384824 [DOI] [PubMed] [Google Scholar]
- Delgutte, B. (1986). “Analysis of French stop consonants with a model of the peripheral auditory system,” in Invariance and Variability of Speech Processes, edited by Perkell J. S. and Klatt D. H. (Lawrence Erlbaum, Mahwah, NJ: ), pp. 131–177. [Google Scholar]
- Delgutte, B. (1996). “Auditory neural processing of speech,” in The Handbook of Phonetic Sciences, edited by Hardcastle W. J. and Laver J. (Blackwell, London, Oxford: ), pp. 507–538. [Google Scholar]
- Delgutte, B., Hammond, B. M., and Cariani, P. A. (1998). “Neural coding of the temporal envelope of speech: Relation to modulation transfer functions,” in Psychophysical and Physiological Advances in Hearing, edited by Palmer A. R., Rees A., Summerfield A. Q., and Meddis R. (Whurr, London: ), pp. 595–603. [Google Scholar]
- Delgutte, B., Hammond, B. M., Kalluri, S., Litvak, L. M., and Cariani, P. A. (1996). “Neural encoding of temporal envelope and temporal interactions in speech,” in Auditory Basis of Speech Perception, edited by Ainsworth W. and Greenberg S. (Eur. Sp. Comm. Assoc., London), pp. 1–9. [Google Scholar]
- Delgutte, B., and Kiang, N. Y. S. (1984). “Speech coding in the auditory nerve IV: Sounds with consonant-like dynamic characteristics,” J. Acoust. Soc. Am. 75, 897–907. 10.1121/1.390599 [DOI] [PubMed] [Google Scholar]
- Foster, D. H., Nascimento, S. M. C., Craven, R. J., Linnell, K. J., Cornelissen, F. W., and Brenner, E. (1997). “Four issues concerning colour constancy and relational colour constancy,” Vision Res. 37, 1341–1345. 10.1016/S0042-6989(96)00285-4 [DOI] [PubMed] [Google Scholar]
- Green, D. M., and Swets, J. A. (1966). Signal Detection Theory (Kreiser, New York: ), pp. 1–455. [Google Scholar]
- Hafter, E. R., Buell, T. N., and Richards, V. M. (1988). “Onset-coding in lateralization: Its form, site, and function,” in Neurological Bases of Hearing, edited by Edelman G. M., Gall W. E., and Cowan W. M. (Wiley, New York: ), pp. 647–676. [Google Scholar]
- Haggard, M. P., Trinder, J. R., Foster, J. R., and Lindblad, A. -C. (1987). “Two-state compression of spectral tilt: Individual differences and psychoacoustical limitations to the benefit from compression,” J. Rehabil. Res. Dev. 24, 193–206. [PubMed] [Google Scholar]
- Heil, P. (1997a). “Auditory cortical onset responses revisited. I. First-spike timing,” J. Neurophysiol. 77, 2616–2641. [DOI] [PubMed] [Google Scholar]
- Heil, P. (1997b). “Auditory cortical onset responses revisited. II. Response strength,” J. Neurophysiol. 77, 2642–2660. [DOI] [PubMed] [Google Scholar]
- Hillenbrand, J., Getty, L. J., Clark, M. J., and Weeler, K. (1995). “Acoustic characteristics of American English vowels,” J. Acoust. Soc. Am. 97, 3099–3111. 10.1121/1.411872 [DOI] [PubMed] [Google Scholar]
- Holt, L. L. (2005). “Temporally non-adjacent non-linguistic sounds affect speech categorization,” Psychol. Sci. 16, 305–312. 10.1111/j.0956-7976.2005.01532.x [DOI] [PubMed] [Google Scholar]
- Holt, L. L. (2006). “The mean matters: Effects of statistically-defined non-speech spectral distributions on speech categorization,” J. Acoust. Soc. Am. 120, 2801–2817. 10.1121/1.2354071 [DOI] [PMC free article] [PubMed] [Google Scholar]
- Holt, L. L., and Lotto, A. J. (2002). “Behavioral examinations of the level of auditory processing of speech context effects,” Hear. Res. 167, 156–169. 10.1016/S0378-5955(02)00383-0 [DOI] [PubMed] [Google Scholar]
- Houtgast, T. (1974). “Auditory analysis of vowel-like sounds,” Acoustica 31, 320–324. [Google Scholar]
- Ito, M., Tsuchida, J., and Yano, M. (2001). “On the effectiveness of whole spectral shape for vowel identification,” J. Acoust. Soc. Am. 110, 1141–1149. 10.1121/1.1384908 [DOI] [PubMed] [Google Scholar]
- Kawase, T., Delgutte, B., and Liberman, M. C. (1993). “Antimasking effects of olivocochlear reflex II. Enhancement of auditory nerve response to masked tones,” J. Neurophysiol. 70, 2533–2549. [DOI] [PubMed] [Google Scholar]
- Kawase, T., and Liberman, M. C. (1993). “Anti-masking effects of olivocochlear reflex I. Enhancement of compound action potentials to masked tones,” J. Neurophysiol. 70, 2519–2532. [DOI] [PubMed] [Google Scholar]
- Kiefte, M. J., and Kluender, K. R. (2005). “The relative importance of spectral tilt in monophthongs and diphthongs,” J. Acoust. Soc. Am. 117, 1395–1404. 10.1121/1.1861158 [DOI] [PubMed] [Google Scholar]
- Kiefte, M. J., and Kluender, K. R. (2008). “Absorption of reliable spectral characteristics in auditory perception,” J. Acoust. Soc. Am. 123, 366–376. 10.1121/1.2804951 [DOI] [PubMed] [Google Scholar]
- Kirk, E. C., and Smith, D. W. (2003). “Protection from acoustic trauma is not a primary function of the medial olivocochlear efferent system,” J. Assoc. Res. Otolaryngol. 4, 445–465. [DOI] [PMC free article] [PubMed] [Google Scholar]
- Klatt, D. H. (1980). “Software for a cascade∕parallel formant synthesizer,” J. Acoust. Soc. Am. 67, 971–995. 10.1121/1.383940 [DOI] [Google Scholar]
- Klatt, D. H., and Klatt, L. C. (1990). “Analysis, synthesis, and perception of voice quality variations among female and male talkers,” J. Acoust. Soc. Am., 87, 820–857. 10.1121/1.398894 [DOI] [PubMed] [Google Scholar]
- Kluender, K. R., and Alexander, J. M. (2007). “Perception of speech sounds,” in Handbook of the Senses: Audition, edited by Dallos P. and Oertel D. (Elsevier, London: ), pp. 829–860. [Google Scholar]
- Kluender, K. R., and Kiefte, M. (2006). “Speech perception within a biologically-realistic information-theoretic framework,” in Handbook of Psycholinguistics, edited by Gernsbacher M. A. and Traxler M. (Elsevier, London: ), pp. 153–199. [Google Scholar]
- Ladefoged, P., and Broadbent, D. E. (1957). “Information conveyed by vowels,” J. Acoust. Soc. Am. 29, 98–104. 10.1121/1.1908694 [DOI] [PubMed] [Google Scholar]
- Lehiste, I., and Peterson, G. E. (1961). “Transitions, glides, and diphthongs,” J. Acoust. Soc. Am. 33, 268–277. 10.1121/1.1908638 [DOI] [Google Scholar]
- Liberman, M. C., and Brown, M. C. (1986). “Physiology and anatomy of single olivocochlear neurons in the cat,” Hear. Res. 24, 17–36. 10.1016/0378-5955(86)90003-1 [DOI] [PubMed] [Google Scholar]
- Liberman, A. M., Isenberg, D., and Rakerd, B. (1981). “Duplex perception of cues for stop consonants: Evidence for a phonetic mode,” Percept. Psychophys. 30, 133–143. [DOI] [PubMed] [Google Scholar]
- May, B. J., and Mequone, S. J. (1995). “Effects of bilateral olivocochlear lesions on pure-tone intensity discrimination in noise,” Aud. Neurosci. 1, 385–400. [PMC free article] [PubMed] [Google Scholar]
- Moore, B. C. J., Glasberg, B. R., and Peters, R. W. (1986). “Thresholds for hearing mistuned partials as separate tones in harmonic complexes,” J. Acoust. Soc. Am. 80, 479–483. 10.1121/1.394043 [DOI] [PubMed] [Google Scholar]
- Nassau, K. (1983). The Physics and Chemistry of Color: The Fifteen Causes of Color (Wiley, New York: ), pp. 1–454. [Google Scholar]
- Ota, Y., Oliver, D. L., and Dolan, D. F. (2004). “Frequency-specific effects on cochlear responses during activation of the inferior colliculus in the guinea pig,” J. Neurophysiol. 91, 2185–2193. 10.1152/jn.01155.2003 [DOI] [PubMed] [Google Scholar]
- Pérez-González, D., Malmierca, M. S., and Covey, E. (2005). “Novelty detector neurons in the mammalian auditory midbrain,” Eur. J. Neurosci. 22, 2879–2885. [DOI] [PubMed] [Google Scholar]
- Phillips, D. P., and Hall, S. E. (1990). “Response timing constraints on the cortical representation of sound time structure,” J. Acoust. Soc. Am. 88, 1403–1411. 10.1121/1.399718 [DOI] [PubMed] [Google Scholar]
- Rhode, W. S. (1991). “Physiological-morphological properties of the cochlear nucleus,” in Neurobiology of Hearing: The Central Auditory System, edited by Altschuler R. A.et al. (Raven Press, New York: ), pp. 47–78. [Google Scholar]
- Romand, R. (1983). “Development in the frequency selectivity of auditory nerve fibers in the kitten,” Neurosci. Lett. 35, 271–276. 10.1016/0304-3940(83)90329-4 [DOI] [PubMed] [Google Scholar]
- Schreiner, C. E., and Langer, G. (1984). “Coding of temporal patterns in the central auditory system,” in Auditory Function: Neurobiological Bases of Hearing, edited by Edelman G. M., Gall W. E., and Cowan W. M. (Wiley, New York: ), pp. 337–361. [Google Scholar]
- Shinn-Cunningham, B. G., Lee, A. K. C., and Oxenham, A. J. (2007). “A sound element gets lost in perceptual competition,” Proc. Natl. Acad. Sci. U.S.A. 104, 12223–12227. 10.1073/pnas.0704641104 [DOI] [PMC free article] [PubMed] [Google Scholar]
- Smith, R. L. (1977). “Short-term adaptation in single auditory nerve fibers: Some poststimulatory effects,” J. Neurophysiol. 40, 1098–1112. [DOI] [PubMed] [Google Scholar]
- Smith, R. L. (1979). “Adaptation, saturation and physiological masking in single auditory-nerve fibers,” J. Acoust. Soc. Am. 65, 166–178. 10.1121/1.382260 [DOI] [PubMed] [Google Scholar]
- Stilp, C. E., Alexander, J. A., Kiefte, M., and Kluender, K. R. (2010). “Auditory color constancy: Calibration to reliable spectral properties across speech and nonspeech contexts and targets,” Atten. Percept. Psychophys. 72, 470–480. [DOI] [PMC free article] [PubMed] [Google Scholar]
- Strickland, E. A. (2008). “The relationship between precursor level and the temporal effect,” J. Acoust. Soc. Am. 123, 946–954. 10.1121/1.2821977 [DOI] [PMC free article] [PubMed] [Google Scholar]
- Ulanovsky, N., Las, L., and Nelken, I. (2003). “Processing of low-probability sounds by cortical neurons,” Nat. Neurosci. 6, 330–332. 10.1038/nn1032 [DOI] [PubMed] [Google Scholar]
- Van Dijkhuizen, J. N., Anema, P. C., and Plomp, R. (1987). “The effect of varying the slope of the amplitude-frequency response on the masked speech-reception threshold of sentences,” J. Acoust. Soc. Am. 81, 465–469 . 10.1121/1.394912 [DOI] [PubMed] [Google Scholar]
- Van Dijkhuizen, J. N., Festen, J. M., and Plomp, R. (1989). “The effect of varying the amplitude-frequency response on the masked speech-reception threshold of sentences for hearing-impaired listeners,” J. Acoust. Soc. Am. 86, 621–628. 10.1121/1.2027683 [DOI] [PubMed] [Google Scholar]
- Watkins, A. J. (1991). “Central, auditory mechanisms of perceptual compensation for spectral-envelope distortion,” J. Acoust. Soc. Am. 90, 2942–2955. 10.1121/1.401769 [DOI] [PubMed] [Google Scholar]
- Watkins, A. J., and Makin, S. J. (1994). “Perceptual compensation for speaker differences and for spectral-envelope distortion,” J. Acoust. Soc. Am. 96, 1263–1284. 10.1121/1.410275 [DOI] [PubMed] [Google Scholar]
- Wichmann, F. A., and Hill, N. J. (2001). “The psychometric function: I. Fitting, sampling, and goodness of fit,” Percept. Psychophys. 63, 1293–1313. [DOI] [PubMed] [Google Scholar]
- Wilcox, R. R. (2005). Introduction to Robust Estimation and Hypothesis Testing, 2nd ed. (Elsevier Academic Press, London: ), pp. 228–231. [Google Scholar]
- Winslow, R. L., and Sachs, M. B. (1988). “Single tone intensity discrimination based on auditory nerve rate responses in backgrounds of quiet, noise and with stimulation of the crossed olivocochlear bundle,” Hear. Res. 35, 165–190. 10.1016/0378-5955(88)90116-5 [DOI] [PubMed] [Google Scholar]
- Winter, I. M., and Palmer, A. R. (1995). “Level dependence of cochlear nucleus onset unit responses and facilitation by second tones or broadband noise,” J. Neurophysiol. 73, 141–159. [DOI] [PubMed] [Google Scholar]
- Zahorian, S., and Jagharghi, A. (1993). “Spectral-shape feature versus formant as acoustic correlates for vowels,” J. Acoust. Soc. Am. 94, 1966–1982. 10.1121/1.407520 [DOI] [PubMed] [Google Scholar]


