

Abstract
Methods used to determine collagen crosslinks in different connective tissues require a relatively large amount of material and include a number of experimental steps. We addressed these issues by developing the first ultrahigh-pressure liquid chromatography (UPLC) methodology for detection and quantification of naturally fluorescent enzymatic (pyridinoline, deoxypyridinoline) and senescent (pentosidine) crosslinks using nanogram amounts of acid-hydrolyzed bone and purified bone collagen. Not only the developed set of UPLC methods relies on a single column analysis of all three fluorescent crosslinks in one separation step, but under different separation conditions, the same column is also used to determine hydroxyproline concentration necessary to calculate collagen contents in the samples making this a unique feature of our methodology. The determined detection limit was 10 fmol for the pyridinum crosslinks and 1.5 fmol for pentosidine. The smallest pieces of human cortical bones were 224 – 240 ng in weight and this is approx. 106-fold less as compared to some high-pressure LC (HPLC) methods that need a minimum of approx. 0.50 – 1 mg of a bone sample. In general, our UPLC methodology can be applied to analysis of similar crosslinks in various collagenous tissues as well as purified/recombinant proteins of different origin. Thus, in addition to biomedical and bone research, this work is of general importance to other fields including biology, forensic, anthropology and archaeology, where samples could truly be rare, minute and precious.
Keywords: Collagen, Proteins, Fluorescent Crosslinks, Ultrahigh Pressure Liquid Chromatography
1. Introduction
An important part of osteoporosis research is the identification of the parameters that contribute to the variations in the strength of bone and alter the risk of fragility fractures. As low bone mass alone is insufficient to cause such fractures [1], factors other than the loss of bone, in particular changes in the quality of its organic components, are of crucial importance to the understanding of fragility fractures [2]. The evidence supporting the need for a broad scale investigation of bone-matrix proteins and their modifications, and the use of these measures to predict fragility fractures continues to grow [3–6]. To address some of these needs, we focused on the development of chromatographic methods that allow analysis and quantification of several naturally fluorescent crosslinks in bone matrix proteins.
Glucose and other reducing sugars react with proteins by non-enzymatic, post-translational modification process termed either non-enzymatic glycosylation or glycation. In this process, the sugar-derived carbonyl group interacts with free amine of an amino acid forming a reversible adduct. Over time these adducts rearrange into a class of products called advanced-glycation end-products (AGEs). Some of AGEs are non-fluorescent while the other ones fluoresce naturally [7–9]. The formation of AGEs in long-lived tissues accounts largely for the increase in collagen crosslinking that accompanies normal aging, but accelerates significantly in diabetes. Age-related changes in abnormal bone remodeling are primarily associated with diminishing quality of collagen due to undesired glycation [7–9]. Pentosidine (PEN) represents senescent non-enzymatic, pentose-derived crosslink formed between lysine and arginine residues of collagen. As opposed to non-enzymatic glycation, enzymatic crosslinking of collagen fibers is a desired process. It plays an important role in controlling mechanical stability of collagen networks in vivo, and thus, influences bone strength. Pyridinoline (PYD) and deoxypyridinoline (DPD) are the examples of such enzymatic, mature trivalent crosslinks. Due to their clinical importance, we selected PEN as the primary representative of AGEs and PYD and DPD as two enzymatic representatives of post-translational modifications of collagen as the model crosslinks for our current studies. It is noteworthy that all three compounds are naturally fluorescent and difficult to assess due to their very low concentrations in bone and other types of collagen-rich connective tissues. Several high-pressure liquid chromatography (HPLC) methods were developed in the past to determine PYD, DPD or/and PEN in biological samples. Historically, reverse phase HPLC was one of the first chromatographic methods used to determine concentrations of PYD and DPD but not PEN in urine [10]. In this method, the acidic hydrolysates were pre-fractionated on a CF-1 cellulose column before HPLC. Unfortunately, this process led to the removal of PEN from the samples as it was not retained on the CF-1 cellulose column. Another disadvantage of this method [10] referred to the reproducibility of the complete procedure that was only between 12 and 16%. Although later improved, other methods still involved HPLC pre-fractionation on various columns (e.g., SP-Sephadex C-25 instead of CF-1 cellulose) [11] or bone demineralization [12]. The next advancement in the development of the HPLC methods was the accuracy improvement due to the introduction of an internal standard [13] and a solid-phase extraction (SPE) procedure [4, 14, 15]. However, these HPLC methods require much larger amount of material than nanogram amount of bone tissue used here (i.e., bone pieces microdissected under a microscope using laser). We selected ultrahigh-performance liquid chromatography (UPLC) over HPLC, because UPLC has much higher sensitivity and permits fast analysis of picoscale amount of a given sample due to a new technology that allowed to move the particle size of a column below 2 μm where not only higher efficiencies are gained, but also these efficiencies no longer diminish with flow rate [16]. The high peak capacity separations rely on high pressure and require a greater pressure range as compared to current HPLC instrumentation. For example, the calculated pressure drop at the optimum flow rate for maximum efficiency across a 10 cm long column packed with 1.7 μm particles is ~15,000 psi [17]. As the UPLC system was not used before for quantification of fluorescent crosslinks of collagen and other proteins, thus first, it was necessary to develop the relevant analytical methods.
Here, we describe the development and application of the first UPLC methodology for separation of selected enzymatic (PYD, DPD) and non-enzymatic (PEN) protein crosslinks using non-demineralized bone tissue and purified bone collagen. In our methodology, the three crosslinks are separated concomitantly on a single column. The method does not involve a prior solid-phase extraction procedure, specifically, for analysis of different connective tissues such as bone, cartilage, tendon, ligament and skin as these tissues have a very low level of other fluorescent compounds with emission spectra that potentially could overlap with those of PYD, DPD and PEN. Importantly, under different separation conditions, the same column is used to determine hydroxyproline concentration necessary to calculate collagen contents in the samples and this significantly simplifies the analyses as no additional columns are required. Two solvent sets differing by the concentration of heptafluorobutyric acid were shown to clearly separate PYD, DPD and PEN. The developed methodology permitted determination of femtomol amounts of PYD, DPD and PEN in as little as 224 – 240 ng of a human cortical bone piece dissected using laser capture microscopy. This is significant improvement when compared to the most recent HPLC procedures, which require larger amount of material (minimum approx. 500 –1000 μg of a bone) and allow determination of the aforementioned crosslinks at a picomol level [14, 15]. Although we used bone tissue and purified bone collagen as the model protein to develop the discussed UPLC methodology, our methods can be applied to analyze similar crosslinks in various collagenous tissues and purified/recombinant proteins of different origin, and thus, are of general importance.
2. Materials and methods
2.1. Chemicals and reagents
All reagents used for separations were the HPLC grade. The chemicals used for collagen isolation were molecular biology grade. Acetonitrile and acetic acid were purchased from Fisher Scientific (Morris Plains, NJ, USA). Heptafluorobutyric acid was purchased from Sigma (St. Louis, MO, USA). Hydroxyproline Reagent kits were purchased from Bio-Rad (München, Germany). Solid-phase extraction Chromabond® Crosslinks columns were from Macherey-Nagel (Bethlehem, PA, USA). The PYD, DPD and INT-PYD (i.e., acetylated pyridinoline) standards were purchased from Quidel Corp. (San Diego, CA, USA). The PEN standard was obtained from Dr. Vincent Monnier (CWRU, Cleveland, Ohio, USA). The Halt Protease Inhibitor was purchased from Pierce/Thermo Scientific, Rockford, IL, USA.
2.2. Samples
2.2.1 Bone sample preparation
Cortical bone samples were obtained from the human posterior tibial cortex of cadaveric donors of age from 19 to 97 years old who were free of bone and joint disease at the time of death. The bone pieces were repeatedly washed in cold distilled water until the washings were free of blood and defatted using isopropyl ether. After freeze-drying, the specimens were stored at −80°C until the use. Laser microdissected bone pieces originated from human cortical bone beams (posterior quadrant) that first were embedded in poly-(methyl methacrylate) (PMMA) and then sectioned transversely (i.e., perpendicular to its long axis) into 5 μm thick sections. These sections were bonded onto a membrane slide (Molecular Machines and Industries (MMI), Florida, USA) using 70% ethanol and dried overnight. The areas of randomly selected bone regions were laser microdissected using the Olympus IX71 Inverted Microscope (Olympus America Inc., Pennsylvania, USA) equipped with Molecular Machines and Industries (MMI) CellTools (Version 3.48, MMI, Eching, Germany). The laser (355nm) speed, focus and power setting to obtain the most precise cut were 15%, 30%, and 90%, respectively. The number of cuts was selected according to the thickness of the sections.
2.3.2. Collagen isolation
Bone pieces (0.055 – 0.075 g in size) were washed in cold distilled water, defated using isopropyl ether, immersed in liquid nitrogen and grounded into smaller particles (40–60 μm). A small portion of each powder was taken out to determine DNA concentration as lack of DNA detection (i.e., less than 25 ng/0.010 g of bone powder) is treated as no contamination from cellular and blood components in the bone powder. Another portion of each powder was taken for direct hydrolysis in 6 N HCl. The remaining bone powders were transferred to eppendorf tubes that had a hole melted in the lid and then extraction buffer (0.05 M EDTA, 4M guanidine chloride, 30 mM Tris-HCl, 1 mg/ml BSA, 10 ul/ml Halt Protease Inhibitor, pH 7.4) was added. The tube was covered with a dialysis membrane (Spectra Por® 3 Dialysis Membrane; Spectrum Laboratories, Inc., CA, USA) and closed allowing the membrane to line the hole. The micro-dialysis was conducted at 4°C against several changes of the PBS buffer pH 7.4. After dialysis, the samples were centrifuged. Collagen pellets corresponding to approx. 2.5 mg of a bone were used for the determination of the three selected crosslinks. Notably, the collagen purity and quality was confirmed using sodium dodecyl sulfate-polyacrylamide gel electrophoresis (SDS-PAGE) and bovine type I and rat tail type I collagens (BD Biosciences, Bedford, MA, USA) as standards.
The tubes containing bone pieces microdissected under a microscope using a laser (224 – 240 ng of a bone) were incubated overnight at 4°C in inverted orientation to facilitate detachment of a given bone piece from the adhesive cap (MMI IsolationCap®, Florida, USA). In the next step, the solution containing a bone piece was transferred into an eppendorf tube that had a hole melted in the lid and processed as described above.
2.4. UPLC methods
2.4.1. UPLC analysis of PYD, DPD and PEN
Direct acid hydrolysis of bone pieces/powders (5 to 10 mg of a bone) as well as the hydrolysis of collagen samples was performed in 6N HCl (100 μl/mg bone) at 110°C for 20 hrs. Hydrolysis of the microdissected bone tissue (pieces of 224 – 240 ng) was performed in 20 to 50 μl of 6N HCl at 110°C for 20 hrs. After cooling, the hydrolysates were centrifuged, the respective supernatants were divided into portions, transferred to clean tubes, concentrated/dried and stored at −80°C until use.
Before the UPLC analysis, each hydrolysate was dissolved in 1% n-heptafluorobutyric acid (HFBA). PYD, DPD, acetylated pyridinoline (INT-PYD, internal standard) and PEN were separated using an Acquity UPLC machine (Waters Corp., Milford, MA, USA) equipped with the reverse-phase Acquity UPLC HSS T3 column (1.8 μm; 2.1 × 100 mm). The column flow rate and temperature were 0.667 ml/min and 40°C, respectively. One set of the developed solvents that led to the efficient UPLC separation of PYD, DPD and PEN comprised solvent A containing 0.12% HBFA in 18 ohms pure water, and solvent B composed of 50 : 50 (v : v) mixture of solvent A : acetonitrile. The second set of the solvents comprised solvent A containing 0.06% HBFA in 18 ohms pure water, and solvent B composed of 50 : 50 (v : v) mixture of solvent A : acetonitrile. Prior the use, the column was equilibrated using 10% solvent B. Gradient of 10 to 31% of solvent B was used for the separation of the collagen crosslinks. The elution of PYD, DPD and INT-PYD was monitored for fluorescence emission at 395 nm after excitation at 297 nm. PEN was monitored for fluorescence emission at 385 nm after excitation at 335 nm. Pyridinum crosslinks and PEN were quantified using the calibrators as references. Standard curves were used to determine linearity range of the assays and the detection limits. After each analysis, the column was washed using 95% acetonitrile for 1 min and equilibrated with solvent A.
2.4.2. UPLC analysis of hydroxyproline
Hydroxyproline contents was determined using reagents from the HPLC assay kit (Bio-Rad Labratories GmbH, Müchen, Germany), but the mobile phase solvents and conditions were developed specifically for the UPLC separation. The column flow rate and temperature were 0.500 ml/min and 60°C, respectively. The 0 to 50% gradient of acetonitrile was achieved by mixing 100% acetonitrile (solvent B) with a buffer composed of 0.3% acetic acid and 0.6% triethylamine, pH 4.50 (solvent A). The elution of the derivatized hydroxyproline was minitored at 471 nm. The amount of collagen was calculated assuming 300 nmol of hydroxyproline in 1 mol of collagen.
Hydroxyproline standard curve was made using hydroxyproline (purity ≥ 99%, Sigma-Aldrich, St. Louis, MO, USA) at concentrations 0; 20.0; 100.00, 200.0 and 400.0 ng/μl. The hydroxyproline stock solution (1.0 ml, c = 2 mg/ml) was prepared directly before the use and the solution was kept at 0–2°C. The required dilutions were made out of the hydroxyproline stock solution to the final volume of 1.0 ml. This approach prevented potential errors, which could occur if very small amounts of a solid had been weighted. Collagen standard curve was prepared using 0; 50.0; 100.00; 200.0; 400.0 and 800.0 ng/μl of rat tail collagen type I (purity ≥ 99.9%, c = 4.46 mg/ml, BD Biosciences, Bedford, MA, USA) following the same precautions as those described above for making the hydroxyproline standard solutions.
2.5. Quantification of PYD, DPD, PEN and hydroxyproline
Each calibration curve was established by plotting the peak area ratio (crosslink area/standard area) as the function of the calibrator concentration for PYD, DPD and PEN while peak height ratio was used in the case of hydroxyproline. Concentration of the respective crosslink was quantified by interpolation of the peak area ratio onto the calibration curve drawn by linear regression. Concentration of hydroxyproline was calculated according to the method from the HPLC assay kit (Bio-Rad Labratories GmbH, Müchen, Germany) and using the appropriate standard curve. To calculate the levels of the crosslinks in mols per mol of collagen, the chemical masses of 428.44 Da, 412.44 Da, 378.43 Da and 131.06 Da were used for PYD, DPD, PEN and hydroxyproline, respectively.
2.6. Method validation
The methods were validated by performing the test of linearity, inter- and intra-run precision, recovery and limit of detection. The detection limit was determined by injection of 7.5 μl of calibration standards (concentrations in [ng/μl]: PEN: c = 0; 0.003784; 0.007569; 0.015137; 0.07569; 0.15137 and 0.22704; PYD: c = 0; 0.1162; 0.2324; 0.3486; 0.4648; 0.5810; DPD: c = 0; 0.0506; 0.1012; 0.1518; 0.2024 and 0.2530). Notably, the lowest PEN concentration used here (0.003784 ng PEN/μl that equals 0.01 pmol PEN/μl) resulted in the injection of 28.38 pg of PEN onto the column and produced a clear peak of ~2.5 EU that is approx. 10-fold above the detection limit of the Aquity UPLC machine. Accuracy was determined by the recovery of PEN standard solution at three different concentrations (low = 0.07569 ng/μl, medium = 0.7569 ng/μl and high = 7.569 ng/μl), while the accuracy of the PYD and DPD determination was evaluated by the recovery of the internal PYD standard (Quidel Corp., San Diego, CA) added into the acidic hydrolysates of bone and collagen samples. The recovery was calculated as the percent difference between the quantity of the aforementioned crosslinks recovered from the spiked and non-spiked samples divided by the quantity of the added PEN, PYD and DPD, respectively. Intra-run precision (repeatability) was determined by a percent change in the coefficient of variation of 10 determinations of two control pools maintained at two different concentrations (c1 at 5.81 μg PYD/ml plus 2.53 μg DPD/ml, and c2 at 0.22704 ng PEN/μl). Inter-run precision (reproducibility) was determined by assaying c1 and c2 two times per week over a period of 3 months. The coefficient of variation was used as a measure for intra- and inter-assay precisions.
3. Results and discussion
This is the first report on the development of the UPLC methodology for detection and determination of the contents of fluorescent enzymatic mature (PYD, DPD) and non-enzymatic senescent (PEN) crosslinks using bone tissue and purified bone collagen as research materials.
3.1. Samples preparation
The first difference between our UPLC methodology and the existing HPLC methods refers to bone sample pre-treatment before the separation. Recently developed HPLC methods employ the pre-packed SPE Chromabond® Crosslinks columns [4, 14, 15] to clean acid hydrolysates of bone samples before separation. We established that omission of the pre-treatment of nearly nanoscale-size bone samples using SPE columns did not influence the quality of the UPLC separation. We observed that the chromatograms were similar for the samples that were prepared by acid hydrolysis of either bone samples or collagen extracted from bone pieces using 6N HCl. Moreover, the smallest commercially available pre-packed SPE columns (3 ml/300 mg cellulose, average particle size d50 = 33.3 μm) were too large for our intentionally selected nanoscale-size samples, and thus, could not be used for the sample pre-treatment as all fluorescent compounds were diluted to the level below the detection limit of the Aquity UPLC machine (10 fmol for the pyridinum crosslinks and 1.5 fmol for PEN), in addition to the fact that healthy bones naturally contain a very low level of PEN, especially from young donors 19 – 23 years old. The smallest samples of the tested bone hydrolysates were 10 – 25 μl, which corresponded to ~112 – 120 ng when the laser microdissected bone pieces were divided and used for determination of the fluorescent crosslinks or the measurement of hydroxyproline. However, direct acid hydrolysis of large bone pieces (e.g., 50 – 60 mg) will require the SPE-column pretreatment for the reasons discussed by Viguet-Carrin at al., 2009 [14]. Notably, we did not experience any issues with the quality of UPLC separations after over two years of analyzing samples that are not pretreated on the SPE Chromabond® Crosslinks columns and this corresponds to approx. 800 injections performed on our reverse-phase Acquity UPLC HSS T3 column (1.8 μm; 2.1 × 100 mm). To compare, the reverse-phase analytical column (150 × 4 mm ID, BioRad, München, Germany) is sufficient for approx. 500 injections. One of the reasons for these observations may be the use of a minute amount of a sample material that leads to the efficient removal of potentially interfering fluorescent compounds during the column washing. Also, to prolong the lifetime of the main column, we use a guard column (VanGuard UPLC HSS Pre-Column, 2.1 mm ID × 5 mm, Waters Corp., Milford, MA, USA). Alternatively, pre-treatment using the SPE Chromabond® Crosslinks columns might result in a loss of crosslinks from the samples, and such losses did not occur when using our method. Thus, we came to a conclusion that for the small-size samples of bones and other collagen-rich connective tissues such as cartilage, tendon, ligament and skin, column pre-treatment is not necessary.
3.2. Determination of mature (PYD, DPD) and senescent (PEN) crosslinks
While developing the discussed UPLC methods, we tested several concepts that are similar to standard HPLC methods used for separation of PYD, DPD and PEN, including the use of isocratic step (14%) to elute PYD and DPD, and the use of gradient (14% to 31%) step to elute PEN [14]. We determined that isocratic separation was unsuitable for separation and detection of PYD and DPD using UPLC as no peaks were detected in the designated time-frame. Although PEN was detected following the isocratic separation, its retention times were four- to five-fold shorter than expected. Introduction of a single, relatively broad (10 to 31%) separation gradient led to consistent separations of PYD, DPD, acetylated pyridinoline (internal standard) and PEN (Fig. 1).
Fig. 1.


Examples of chromatograms showing crosslinks detected by fluorescence. The volume of each injected sample was 7.5 μl. Panels A and C represent separations of the mixture of standards used as a reference. The solvent set I used for the separation shown in the panel A comprised solvent A containing 0.12% HBFA in 18 ohms pure water, and solvent B composed of 50 : 50 (v : v) mixture of solvent A : acetonitrile. The amounts of the standards injected to the column were 4.65 ng of PYD, 2.16 ng of DPD, 0.1× INT-Std (i.e., acetylated pyridinoline internal standard that is supplied by Quidel as 20× concentrated solution and does not specify its concentration in SI units) and 2.00 ng of PEN. The solvent set II used for the separation shown in the panel C comprised solvent A containing 0.06% HBFA in 18 ohms pure water, and solvent B composed of 50 : 50 (v : v) mixture of solvent A : acetonitrile. The amounts of the standards injected to the column were 46.5 ng of PYD, 21.6 ng of DPD, 1× INT-Std and 2.84 ng of PEN. In both cases (panel A and C) the solvent set I and II was used to form 10 to 31% gradient. Solvent set I (panel B) and set II (panels D – E) were used to separate bone hydrolysates. The use of the second set of solvents resulted in consistently sharper peaks. Chromatogram D shows separation of 100-fold higher amount of bone as compared to panel E. Two different amounts of the sample were used to demonstrate the resolution and detection power of the developed UPLC methodology. The enlarged panels represent details of the corresponding sections of the chromatograms relevant to the discussed work.
Out of several sets of solvents tested for the capability to form a gradient that clearly separated the crosslinks, two sets of solvents worked well (Fig. 1A – B and C – E, respectively). One set comprised 0.12% HFBA as solvent A and 0.06% HFBA in 50% acetonitrile as solvent B, and the second set consisted of 0.06% HFBA as solvent A and 0.03% HFBA in 50% acetonitrile as solvent B. The 10 to 31% gradient that was formed using either set of the solvents lead to distinct separation of PYD, DPD and PEN. First difference between the two cases was in the observed retention times, which were shorter for the second solvent set (Fig. 1C and E). Another difference was the presence of slightly broader peaks for PYD, DPD and INT-STD when using the first set of solvents. Therefore, routinely we use the second set of solvents to separate the crosslinks. The gradient formed using this set facilitates clear separation of PYD, DPD, INT-Std and PEN with retention times 3.1, 3.9, 4.4, 12.6 min, respectively.
3.3. Determination of hydroxyproline contents
Our UPLC method for the separation and determination of hydroxyproline in bone and collagen samples also has several unique features. First, we use the Acquity HSS T3 column instead of the Bio-Rad Analytical 195–9520 column used for the HPLC separations [4, 13, 14]. Thus, under different separation conditions, the detection and determination of hydroxyproline is achieved on the same type of column as the selected collagen crosslinks (Fig. 2). Ability to perform all the separations using one type of column is of fundamental importance for fast and simple quantification of collagen crosslinks. It is also less expensive as additional types of columns are not required. Second, to accomplish optimal separation of the derivatized hydroxyproline, we developed solvents that are composed of acetic acid and triethylamine (solvent A; pH 4.50), and acetonitrile (solvent B) and used 0 to 50 % gradient. We used acetic acid and triethylamine when separating derivatized hydroxyproline to improve the chromatographic peak shape and to provide a source of protons in reverse phase liquid chromatography. Triethylamine is a known ion-pairing agent that improves resolution of amino acids and amino acid amides by HPLC by suppressing tailing [18]. As compared to separation solvents for fluorescent crosslinks, we chose acetic acid over HFBA, because these two acids differ in their ionization constants (pKa) (i.e., at 25°C, the pKa of acetic acid and HFBA equals 1.8 × 10⁻⁵ (4.7) and 4.0 × 10⁻¹ (0.4), respectively). Based on the hydroxyproline derivatization procedure, we assumed that the weaker acetic acid will be better suited for the separation of derivatized hydroxyproline.
Fig. 2.
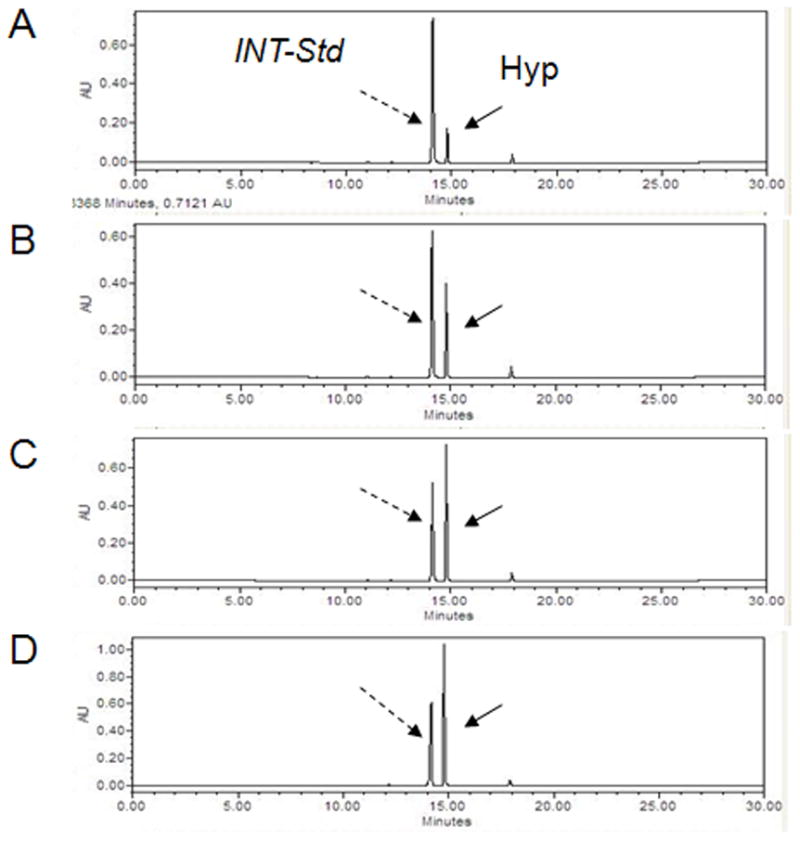

Examples of chromatograms obtained by separation of derivatized hydroxyproline (Hyp). The 0 to 50% gradient of acetonitrile was formed by mixing 100% acetonitrile (solvent B) with a buffer consisting of 0.3% acetic acid and 0.6% triethylamine, pH 4.50 (solvent A). The volume of each injected sample was 7.5μl. Panels A to D represent detection of different amounts of derivatized Hyp (concentration of Hyp in [ng/μl]: 20.0; 50.0 100.0 and 200.0) that was used to make a standard curve. Bio-Rad calibrator (panel E) and hydrolyzed collagen (c = 800 ng/μl, panel F) served as the references. Panels G and H show detection of the derivatized Hyp in bone hydrolysates obtained from the samples of 51 and 81 years old donors, respectively.
Detection and determination of hydroxyproline was conducted to calculate collagen concentration in the samples, because this amino acid almost exclusively occurs in collagen and serves as a characteristic biochemical marker of connective tissues from animals for over 50 years [19]. The calibration curve for hydroxyproline was defined by the equation y = 1795.9×. The assay was linear over the entire range of the validated amount of hydroxyproline with the correlation coefficient (R2) 0.9553. The calibration curve for collagen was defined by equation y = 69.58× and was linear over the entire range of the validated amount with R2 = 0.9833.
3.4. Recovery
Based on the difference between spiked and non-spiked portions of a given sample, the calculated recovery rates were 100 ± 2% for PYD, 100 ± 2% for DPD, 96 ± 4% for INT-PYD and 100 ± 2% for PEN. These recovery rates are better or similar to those reported for different HPLC methods [11, 12, 15].
3.5. Linearity, calibration curves and detection limits
The calibration curves for PYD, DPD and PEN were defined by the equations y = 2434× + 7637.9, y = 1977.7× = 2408.1 and y = 3e+08× + 139094, respectively. The assay was linear over the entire range of the validated amount of each crosslink. Correlation coefficients (R2) were 0.9985, 0.9983 and 0.9957 for PYD, DPD and PEN, respectively. The determined detection limit was 10 fmol for PYD and DPD, and 1.5 fmol for PEN. This demonstrates the excellent analytical power of the developed UPLC methodology.
3.6. Precision
The coefficient of variation for the intra-assay (repeatability) and inter-assay (reproducibility) for PYD, DPD and PEN were 2% or less. This level of variability demonstrates excellent reproducibility of the quantified collagen crosslinks as this coefficient should not exceed 15% for the determined repeatability and reproducibility precisions [15].
3.7. Application
Most often, analyses of bones are limited by the amount of the available material. In addition, depending on age, state of maturation and turnover, skeletal location, diet and health, the bioorganic component of a bone generally comprises 20 to 40%. About 90% of the total organic bone matrix represents collagen. The most abundant noncollagenous protein in bone, osteocalcin, constitutes 1 to 2% [20]. Thus, even when approx. milligram amount of bone is available for the assay, any type of AGEs analysis including PYD, DPD and PEN is a challenge due to their inherent low levels, especially in a healthy young bone. In our studies, the smallest bone pieces were 224 – 240 ng in size and the acid-hydrolysate from such piece was divided at least into two portions to determine the fluorescent crosslinks and the hydroxyproline contents. Small sample amount is a commonly faced problem, for example, in forensic, anthropology or biology, in particular, such samples as bones of Neanderthals [21] or tissues of endangered species that are often very rare and precious. Our UPLC methodology helps to overcome the aforementioned obstacles.
The developed UPLC methodology was applied to quantify collagen crosslinks in human cortical bone pieces of different age (19 to 97 years old donors). The determined values were ranging from 5 – 16 mol PYD/mol collagen, 14 – 526 mol DPD/mol collagen and 1.5 – 35 mol PEN/mol collagen and they agree with the previous studies. These results also show that the levels of all three crosslinks determined using our UPLC methodology are similar to the levels determined for human bones using HPLC [4, 12, 15].
4. Conclusions
We developed the first UPLC methodology for the determination of the contents of fluorescent enzymatic mature (PYD, DPD) and senescent (PEN) crosslinks using bone tissue and purified bone collagen as research materials. This methodology differs from the conventional HPLC methods [4, 10 – 13] by a number of factors. The first difference refers the lack of sample pre-treatment on the pre-packed SPE Chromabond® Crosslinks columns before separation. The use of minute amounts of materials (the smallest tested sample amount corresponded to ~112 –120 ng of a bone) in our methodology leads to a more efficient removal of potential contaminants during the column washing, and thus, does not reduce the lifetime of the column. The second key difference between the conventional HPLC and our UPLC methodology is the use of one-column-type for all the analyses and this includes both, the PYD, DPD and PEN as well as hydroxyproline determination. Introduction of a single, relatively broad (10 to 31%) separation gradient led to the consistent separation of PYD, DPD, acetylated pyridinoline (internal standard) and PEN. Detection and determination of hydroxyproline contents using the same type of column as for the three crosslinks, but different separation conditions, is another unique feature of the developed UPLC methodology. Ability to perform all the separations using one type of column is crucial for fast and simple quantification of protein crosslinks. It is also less expensive as additional types of columns are not required.
The immediate application for the UPLC methods developed through our studies can be, for example, a sub-proteome/proteome-scale analysis of glycation end-products in bone-matrix proteins. More broadly, applications of the discussed UPLC separation methods can go beyond medical sciences as they allow in-depth analysis of very limited amounts of various collagen-rich connective tissues and purified/recombinant proteins of different origin.
Acknowledgments
This research was supported by a grant from NIH AG20618. We thank Dr. Evelyne Ginets (University of Lyon, Lyon, France) for providing reagents for hydroxyproline determination by HPLC.
Footnotes
Publisher's Disclaimer: This is a PDF file of an unedited manuscript that has been accepted for publication. As a service to our customers we are providing this early version of the manuscript. The manuscript will undergo copyediting, typesetting, and review of the resulting proof before it is published in its final citable form. Please note that during the production process errors may be discovered which could affect the content, and all legal disclaimers that apply to the journal pertain.
References
- 1.Sornay-Rendu E, Boutroy S, Munoz F, Delmas PD. J Bone Miner Res. 2007;22:425. doi: 10.1359/jbmr.061206. [DOI] [PubMed] [Google Scholar]
- 2.Vashishth D. Crit Rev Eukaryot Gene Expr. 2005;15:343. doi: 10.1615/critreveukargeneexpr.v15.i4.40. [DOI] [PubMed] [Google Scholar]
- 3.Shiraki M, Kuroda T, Tanaka S, Saito M, Fukunaga M, Nakamura T. J Bone Miner Metab. 2008;26:93. doi: 10.1007/s00774-007-0784-6. [DOI] [PubMed] [Google Scholar]
- 4.Viguet-Carrin S, Roux JP, Arlot ME, Merabet Z, Leeming DJ, Byrjalsen I, Delmas PD, Bouxsein ML. Bone. 2006;39:1073. doi: 10.1016/j.bone.2006.05.013. [DOI] [PubMed] [Google Scholar]
- 5.Tang S, Unnisa Z, Vashishth D. Bone. 2007;40:1259. doi: 10.1016/j.bone.2006.10.031. [DOI] [PMC free article] [PubMed] [Google Scholar]
- 6.Tang SY, Allen MR, Phipps R, Burr DB, Vashishth D. Osteoporosis Int. 2009;20:887. doi: 10.1007/s00198-008-0754-4. [DOI] [PMC free article] [PubMed] [Google Scholar]
- 7.Vashishth D, Gibson GJ, Khoury JI, Schaffler MB, Kimura J, Fyhrie DP. Bone. 2001;28:195. doi: 10.1016/s8756-3282(00)00434-8. [DOI] [PubMed] [Google Scholar]
- 8.Viguet-Carrin S, Garnero P, Delmas PD. Osteoporosis Int. 2006;17:319. doi: 10.1007/s00198-005-2035-9. [DOI] [PubMed] [Google Scholar]
- 9.Saito M, Marumo K. Osteoporosis Int. 2010;21:195. doi: 10.1007/s00198-009-1066-z. [DOI] [PubMed] [Google Scholar]
- 10.Black D, Duncan A, Robins SP. Anal Biochem. 1988;169:197. doi: 10.1016/0003-2697(88)90274-6. [DOI] [PubMed] [Google Scholar]
- 11.Takahashi M, Ohishi T, Aoshima H, Kushida K, Inoue T, Horiuchi K. J Liquid Chromatogr. 1993;16:1355. [Google Scholar]
- 12.Saito M, Marumo K, Fujii K, Ishioka N. Anal Biochem. 1997;253:26. doi: 10.1006/abio.1997.2350. [DOI] [PubMed] [Google Scholar]
- 13.Bank RA, Beekman B, Verzijl N, de Ross JADM, Sakkee AN, TeKoppele JM. J Chromatogr B. 1997;703:37. doi: 10.1016/s0378-4347(97)00391-5. [DOI] [PubMed] [Google Scholar]
- 14.Allen MR, Gineyts E, Leeming DJ, Burr DB, Delmas PD. Osteoporosis Int. 2008;19:329. doi: 10.1007/s00198-007-0533-7. [DOI] [PubMed] [Google Scholar]
- 15.Viguet-Carrin S, Gineyts E, Bertholon C, Delmas PD. J Chromatogr B. 2009;877:1. doi: 10.1016/j.jchromb.2008.10.043. [DOI] [PubMed] [Google Scholar]
- 16.Swartz ME. J Liq Chrom. 2005;28(7,8):1253. [Google Scholar]
- 17.Swartz ME. Separation Science Redefined. 2005;5:8. [Google Scholar]
- 18.Ebert RF. Anal Biochem. 1986;154:431. doi: 10.1016/0003-2697(86)90010-2. [DOI] [PubMed] [Google Scholar]
- 19.Berg RA. Methods Enzymol. 1982;82:372. doi: 10.1016/0076-6879(82)82074-0. [DOI] [PubMed] [Google Scholar]
- 20.Price PA, Poser JW, Raman N. Proc Natl Acad Sci USA. 1976;73:1447. doi: 10.1073/pnas.73.5.1447. [DOI] [PMC free article] [PubMed] [Google Scholar]
- 21.Nielsen-Marsh CM, Richards MP, Hauschka PV, Thomas-Oates JE, Trinkaus E, Pettitt PB, Karavanic I, Poinar H, Collins MJ. Proc Natl Acad Sci USA. 2005;102:4409. doi: 10.1073/pnas.0500450102. [DOI] [PMC free article] [PubMed] [Google Scholar]