Abstract
NMR analysis and molecular dynamics simulations of d(GGTAATTACC)2 and its complex with a tetrahydropyrimidinium analogue of Hoechst 33258 suggest that DNA minor groove recognition in solution involves a combination of conformational selection and induced fit, rather than binding to a preorganised site. Analysis of structural fluctuations in the bound and unbound states suggests that the degree of induced fit observed is primarily a consequence of optimising van der Waals contacts with the walls of the minor groove resulting in groove narrowing through: (i) changes in base step parameters, including increased helical twist and propeller twist; (ii) changes to the sugar–phosphate backbone conformation to engulf the bound ligand; (iii) suppression of bending modes at the TpA steps. In contrast, the geometrical arrangement of hydrogen bond acceptors on the groove floor appears to be relatively insensitive to DNA conformation (helical twist and propeller twist). We suggest that effective recognition of DNA sequences (in this case an A tract structure) appears to depend to a significant extent on the sequence being flexible enough to be able to adopt the geometrically optimal conformation compatible with the various binding interactions, rather than involving ‘lock and key’ recognition.
INTRODUCTION
The bis-benzimidazole-based ligands are the archetypal family of A tract minor groove binders. Hoechst 33258 (H33258) (Fig. 1) is widely used as an anthelmintic (1,2) and has shown some activity against L1210 and P388 leukemias (3), while several analogues have shown potent activity against a number of microorganisms, including those that lead to AIDS-related opportunistic infections (4–6). Many analogues, usually with replacements for or substituents on the piperazine and phenol rings, have been synthesised, introducing such functionalities as aniline mustard groups for DNA alkylation (7) and di- or trihydroxy phenols which coordinate metal ions with the capacity for cleaving DNA (8). The bis-benzimidazole family of DNA-binding ligands therefore provides a good starting point for rational drug design as well as good models with which to investigate the factors affecting DNA sequence recognition and minor groove binding.
Figure 1.
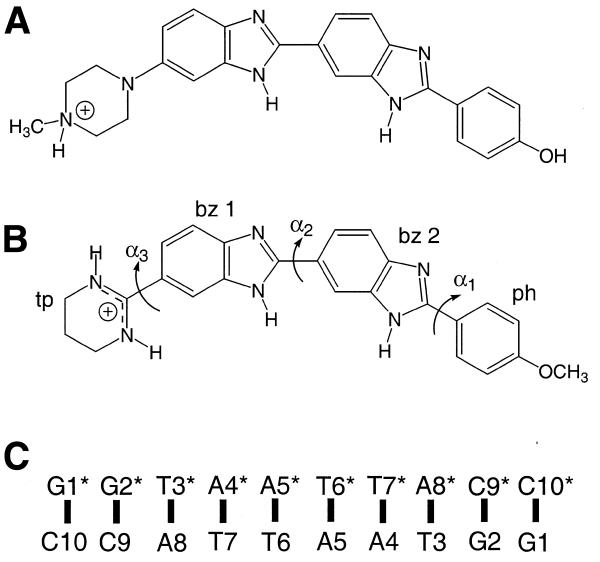
(A) H33258, (B) tetrahydropyrimidinium analogue of H43254 with torsion angles and ring nomenclature indicated and (C) nucleotide numbering scheme for the d(GGTAATTACC)2 decamer duplex.
We have focused our investigations on an analogue of H33258 with modified structural features designed to enhance minor groove recognition through direct hydrogen bonding via a 1,3,4,5-tetrahydropyrimidinium (tp) ring replacement for the N-methylpiperazine of H33258 (Fig. 1) (9). Our initial modelling studies suggested that in its most stable half chair conformation the tetrahydropyrimidinium NH is directed towards an adenine N3 on the floor of the groove, offering, in part, an explanation for the increased stability of the complex (9), but also suggesting enhanced A-T base selectivity. Indeed, it seems likely that this analogue does not possess the G-C tolerance of H33258 as a result of both the reduced steric bulk and the incompatibility of the hydrogen bond donor with the 2-amino group of guanine protruding into the groove. Here we examine in detail the structure of the decamer duplex d(GGTAATTACC)2 and its complex with H43254 using a combination of NOE restraints and molecular dynamics (MD) simulations employing an explicit solvation model (10–14).
In earlier work we described preliminary NMR studies of the structure of the drug–DNA complex in which we identified the site of binding and the nature of the interaction of the novel tetrahydropyrimidinium ring of this Hoechst analogue with the floor of the minor groove (15). The data supported our conclusion of enhanced AT specificity for this analogue of H33258 due to additional hydrogen bonding to the floor of the minor groove. We have developed the MD simulation protocol and have shown that the structure of the DNA dodecamer duplex alone converges to a common structure from A- and B-DNA starting stuctures over a period >500 ps (16). Analysis of the time-dependent conformation over the course of the MD simulation shows evidence for significant fluctuations between wide and narrow minor grooves. Here we have refined our earlier structure of the drug–DNA complex using a larger number of NOEs. We have identified detailed structural and conformational features of the complex and the nature of the interaction with the drug and have carried out long MD simulations to examine the effects of the drug on fluctuations in the DNA conformation. Our starting point for this was 1 ns of NOE-restrained dynamics to give us a good quality starting structure, which was extended by a further 1 ns of MD simulation with the NOE restraints removed. This allows the complex to explore conformational space and permits natural thermal deformation modes to be identified over a long simulation period. We have used principal component analysis (PCA) and novel methods of groove width analysis to identify specific dynamic processes (helical twisting and bending at the TpA steps), which we compare with MD data on free DNA to identify the effects on DNA conformation of ligand binding. In short, we have examined all aspects of the conformations and dynamics of the free DNA and its drug complex and have drawn conclusions regarding the extent to which drug binding induces changes in these various parameters. We describe the mechanism by which these conformational changes are likely to occur. Our results establish that minor groove recognition in solution involves a combination of conformational selection and induced fit, rather than binding to a preorganised site. We suggest that effective recognition of DNA sequences (in this case an A tract structure) appears to depend to a significant extent on the sequence being flexible enough to be able to adopt the geometrically optimal conformation compatible with the various binding interactions, rather than involving ‘lock and key’ recognition.
MATERIALS AND METHODS
The preparation of materials, the NMR methodology and general aspects of the MD simulation protocol used have been described in detail previously (15,16). H43254 was a gift from Hoechst (Frankfurt, Germany) and was used without further purification after checking by NMR. All simulations were run on a Silicon Graphics Origin 200 server interfaced with an O2 workstation using the particle mesh Ewald method with AMBER software (17).
Free DNA simulations
The NOE-restrained B-DNA (BR) dynamics simulation was run over 1 ns. An average structure and the root mean square deviation from the average structure were calculated over the final 700 ps of the trajectory using the CARNAL module of AMBER. Final average NOE restraint violations were 0.031 Å. An analogous set of calculations were performed but without any NOE distance restraints (BU). The BR and BU simulations converge to very similar final structures (root mean square deviation < 1.8 Å), as described previously (16). Most of the conformational features identified in BR, including patterns of helical twist and roll at the TpA steps, are reproduced in the unrestrained structure (BU). We see no anomolous distortion, such as bending into one or other groove, as a consequence of the distribution of NOE restraints, suggesting that the AMBER force field is reproducing structural features (base stacking interactions) consistent with the NOE data.
Drug–DNA complex
Point charges for H43254 were calculated by a semi-empirical approach within Spartan 3.1 (Wavefunction Inc., USA) using the AM1 method (18,19). Generation of starting structures of the complex was performed as described previously (15), with MD simulations extended to 1 ns. A full list of drug–DNA NOE restraints is provided in the Supplementary Material. Autocorrelation analysis was used to determine the equilibration period of each nanosecond trajectory. An average structure from the NOE-restrained simulation of the complex (CR) was calculated over the final 400 ps. To assess the impact of the NOE restraints on the structure the simulation was continued for a further 1 ns with the restraints removed gradually over the first 100 ps. The final 600 ps of the unrestrained simulation (CU) were subsequently analysed. Helicoidal parameters over the course of the trajectories were analysed with CURVES (20) and the mean structure calculated over the equilibrated periods. Root mean square deviations between starting and final energy minimised structures were calculated using MOLMOL (21). At the end of the restrained trajectory (CR) very few restraints were violated, just 21 of the total of 361, and none by >0.5 Å. The fit at the end of the unrestrained trajectory (CU) was not as good, with 39 restraints being violated out of the total of 361, 10 of them by >1 Å. Many of these correspond to DNA–DNA NOEs for base steps at or close to the ends of the sequence, consistent with some relaxation of the structure and greater dynamic fluctuations. A number of intermolecular NOEs were also violated; 15 of the total of 50, with 10 of these <0.5 Å and five ∼1 Å. The majority of the latter violations corresponded to weak NOEs (>4 Å), particularly between the drug and upper walls of the groove. Notably, the majority of the strong intermolecular NOEs (<3.5 Å) largely corresponding with interactions with the floor of the groove and the concave edge of the drug were not violated, indicating that the position of the drug in the groove and the interactions stabilising the complex are closely similar to those in the NOE-restrained complex CR. This is clearly evident from the hydrogen bonding interaction data presented in Tables 1 and 2 and from visual inspection of the structures and CURVES analysis of the various structural parameters. Details and some comparisons between CU and CR are discussed subsequently. We can conclude that the unrestrained MD simulation is realistically representing the solution structure determined in the presence of NOE restraints.
Table 1. Intermolecular hydrogen bonding distances (Å) and ligand torsion angles in degrees (α1, α2 and α3) in the d(GGTAATTACC)2 + H43254 complex.
| |
Hydrogen bonding interactions |
|
|
|
|
|
| |
bz2 NH–A5 N3 |
bz2 NH–T7* O2 |
bz1 NH–T6* O2 |
bz1 NH–T6 O2 |
tp NH–T7 O2 |
tp NH–A5* N3 |
| CRa |
2.26 (0.22) |
2.33 (0.20) |
2.72 (0.19) |
1.87 (0.10) |
2.42 (0.34) |
2.36 (0.28) |
| CUb |
2.52 (0.30) |
2.41 (0.24) |
2.18 (0.23) |
2.41 (0.27) |
2.56 (0.41) |
2.48 (0.28) |
| |
Bound conformation of H43254 |
|
|
|
|
|
| |
α1 |
|
α2 |
|
α3 |
|
| CRa |
0.3 (4.2) |
|
10.0 (4.1) |
|
18.9 (6.4) |
|
| CUb | 0.8 (4.0) | 1.3 (4.0) | 7.0 (7.7) |
Proton–heavy atom hydrogen bond distances and ligand torsion angles are shown for the mean structure together with one standard deviation from the mean in parentheses.
aCR, restrained simulation, mean (±SD) calculated over final 400 ps.
bCU, unrestrained simulation, mean (±SD) calculated over final 600 ps.
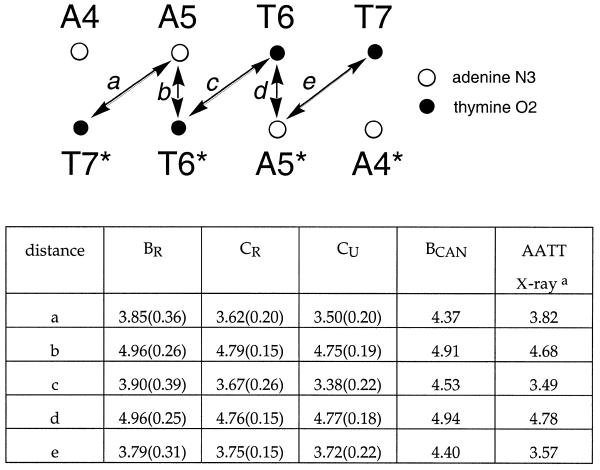
Table 2. Distances (Å) between hydrogen bond donors (adenine N3 and thymine O2) on the floor of the minor groove.
For BR, CR and CU mean values are indicated together with one standard deviation from the mean.
aX-ray structure of Teng et al. (29).
The dynamical and time-averaged characteristics of the response of the sugar–phosphate backbone to ligand binding were evaluated using a local cylindrical coordinate scheme we have developed (22). Defined with reference to the two N1/N9 to C1′ vectors of a base step, the angular coordinate of the phosphorus atom (θp) captures that component of the sugar–phosphate backbone’s mobility that most directly affects groove width. It also decouples this contribution from that due to changes in base step parameters (e.g. twist and roll). For canonical B-form DNA θp is 64°. An increase in θp correlates with a movement in the phosphorus atom position that will tend to reduce the width of the minor groove, and vice versa.
PCA was performed on the equilibrated portions of the unrestrained trajectories of the complex and free DNA (CU and BU) using methods described elsewhere (23). It is important to emphasise that the unrestrained simulations were used here to eliminate the effects of NOE restraints damping DNA deformation modes. In NOE-restrained structures of the complex this is likely to arise because of the different distribution of restraints, not from within the DNA, which is similar in both cases, but that involve ligand–DNA interactions. Briefly, the all-atom coordinate covariance matrix was constructed from each trajectory and diagonalised to give a set of eigenvectors. Each eigenvector describes a mode of correlated motion in the trajectory, whose relative importance (contribution to the overall motion observed) is given by the corresponding eigenvalue. The eigenvectors were animated and analysed visually using VMD (24). The similarity between eigenvectors obtained for the free DNA and those obtained for the complex was assessed by calculating their correlation coefficient (the dot product of the vectors). An ‘artificial’ eigenvector describing the conformational transition required to convert the time-averaged structure of the free DNA to the time-averaged structure of the complex was also calculated from the corresponding coordinate covariance matrix.
RESULTS AND DISCUSSION
Structural analysis by NMR
The C2v symmetry of the palindromic DNA duplex is lifted by the interaction of the ligand with the minor groove. This is clearly evident in the thymine methyl region, where six methyl resonances are identified, suggesting that the drug is bound at a single, high affinity site. In NOESY spectra of the 1:1 complex a number of chemical exchange cross-peaks are identified between corresponding protons on the non-equivalent strands of the decamer, indicating that the drug is dissociating slowly from the complex and is able to rebind in a 180° related orientation with a rate of exchange which we estimate to be 1.2–2.5 s–1 at 298 K (25–28). A detailed NMR analysis of the complex illustrating the quality of the data and describing resonance assignments and sequential assignment pathways has previously been presented (15). Further refinement of the data has identified 50 intermolecular NOEs from data sets collected in both D2O and H2O solutions. This exceeds the numbers seen in previous related studies and locates the drug with some precision in the A-T tract. For example, methylene protons on the tetrahydropyrimidinium ring define one end of the binding site through NOEs to A4* H1′ and A8 H2, while hydrogens on the methoxybenzyl ring are identified close in space to A4 H1′ and A8* H2 at the other end of the A-T tract. Of particular note are NOEs from the solvent-exposed convex edge of the drug to deoxyribose H4′, H5′ and H5′′, NOEs that have not generally been resolved in earlier studies. Their presence implies a deep and narrow minor groove that envelops the bound drug molecule.
MD simulations
The MD simulation protocol described has already demonstrated that the decamer duplex d(GGTAATTACC)2 can undergo a complex conformational transition from both canonical A and B starting structures to converge to a B-like conformation (root mean square deviation < 1.5 Å) on a time scale of 500–1000 ps (16). Using a full set of NOE restraints we have carried out a 1 ns simulation from the canonical B starting structure (BR) and have analysed the structure and dynamics to assess the impact of ligand binding. A second 1 ns simulation has also been performed without NOE restraints (BU). BR and BU show a high degree of convergence, with both simulations reproducing similar structural features, as described previously (16; see Materials and Methods).
Initial MD simulations on the d(GGTAATTACC)2 complex employed a subset of key drug–DNA NOEs applied to three different starting conformations of the complex to identify the drug binding site unbiased by starting structure (15). One structure was selected for refinement using a full set of 351 drug–DNA and DNA–DNA NMR-derived distance restraints, applied over a period of 1 ns (CR). An average structure was calculated from the final 400 ps of the trajectory. The simulation was continued for a further 1 ns without restraints (CU). While our NOE-restrained structure has highlighted detailed static features of the drug–DNA recognition process consistent with the experimental NOE data, a further 1 ns simulation in the absence of restraints has enabled us to probe principle thermal deformation modes (in the complex and free DNA) undistorted by any differences in the distribution of NOE restraints between the two structures (largely involving the bound ligand).
Drug–DNA recognition at the TAATTA site
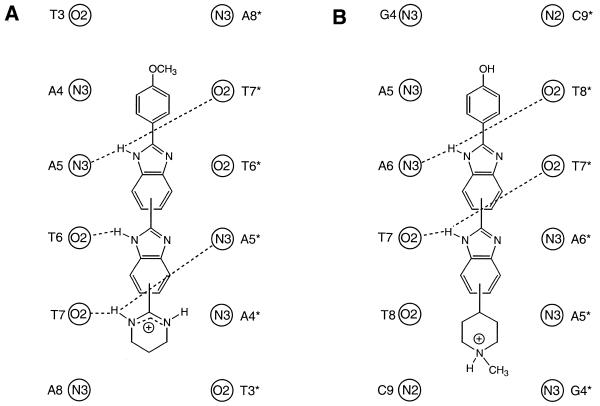
The overall structure of the complex determined from the NOE-restrained simulation (CR) is shown in Figure 2 as a family of overlaid snapshots from the final 100 ps. The drug is bound within the AT-rich region of the minor groove lying in a unique binding site covering the central AATT base pairs. The drug is insulated from the terminal GC base pairs by the intervening TpA steps (TAATTA), with the N-methylpiperazine ring at one end and the phenol ring at the other end of the ligand located close to these steps. There are a number of single and bifurcated hydrogen bonding contacts with the floor of the groove, as illustrated in Figure 3 and summarised in Table 1. We describe a more detailed dynamic analysis of these contacts below. Previous X-ray structures of H33258 complexes containing the CGAATTCG sequence have also shown the drug to bind symmetrically across the dyad axis (Fig. 3) with a very similar pattern of interactions to those seen here (29–32). The drug is located in the narrowest region of the AATT groove and this appears to be a primary determinant of binding specificity. In longer A tract structures (containing CAAATTTG) there is some evidence for displacement by 1 bp along the sequence (33,34), resulting in an ATTTG binding site, locating the N-methylpiperazine of H33258 away from the narrowest region of the minor groove.
Figure 2.
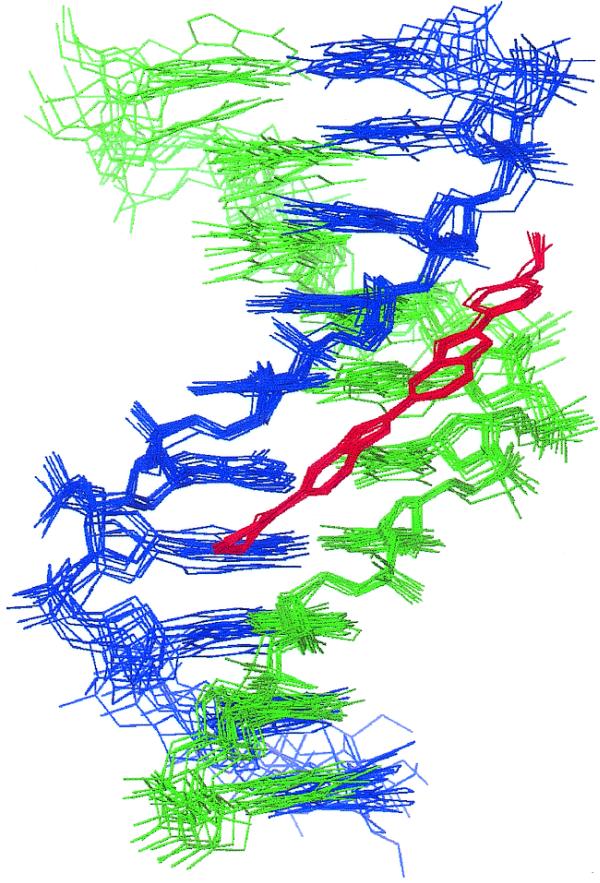
A family of overlaid snapshots of the complex of H43254 taken from the final 100 ps of the restrained MD simulation (CR).
Figure 3.
Schematic representation of intermolecular hydrogen bonding interactions in the H43254 complex with d(GGTAATTACC)2 (A) and in the X-ray structure of H33258 bound to d(CGCGAATTCGCG)2 (29) (B), showing both ligands binding across the central AATT sequence.
The torsion angles α1, α2 and α3 (Fig. 1) define the conformation of the bound ligand. Average values were determined over the equilibrated portion of the dynamics simulation and are presented in Table 1 (with data for the unrestrained complex CU). In all cases the rings are close to co-planar, the largest average deviation from this being ∼19° for α3 (connecting the tetrahydropyrimidinium ring to benzimidazole). Such small deviations from co-planarity allow the drug to adopt the optimal isohelical fit between the walls of the minor groove while optimising the register of hydrogen bonding interactions with the groove floor.
Analysis of DNA structure and effects of ligand binding
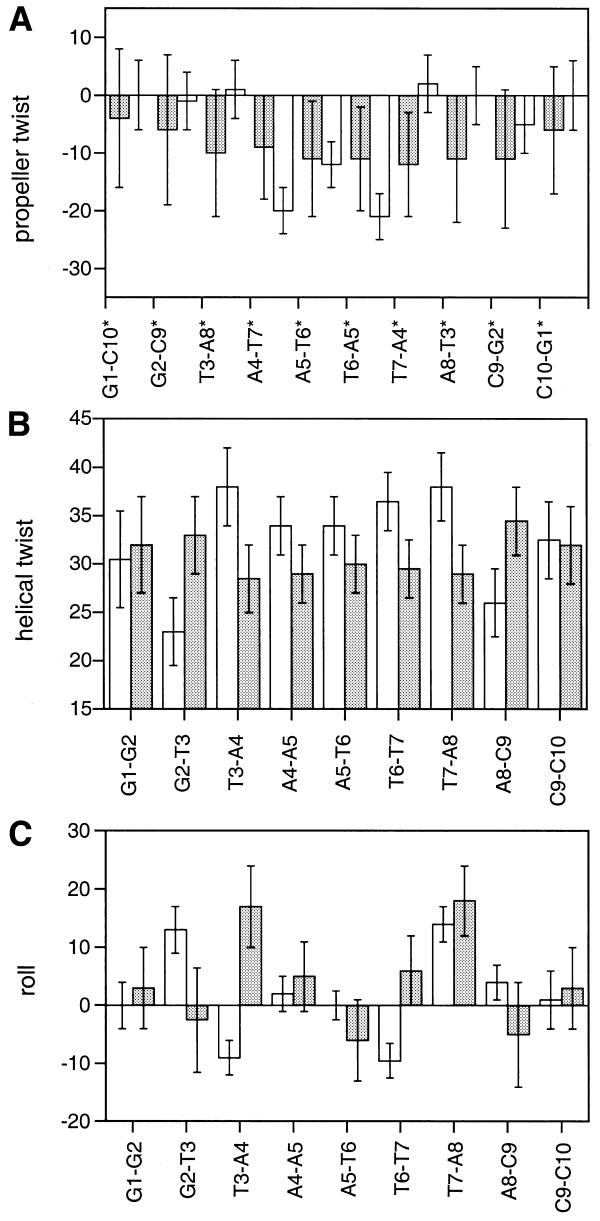
Plots of base pair roll, helical twist and propeller twist are shown for the restrained simulations BR and CR in Figure 4 in order to compare and contrast changes in DNA conformation induced by ligand binding. The structure of the ligand-free duplex is significantly unwound across the A tract (overall average helical twist ∼30°) compared with canonical B-DNA (∼36°). There are, however, distinct sequence-dependent conformational features associated with the TpA and flanking GpT steps. The helical twist at the GpT (ApC) steps are noticeably larger, while there is a distinct positive roll into the major groove at the TpA step to minimise cross-strand steric clashes between purine bases, which appear to have some influence in widening the minor groove (see below). The sequence has a uniform small negative propeller twist (approximately –8°) which appears to correlate with a wider minor groove (Fig. 5).
Figure 4.
Plots of propeller twist (°) (A), helix twist (°) (B) and roll (°) (C) for free d(GGTAATTACC)2 (BR) and its complex with H43254 (CR) (filled bars, free DNA; open bars, complex); bars indicate mean values calculated over the equilibrated portions of the dynamics simulations, with error bars indicating one standard deviation from the mean.
Figure 5.
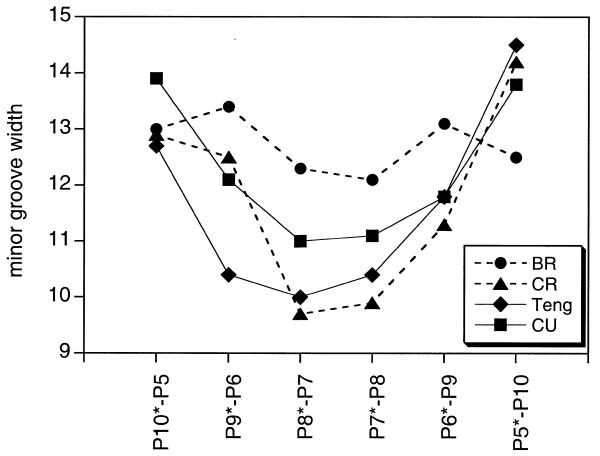
Minor groove width (Å) calculated from Pi – Pj + 3 distances for BR, CR, CU and the X-ray structure of the H33258 complex of Teng et al. (29). The x-axis indicates the P–P pair used to calculate distances; the X-ray structure is aligned as shown in Figure 3.
In contrast, the ligand appears to lock the A-T tract into a higher twist conformation close to that of canonical B-DNA (∼36°) in order to maximise isohelical complementarity with the curvature of the groove and maintain the phasing of hydrogen bonding interactions with the edges of the base pairs. The TpA steps are slightly over-twisted, in contrast to the marked under-twisting seen at these two steps in BR. However, the two flanking G2-T3 and A8-C9 base steps are quite underwound (23° and 25°, respectively), perhaps to compensate for the overwinding in the centre. The pattern of roll angles are quite different at the TpA and GpT steps, indicating that this parameter is particularly sensitive to the effects of ligand binding.
Propeller twist values show marked differences between the complex and the free DNA. Whereas the free DNA structure has a fairly uniform small negative twist (approximately –8°), the A4-T7*, A5-T6* and T6-A5* (but not T7-A6*) base pairs of CR are highly negatively twisted (–21°, –12° and –21°) precisely where the phenol and benzimidazole rings are located. This feature is consistent with all X-ray structures of related bis-benzimidazole–ligand complexes reported to date. Negative propeller twisting is known to correlate with a narrowing of the minor groove (35), but in this case it appears to be the result of a drug-induced effect to optimise drug–DNA recognition.
The mechanics of induced fit recognition and changes in minor groove width
An important difference between the simulations lies in the impact of the bound ligand on the average width of the minor groove and its dynamic fluctuations. The average groove width measured from the Pi – Pj + 3 distance between strands (where i and j are hydrogen bonded bases) during the course of the simulations of BR and CR (not shown) shows that the average minor groove width of BR is not particularly narrow, with significant fluctuations during the course of the trajectory that indicate that the structure is sampling conformations with both wide and narrow minor grooves. It is clear that the structure is not highly predisposed to ligand binding by having a narrow minor groove across the central A-T tract, as is also evident from the analysis of propeller twist and helical twist (Fig. 4). These conclusions are in general agreement with those from a number of earlier MD simulations on AATT-containing duplexes (13,14). In contrast, the average groove width in the complex (CR) is much narrower throughout the dynamics simulation. Moreover, the amplitude of fluctuations is also significantly smaller, reflecting the impact of the drug molecule in restricting conformational freedom or ‘groove breathing’, indicating a deeper energy well in which the complex resides.
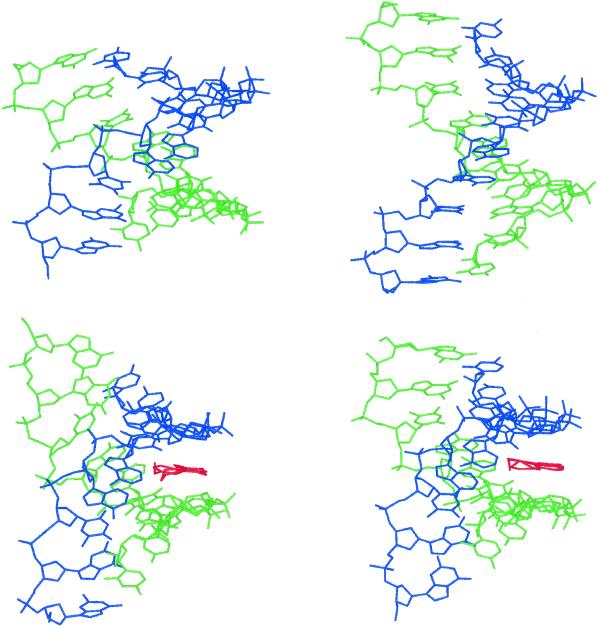
To what extent the NOE restraints are restricting the conformational dynamics has been examined in a further 1 ns simulation of the complex under identical conditions but without distance restraints (CU). Although the DNA conformation changes slightly, the groove width across the A-T tract remains narrow, with only small amplitude fluctuations from the mean structure. The groove narrowing observed across the AATT tract in both the restrained (CR) and unrestrained structures (CU), together with that of BR and the X-ray structure of Teng et al. (29) with H33258 bound in a similar position across the AATT site, are illustrated in Figure 5. A similar analysis of the amplitude of fluctuations in groove width in the unrestrained simulations (BU and CU) shows very similar characteristics to their restrained counterparts (data not shown). Thus, in comparing CR and CU the energetics of the interactions of the ligand with the minor groove (such as hydrogen bonds) appear to significantly restrict the dynamic fluctuations of the DNA, rather than the NOE restraints per se. The simulations suggest that a considerable degree of induced fit is involved in drug recognition; the drug appears to stabilise a flexible minor groove rather than fitting into a preorganised binding site. Two snapshots from the BR simulation, illustrating the view down the canyon of the minor groove, show fluctuations between both wide and narrow conformations (Fig. 6). Similar views of the complexes (CR and CU) are also illustrated, showing that the walls of the groove engulf the bound ligand to optimise van der Waals interactions.
Figure 6.
Views along the canyon of the minor groove across the AATT tract. (Top) Two snapshots taken from the simulation BR showing two conformations with different groove widths (see text). (Bottom) Snapshots taken from the simulations CR (left) and CU (right) showing the change in groove shape to optimise interactions with the bound ligand (also shown).
Changes in the sugar–phosphate backbone engulf the bound ligand
The relationship between groove width and local base step parameters involves a highly complex correlation between a large number of sugar–phosphate torsion angles. MD simulations have shown that the phophodiester backbone of DNA, although highly flexible, has highly anisotropic motions whose movements affect the width of the minor groove (22). Defined with reference to the two N1/N9 to C1′ vectors of a base step, the angular coordinate of the phosphorus atom (θp) describes the sugar–phosphate backbone’s mobility and how it affects groove width (see Materials and Methods).
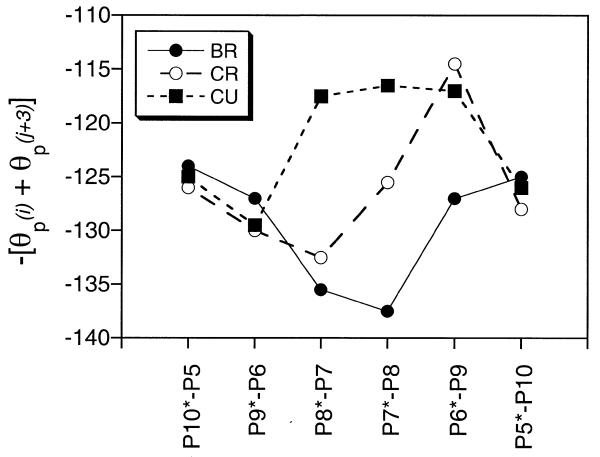
For further insight into the effect of ligand binding on the structure and flexibility of the walls of the minor groove the θp values for each phosphorus atom were monitored over the equilibrated portions of each dynamics simulation (BR, CR and CU). Figure 7 plots the average values of –[θp(i) + θp(j + 3)], since this allows direct comparison with standard groove width plots (e.g. Fig. 5). In the free DNA the sugar–phosphate backbone conformation tends to produce a narrower minor groove in the central A tract region. The presence of the drug clearly causes movements of the backbone that would tend to result in an increase in minor groove width. This is particularly evident in the case of the unrestrained simulation of the complex. The patterns of groove wall adjustment that this analysis reveals differ markedly from the final overall picture of the true minor groove width, which decreases on binding (Fig. 5). This is because the θp analysis eliminates the contribution that alterations in base step parameters makes to changes in groove dimensions. We can conclude that binding of the ligand induces changes in base step parameters that would tend to reduce the minor groove width. These are then actually partially offset by changes in sugar–phosphate conformation. Interestingly, this pattern of base step and sugar–phosphate conformational adjustments is the exact opposite of that observed in the analysis of crystal structures of the Dickerson–Drew dodecamer and its complexes with minor groove binding ligands (22). In that case ligand binding induces changes in base step parameters that tend to increase the groove width and the sugar–phosphate backbone adjusts to close the groove up again and clasp the ligand. In the X-ray structures the free DNA is much more preorganised for ligand binding, already possessing a narrow minor groove with high propeller twist and helical twist. To what extent these features arise as a consequence of crystal packing interactions is a matter of conjecture. On the other hand, NMR/MD simulations of free DNA (restrained or otherwise) generally show the DNA structure to be much more dynamic and significantly more unwound (13,14,16,36). To what extent these features are force field driven or represent a more realistic model of short DNA duplexes in solution at low dilution is again a matter for discussion. Interestingly, low helical twist is observed in a trigonal crystal (36), the type least likely to be affected by crystal packing forces.
Figure 7.
Average values of –[θp(i) + θp(j + 3)], where i and j are hydrogen bonded bases, from the MD simulations of d(GGTAATTACC)2. Results are shown for free DNA (BR) and both the restrained (CR) and unrestrained (CU) simulations of the complex. More negative values correspond to sugar–phosphate conformations that will tend to reduce the width of the minor groove.
Hydrogen bonding in the minor groove
Hydrogen bond distances between the drug and DNA bases were analysed in detail over the equilibrated portions of the simulations (Table 1). The hydrogen bond distances from bz2 NH (to A5 N3 and T7* O2) and from tp NH (to T7 O2 and A5* N3) are consistent with bifurcated interactions during both restrained and unrestrained simulations, as shown in Figure 3. However, the wide range of distances (from the optimal proton–heavy atom hydrogen bond distance of 1.8 to ∼3 Å) indicates that in each case, rather than a fixed bifurcated interaction there is considerable oscillation between the hydrogen bond donor and acceptor pairs involved in each bifurcated interaction. The hydrogen bond from bz1 NH to T6* O2 and T6 O2 shows similar values and ranges to the other two in the unrestrained simulation, again indicating oscillation between the two hydrogen bonds, but in the restrained simulation (CR) a bifurcated interaction is not seen; the NOE restraints indirectly restrict this interaction to a single hydrogen bond to T6 O2.
We have examined the extent to which the arrangement of hydrogen bond acceptors on the floor of the minor groove are preorganised for ligand binding by measuring their geometrical relationship in the free DNA simulation (BR), in canonical B-DNA (BCAN), in the complexes CR and CU and from X-ray structures of H33258 bound to an AATT site (29; Table 2). BCAN is unable to accommodate the bound ligand with the correct phasing of hydrogen bond acceptors because the cross-strand N3–O2 and O2–O2 distances are >1 Å longer than the optimum, as suggested previously (37). In contrast, in our calculated structure of free DNA (BR) these distances are not very different from the optimal distances found in the complexes (CR and CU) and in the X-ray structures. These observations suggest that initial binding to the floor of the groove is facilitated by a predisposed arrangement of hydrogen bond acceptors but that subsequent conformational changes are required, mainly to increase helical twist and propeller twist, that optimise van der Waals interactions while leaving the relative positioning of hydrogen bond acceptors largely unaffected.
Ligand-induced changes in correlated motions of DNA
PCA was carried out on unrestrained simulations of the free DNA and complex (BU and CU). The free DNA trajectory revealed three major modes or correlated motions; the two TpA steps show uncorrelated bending motions (roll into the major groove), while the third mode is a helical twisting and untwisting motion. Having calculated the eigenvector that describes the conformational transition between the time-averaged structures of the free and ligand-bound DNA, the similarity between this motion, required for drug binding, and the natural thermal modes of motion of the free DNA was assessed (see Materials and Methods) (23,24). We find that both bending modes contribute to the conformational transition. The reason for this is clear from examination of animations of the bending modes. These show that bending also affects the width of the minor groove in the locality of the TpA steps; the groove narrows as the bend is reduced. The overall narrow minor groove required for drug binding thus requires both TpA steps to straighten. In contrast, we see that the helix twisting eigenvector shows little correlation with the structural change vector, indicating that ligand binding does not involve distortion of the DNA structure in this direction, despite the fact that this is a naturally ‘soft’ mode of deformation.
The procedure was then repeated to examine how the natural thermal modes of motion of the complex relate to those of the free DNA. By calculation of dot products between eigenvectors for the free DNA and the complex the major mode of deformation of the complex is seen to resemble the major mode of deformation of the free DNA (not shown), i.e. it involves bending at one of the TpA steps. However, while the modes are similar, the range of values sampled is somewhat different, the bend in the complex tending to be reduced. In contrast, the bending motion at the second TpA step appears to be suppressed in the complex. The TpA step that remains flexible is that close to the charged tetrahydropyrimidinium end of the ligand. We suggest that as this end of the molecule is more hydrophilic, there is not the same requirement for the minor groove to clamp around the ligand to optimise van der Waals and hydrophobic interactions as is the case at the methoxyphenyl end. Specific solvation effects on the charged tetrahydropyrimidinium ring may also play some role in determining local conformational preferences.
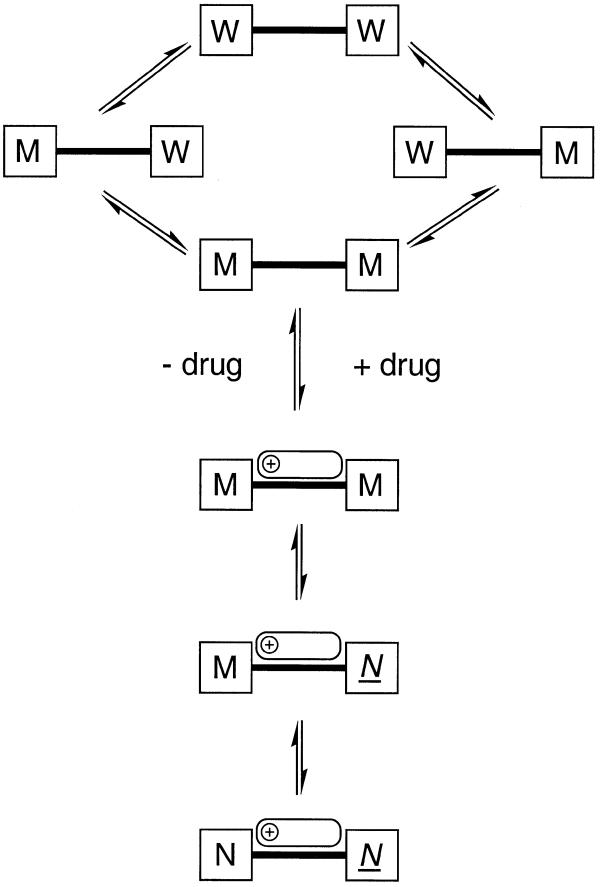
The results have been used to generate a conceptual model of how the dynamic flexibility of the oligonucleotide responds to drug binding (Fig. 8). Conformations of the DNA suitable for optimum drug–DNA interaction are generated thermally only infrequently, since they require simultaneous straightening of the two TpA steps, whose bending motion is uncorrelated. Drug binding to any number of different DNA conformations is not excluded, but subsequent optimisation of interactions through induced fit may proceed as follows. Once bound, the drug ‘locks’ the bending motion at one TpA step, but the same bending motion, but over a different range of angles, is still possible at the other TpA step, resulting in some variability in minor groove width in this region. The analysis emphasises the degree to which optimisation of the drug–DNA binding interaction, at least in this system, involves a significant component of induced fit, and which principal components of DNA flexibility are perturbed in this optimisation process. The extent to which these ligand-induced perturbations to DNA dynamics can be equated with entropic changes on binding remains to be established.
Figure 8.
Schematic representation of the flexibility of the DNA and its response to drug binding, derived from PCA analysis of the MD data. In the absence of the drug (top) bending at the TpA steps causes each end of the minor groove to fluctuate independently between wide (W) and medium (M) widths. Conformations in which both halves of the minor groove are at their narrowest (M–M) are optimal for drug binding, although ligand binding can occur to any one of these DNA conformations, with subsequent optimisation of the interaction through induced fit, as follows. Once the complex has formed, the TpA step close to the methoxyphenyl end of the ligand becomes narrow and inflexible (N) in order to maximise interactions with the ligand, while the TpA step closer to the positively charged end of the drug remains flexible, allowing the minor groove width in these lowest energy structures to vary between medium (M) and narrow (N).
CONCLUSIONS
The majority of X-ray structural analyses of A tract DNA duplexes, together with their drug–DNA complexes, suggest that the conformation of the minor groove is largely preorganised for binding bis-benzimidazole-based ligands (33). In a few cases an exceptionally narrow groove has been identified, requiring groove expansion to accommodate a bound ligand (38). This is exemplified by the accommodation of distamycin and synthetic polyamide side-by-side dimers within the minor groove (39,40), demonstrating an intrinsic groove flexibility. The extent to which crystal packing forces influence DNA conformation has been addressed recently by comparison of structures of the same sequence crystallised in different space groups (41), suggesting that lattice forces may have a significant influence on DNA conformation. The crystal environment is entirely different to that found in solution, with the latter permitting intrinsically larger amplitude fluctuations in conformation. MD simulations allow the time-dependent features to be examined and, as reported here, paint a picture of the drug modulating the structure and dynamics of duplex DNA as a consequence of (cooperative) interactions with the floor of the groove. The data suggest that the degree of induced fit observed is primarily a consequence of optimising van der Waals contacts with the walls of the minor groove, resulting in groove narrowing through: (i) changes in base step parameters, including increased helical twist and propeller twist; (ii) changes to the sugar–phosphate backbone conformation to engulf the bound ligand; (iii) suppression of bending modes at the TpA steps. The geometrical arrangement of hydrogen bond acceptors on the groove floor appears to be relatively insensitive to conformation since the low helical twist, low propeller twist conformation for the free DNA gives very similar distances to those found in the complexes which, in contrast, are DNA conformations with larger helical twist and a large A-T propeller twist. Effective recognition of DNA sequences (in this case an A tract structure) appears to depend to a significant extent on the sequence being flexible enough to be able to adopt the geometrically optimal conformation compatible with the various binding interactions, rather than necessarily having a preorganised conformation that permits ‘lock and key’ recognition. It has already been established from NMR and X-ray analysis that the position and orientation of H33258 and analogues within the minor groove is sequence dependent (see references above; 33,38,42) and that binding affinities for some A tract sequences are greater than for others (43). The extent to which the differences in binding affinities are a consequence of sequence-dependent variations in DNA dynamics, rather than in static structural features, has not been addressed by the body of structural data available. The degree to which the conformation of DNA is ‘preorganised’ for ligand binding seems likely to impact significantly on the energetics of the binding interaction.
SUPPLEMENTARY MATERIAL
Supplementary Material is available at NAR Online.
Acknowledgments
ACKNOWLEDGEMENTS
We thank Hoechst (Germany) for providing a sample of the ligand described, John Keyte (School of Biomedical Sciences, University of Nottingham) for oligonucleotide synthesis and Huw Williams for help with some computational aspects of the work. We thank the EPSRC and BBSRC of the UK for funding research studentships to C.E.B.-S. and S.A.H., respectively. We acknowledge the Department of Chemistry and the University of Nottingham for financial contributions.
References
- 1.Raether W. and Lammler,G. (1971) The filaricidal effect of basically substituted 2,6-benzimidazoles in Litomosoides carinii infection of the cotton rat (Sigmodon hispidus). Ann. Trop. Med. Parasitol., 65, 107–115. [DOI] [PubMed] [Google Scholar]
- 2.Denham D.A., Suswillo,R.R., Rogers,R., McGreevy,P.B. and Andrew,B.J. (1976) Studies on Brugia pahangi. 13. The anthelmintic effect of compounds F151 (Friedheim), HOE 33258 (Hoechst) and their reaction product. J. Helminthol., 50, 243–250. [DOI] [PubMed] [Google Scholar]
- 3.Patel S.R., Kvols,L.K., Rubin,J., O’Connell,M.J., Edmonson,J.H., Ames,M.M. and Kovach,J.S. (1991) Phase I-II study of pibenzimol hydrochloride (NSC-322921) in advanced pancreatic carcinoma. Invest. New Drugs, 9, 53–57. [DOI] [PubMed] [Google Scholar]
- 4.Tidwell R.R., Jones,S.K., Naiman,N.A., Berger,L.C., Brake,W.B., Dykstra,C.C. and Hall,J.E. (1993) Activity of cationically substituted bis-benzimidazoles against experimental Pneumocystis carinii pneumonia. Antimicrob. Agents Chemother., 37, 1713–1719. [DOI] [PMC free article] [PubMed] [Google Scholar]
- 5.Bell C.A., Dykstra,C.C., Naiman,N.A., Cory,M., Fairley,T.A. and Tidwell,R.R. (1993) Structure activity studies of dicationically substituted bis-benzimidazoles against Giardia lamblia—correlation of antigiardial activity with DNA-binding affinity and giardial topoisomerase II inhibition. Antimicrob. Agents Chemother., 37, 2668–2678. [DOI] [PMC free article] [PubMed] [Google Scholar]
- 6.Fairley T.A., Tidwell,R.R., Donkor,I., Naiman,N.A., Ohemeng,K.A., Lombardy,R., Bently,J.A. and Cory,M. (1993) Structure, DNA minor groove binding and base-pair specificity of alkyl-linked and aryl-linked bis(amidinobenzimidazoles) and bis(amidinoindoles). J. Med. Chem., 36, 1746–1753. [DOI] [PubMed] [Google Scholar]
- 7.Gravatt G.L., Baguley,B.C., Wilson,W.R. and Denny,W.A. (1994) DNA-directed alkylating agents. 6. Synthesis and anti-tumour activity of DNA minor groove targeted aniline mustard analogues of pibenzimole. J. Med. Chem., 37, 4338–4345. [DOI] [PubMed] [Google Scholar]
- 8.Parkinson J., Sadat-Ebrahimi,S., Wilton,A., McKie,J., Andrews,J. and Douglas,K.T. (1995) Predictability of designing specific binding interactions for DNA minor groove ligands from NMR spectroscopy and molecular modeling: a copper(II)-activated DNA cleaver based on Hoechst 33258. Biochemistry, 34, 16240–16244. [DOI] [PubMed] [Google Scholar]
- 9.Bostock-Smith C.E., Embrey,K.J. and Searle,M.S. (1997) Enhanced binding of a cyclic amidine analogue of Hoechst 33258 to the minor groove of DNA: 1H NMR and UV melting studies with the decamer duplex d(GGTAATTACC)2. J. Chem. Soc. Chem. Commun., 1, 121–122. [Google Scholar]
- 10.York D.M., Yang,W., Lee,H., Darden,T.A. and Pederson,L.G. (1995) Toward the accurate modelling of DNA: the importance of long-range electrostatics. J. Am. Chem. Soc., 117, 5001–5002. [Google Scholar]
- 11.Lee H., Darden,T.A. and Pederson,L.G. (1995) Accurate crystal-molecular dynamics simulations using particle mesh Ewald—RNA dinucleotides ApU and GpC. J. Chem. Phys., 243, 229–235. [Google Scholar]
- 12.Cheatham T.E., Miller,J.L., Fox,T., Darden,T.A. and Kollman,P.A. (1995) Molecular dynamics simulations on solvated biomolecular systems: the particle mesh ewald method leads to stable trajectories of DNA, RNA and proteins. J. Am. Chem. Soc., 117, 4193–4194. [Google Scholar]
- 13.Duan Y., Wilkosz,P., Crowley,M. and Rosenberg,J.M. (1997) Molecular dynamics simulation study of the DNA decamer d(CGCGAATTCGCG) in solution: conformation and hydration. J. Mol. Biol., 272, 553–572. [DOI] [PubMed] [Google Scholar]
- 14.Young M., Ravishankar,G. and Beveridge,D.L. (1997) A 5-nanosecond molecular dynamics trajectory for B-DNA: analysis of structure, motions and hydration. Biophys. J., 73, 2313–2336. [DOI] [PMC free article] [PubMed] [Google Scholar]
- 15.Bostock-Smith C.E., Laughton,C.A. and Searle,M.S. (1998) DNA minor groove recognition by a tetrahydropyrimidinium analogue of Hoechst 33258: NMR and molecular dynamics studies of the complex with d(GGTAATTACC)2. Nucleic Acids Res., 26, 1660–1667. [DOI] [PMC free article] [PubMed] [Google Scholar]
- 16.Bostock-Smith C.E., Laughton,C.A. and Searle,M.S. (1999) Solution structure and dynamics A-T tract DNA decamer duplex d(GGTAATTACC)2: implications for recognition by minor groove binding drugs. Biochem. J., 342, 125–132. [PMC free article] [PubMed] [Google Scholar]
- 17.Pearlman D.A., Case,D.A., Caldwell,J.W., Ross,W.S., Cheatham,T.E., Ferguson,D.M., Seibel,G.L., Singh,U.C., Weiner,P.K. and Kollman,P.A. (1995) AMBER 4.1. University of California, San Francisco, CA.
- 18.Orozco M. and Luque,F.J. (1990) On the use of AM1 and MNDO wave-functions to compute accurate electrostatic charge. J. Comput. Chem., 11, 909–913. [Google Scholar]
- 19.Luque F.J. and Orozco,M. (1990) Reliability of the AM1 wave-function to compute molecular electrostatic potentials. Chem. Phys. Lett ., 168, 269–275. [Google Scholar]
- 20.Lavery R. and Sklenar,H. (1998) The definition of generalized helical parameters and of axis curvature for irregular nucleic acids. J. Biomol. Struct. Dyn., 6, 63–91. [DOI] [PubMed] [Google Scholar]
- 21.Koradi R., Billeter,M. and Wüthrich,K. (1996) MOLMOL: a program for display and analysis of macromolecular structures. J. Mol. Graphics, 14, 51–61. [DOI] [PubMed] [Google Scholar]
- 22.Laughton C.A. and Luisi,B.F. (1998) The mechanics of minor groove width variation in DNA and its implications for the accommadation of ligands. J. Mol. Biol., 288, 953–963. [DOI] [PubMed] [Google Scholar]
- 23.Sherer E., Harris,S.A., Soliva,R., Orozco,M. and Laughton,C.A. (1999) Molecular dynamics studies on A-tract structure and flexibility. J. Am. Chem. Soc., 121, 5981–5991. [Google Scholar]
- 24.Humphrey W., Dalke,A. and Schulten,K. (1996) VMD: visual molecular dynamics. J. Mol. Graphics, 14, 33–39. [DOI] [PubMed] [Google Scholar]
- 25.Searle M.S. and Embrey,K.J. (1990) Sequence-specific interaction of Hoechst 33258 with the minor groove of an adenine-tract DNA duplex studied in solution by 1H NMR. Nucleic Acids Res., 18, 3753–3762. [DOI] [PMC free article] [PubMed] [Google Scholar]
- 26.Embrey K.J., Searle,M.S. and Craik,D.J. (1993) Interaction of Hoechst 33258 with the minor groove of the A+T rich DNA duplex d(GGTAATTACC)2 studied in solution by NMR spectroscopy. Eur. J. Biochem., 211, 437–447. [DOI] [PubMed] [Google Scholar]
- 27.Fede A., Billeter,M., Leupin,W. and Wüthrich,K. (1993) Determination of the NMR solution structure of the Hoechst 33258-d(GTGGAATTCCAC)2 complex and comparison with the X-ray crystal structure. Structure, 1, 177–186. [DOI] [PubMed] [Google Scholar]
- 28.Fede A., Labhardt,A., Bannwarth,W. and Leupin,W. (1991) Dynamics and binding mode of Hoechst 33258 to d(GTGGAATTCCAC)2 in the 1:1 solution complex as determined by two-dimensional 1H NMR. Biochemistry, 30, 11377–11388. [DOI] [PubMed] [Google Scholar]
- 29.Teng M.-K., Usman,N., Frederick,C.K. and Wang,A.H.-J., (1988) The molecular structure of the complex of Hoechst 33258 and the DNA dodecamer d(CGCGAATTCGCG). Nucleic Acids Res., 16, 2671–2690. [DOI] [PMC free article] [PubMed] [Google Scholar]
- 30.Quintana J.R., Lipanov,A.A. and Dickerson,R.E. (1991) Low-temperature crystallographic analyses of the binding of Hoechst 33258 to the double helical DNA dodecamer CGCGAATTCGCG. Biochemistry, 30, 10294–10306. [DOI] [PubMed] [Google Scholar]
- 31.Clark G.R., Squire,C.J., Gray,E.J., Leupin,W. and Neidle,S. (1996) Designer DNA-binding drugs: the crystal structure of a meta-hydroxy analogue of Hoechst 33258 bound to d(CGCGAATTCGCG)2. Nucleic Acids Res., 24, 4882–4889. [DOI] [PMC free article] [PubMed] [Google Scholar]
- 32.Clark G.R., Boykin,D.W., Czarny,A. and Neidle,S. (1997) Structure of a bis-amidinium derivative of Hoechst 33258 complexed to dodecanucleotide d(CGCGAATTCGCG)2: the role of hydrogen bonding in minor groove drug–DNA recognition. Nucleic Acids Res., 25, 1510–1515. [DOI] [PMC free article] [PubMed] [Google Scholar]
- 33.Vega M.C., García Sáez,I., Aymamí,J., Eritja,R., van der Marel,G., van Boom,J.H., Rich,A. and Coll,M. (1994) Three-dimensional crystal structure of the A-tract DNA dodecamer d(CGCAAATTTGCG)2 complexed with the minor groove binding drug Hoechst 33258. Eur. J. Biochem., 222, 721–726. [DOI] [PubMed] [Google Scholar]
- 34.Spink N., Brown,D.G., Skelly,J.V. and Neidle,S. (1994) Sequence-dependent effects in drug–DNA interaction: the crystal structure of Hoechst 33258 bound to the d(CGCAAATTTGCG)2. Nucleic Acids Res., 22, 1607–1612. [DOI] [PMC free article] [PubMed] [Google Scholar]
- 35.Nelson H.M., Finch,J.T., Luisi,B.F. and Klug,A. (1987) The structure of an oligo(dA).oligo(dT) tract and its biological implications. Nature, 330, 221–226. [DOI] [PubMed] [Google Scholar]
- 36.Ulyanov N.B. and James,T.L. (1995) Statistical analysis of DNA duplex structural features. Methods Enzymol., 261, 90–120. [DOI] [PubMed] [Google Scholar]
- 37.Clark G.R., Gray,E.J., Neidle,S., Li,Y.-H. and Leupin,W. (1996) Isohelicity and phasing in drug-DNA sequence recognition: crystal structure of a tris(benzimidazole)-oligonucleotide complex. Biochemistry, 35, 13745–13752. [DOI] [PubMed] [Google Scholar]
- 38.Aymami J., Nunn,C.M. and Neidle,S. (1999) DNA minor groove recognition of a non-self-complementary AT-rich sequence by a tris-benzimidazole ligand. Nucleic Acids Res., 27, 2691–2698. [DOI] [PMC free article] [PubMed] [Google Scholar]
- 39.Kielkopf C.L., Baird,E.E., Dervan,P.B. and Rees,D.C. (1998) Structural basis for G-C recognition in the DNA minor groove. Nature Struct. Biol., 5, 104–109. [DOI] [PubMed] [Google Scholar]
- 40.Kopka M.L., Goodsell,D.S., Han,D.S., Chiu,T.K., Lown,J.W. and Dickerson,R.E. (1997) Defining G-C specificity in the minor groove: side-by-side binding of the di-imidazole lexitropsin to CATGGCCATG. Structure, 5, 1033–1046. [DOI] [PubMed] [Google Scholar]
- 41.Johansson E., Parkinson,G. and Neidle,S. (2000) A new crystal form for the dodecamer CGCGAATTCGCG: symmetry effects on sequence-dependent DNA structure. J. Mol. Biol., 300, 551–561. [DOI] [PubMed] [Google Scholar]
- 42.Gavathiotis E., Sharman,G.J. and Searle,M.S. (2000) Sequence-dependent variation in DNA minor groove width dictates orientational preference of Hoechst 33258 in A-tract recognition: solution NMR structure of the 2:1 complex with d(CTTTTGCAAAAG)2. Nucleic Acids Res., 28, 728–735. [DOI] [PMC free article] [PubMed] [Google Scholar]
- 43.Abu-Daya A. and Fox,K.R. (1997) Interaction of minor groove binding ligands with long AT tracts. Nucleic Acids Res., 25, 4962–4969. [DOI] [PMC free article] [PubMed] [Google Scholar]
Associated Data
This section collects any data citations, data availability statements, or supplementary materials included in this article.


