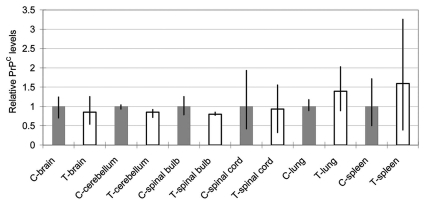
Figure 5.
Relative PrPC levels (PrPC/actin) in several organs of the transgenic calf as revealed by western blotting. Gray columns show control levels expressed as unity. Blank columns show those of the transgenic calf. Bars show the range of three data obtained by application of 2.5, 5.0 and 10.0 µg proteins/lane. No statistically significant difference was found in any pair.

