Abstract
In the present study, we conducted a Phase 1 study of a recombinant anti-EGFR monoclonal antibody (CMAB009) that has the same amino acid sequence as cetuximab. The purpose of this study was to evaluate the safety, pharmacokinetics and potential benefit of CMAB009 in Chinese patients with advanced chemotherapy-resistant epithelial malignancies. In this study 18 patients were treated with two successive treatment schedules comprising a single-dose escalation phase followed by a weekly, multiple-dose extension phase. No dose-limiting toxicity was reported during the evaluation period. CMAB009-associated toxicity was minimal, and the most commonly reported adverse events were fever, asthenia, transaminase elevation, nausea and skin toxicities. CMAB009 exhibited a non-linear PK profile over the dose range of 100–400 mg/m2. In the single-dose phase, CMAB009 reached peak serum concentrations at the end of the infusion and then declined slowly with a Tl/2 of 77.15 ± 13.96 h, 79.79 ± 6.91 h and 86.25 ± 9.93 h after infusion of 100, 250 and 400 mg/m2 based on a two compartmental model analysis. Mean Cmax increased roughly dose-proportional while AUC0-∞ showed a greater than dose-proportionate increase from 100 to 400 mg/m2. After multiple infusions, serum concentrations dropped slowly and the Tl/2 was 102.25 ± 33.54 h and 118.91 ± 29.12 h based on a two compartmental model analysis. No neutralizing anti-antibody antibodies were detectable. Two patients achieved partial remissions. The study results suggest that CMAB009 shows acceptable tolerance and primary efficacy and should be studied as a treatment in patients with advanced chemotherapy-resistant epithelial malignancies.
Key words: epidermal growth factor receptor, monoclonal antibody, pharmacokinetics, safety, epithelial malignancies
Introduction
The epidermal growth factor receptor (EGFR), also known as HER1 and ErbB1, is a 170 kD plasma membrane glycoprotein composed of an extracellular ligand-binding domain, a transmembrane lipophilic segment and an intracellular protein kinase domain with a regulatory carboxyl terminal segment.1,2 Activation of EGFR through ligand binding with epidermal growth factor or transforming growth factorα leads to receptor dimerization, kinase activation and autophosphorylation, which results in activation of a cascade of biochemical and physiologic responses that are involved in the mitogenic signal transduction of cells.3–5 Although EGFR is constitutively expressed in many normal epithelial tissues, including the skin and hair follicle, the expression of EGFR is elevated in many epithelial tumors.6 This overexpression correlates with early disease progression, poor survival and resistance to chemotherapy.6,7 Therefore, inhibition of the EGFR signal transduction pathway is a potential target for anticancer therapy.
CMAB009 is a recombinant, human/mouse chimeric monoclonal antibody (mAb) that binds specifically to the extracellular domain of EGFR. It is composed of the Fv regions of a murine anti-EGFR antibody with human IgG1 heavy and κ light chain constant regions. It is a biosimilar of cetuximab (C225, Erbitux, ImClone Systems Inc. and Merck KGaA).8,9 Two studies in the US have explored the pharmacokinetics (PK) of single-dose administration of cetuximab in patients with solid tumors, with particular attention paid to the elimination phase.10,11 Both studies supported the saturation of EGFR binding at a clinically achievable dose level. A significant association was also noted between cetuximab clearance and both body surface area (BSA) and weight, supporting the use of these parameters in calculating individual cetuximab doses.10,11 Cetuximab is expressed in NS0 cells, which is a stably transfected murine myeloma cell line, whereas CMAB009 is expressed in Chinese hamster ovary (CHO) cells. Moreover, stabilizing excipients instead of phosphate buffered solution (PBS) are used in the final product formulation of CMAB009 (Sup. Table 1). We compared the in vitro and in vivo biological activities of these two antibodies (Sup. Materials and Methods). The in vitro assays showed that CMAB009 had similar ability as cetuximab to mediate antibody-dependent cell cytotoxicity and inhibit cell proliferation (Sup. Figs. 1 and 2). In the competition inhibition assays, CMAB009 competed with cetuximab for binding to EGFR-positive A431 cells and displayed binding affinity comparable to that of cetuximab (Sup. Fig. 3). Immunotherapeutic studies further demonstrated that these two antibodies were equally effective in suppressing primary tumor growth in an A431 xenografted mouse model (Sup. Fig. 4).
In this study, we described the Phase 1 clinical study of CMAB009 in patients with advanced chemotherapy-resistant epithelial malignancies. In addition to investigating the safety and immunogenicity of this antibody, this study provided information regarding the PK profile of CMAB009 that will be used in the rational selection of CMAB009 doses and schedules for Phase 2 and Phase 3 studies. In addition, preliminary data on antitumor activity were also collected.
Results
Demographics.
Between March and August 2008, 18 patients were randomized to receive a single dose of CMAB009 at one of three levels or continuous weekly administrations of CMAB009. A total of 15 patients were enrolled in the single-dose phase. On day 29, three patients discontinued treatment due to disease progression or clinical deterioration (patient 2, 11 and 14). The remaining 12 patients and three new incoming patients (16, 17 and 18) were sequentially assigned to group A or group B in the subsequent fixed dose phase (Sup. Table 2). All patients had previously been treated with multiple therapies. Patient characteristics are shown in Table 1. There were no significant differences among the three groups with regard to age, sex, height, weight, Eastern Cooperative Oncology Group (ECOG) and BSA (Table 2). Eight patients received beneficence medication post-study due to stable disease (mean of 4–16 times). All patients completed standard full-dose medication.
Table 1.
Patient characteristics
| No. patients | |
| Total | 18 |
| Treated on fixed dose extension phase | 14 |
| Median age, y (range) | 52 (29–64) |
| Sex | |
| Male | 9 |
| Female | 9 |
| Tumor type | |
| Colorectal | 10 |
| NSCLC | 7 |
| Gastric | 1 |
| No. prior chemotherapy regimens | |
| 2 | 7 |
| 3 | 4 |
| ≥3 | 4 |
| Radiotherapy | 7 |
Table 2.
Subject characteristics at baseline (Mean ± SD)
| Single-dose phase | Multiple-dose phase | ||||
| Characteristic | 100 mg/m2 (n = 3) | 250 mg/m2 (n = 6) | 400 mg/m2 (n = 6) | Group A (n = 7) | Group B (n = 8) |
| Age (years) | 58.00 | 55.00 | 55.50 | 57.00 | 54.00 |
| (31.00–61.00) | (48.00–57.00) | (42.00–61.00) | (48.00–61.00) | (49.00–58.00) | |
| Height (cm) | 161.00 | 168.50 | 173.00 | 165.00 | 171.00 |
| (145.00–170.00) | (165.00–172.00) | (160.00–176.00) | (152.00–172.00) | (160.00–175.00) | |
| Weight (kg) | 54.00 | 67.50 | 63.50 | 67.00 | 66.50 |
| (37.00–58.00) | (67.00–70.00) | (54.00–81.00) | (46.00–71.00) | (61.75–76.00) | |
| BSA (m2) | 1.55 | 1.75 | 1.75 | 1.74 | 1.76 |
| (1.20–1.67) | (1.70–1.80) | (1.50–1.90) | (1.40–1.81) | (1.61–1.87) | |
| ECOG | 1.00 | 1.00 | 1.00 | 1.00 | 1.00 |
| (1.00–2.00) | (1.00–1.00) | (1.00–1.00) | (1.00–2.00) | (1.00–1.00) | |
Safety.
Treatment with CMAB009 was well-tolerated. Of a total of 18 CMAB009 administrations, there were no episodes of grade 3 or higher drug-related toxicity (Table 3). No dose-limiting toxicity (DLT) was reported during the evaluation period and therefore, the maximum-tolerated dose (MTD) was not reached in this study. During the multiple-dose phase, some patients developed mild painful bilateral periungual lesions on the fingers, but none discontinued treatment or withdrew from the study. During the entire study, including both the single-dose and the extended-dose phases, the most frequently occurring adverse events (AEs) were acne-like rash (61.11%), fever chills (55.56%), nausea/vomiting (27.78%) and headache (16.67%). All of the related AEs were mild and tolerated.
Table 3.
CMAB009-related toxicities
| N = 18 | CTC Grade | Total no. events | % | ||
| I | II | III–IV | |||
| Acne-like rash | 10 | 1 | 0 | 11 | 61.1 |
| Fever chills | 6 | 4 | 0 | 10 | 55.6 |
| Nausea/vomiting | 5 | 0 | 0 | 5 | 27.8 |
| Headache | 3 | 0 | 0 | 3 | 16.7 |
| Fatigue/malaise | 1 | 0 | 0 | 1 | 5.6 |
| Transaminase elevation | 1 | 0 | 0 | 1 | 5.6 |
| Paronychia | 1 | 0 | 0 | 1 | 5.6 |
| Nasal discharge | 1 | 0 | 0 | 1 | 5.6 |
Single-dose pharmacokinetics of CMAB009.
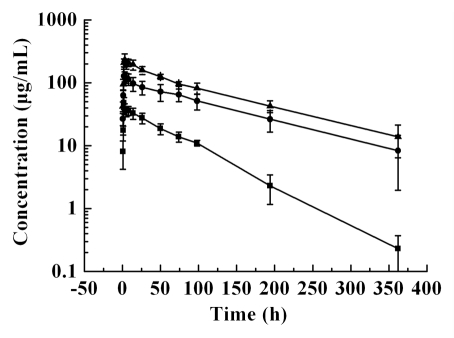
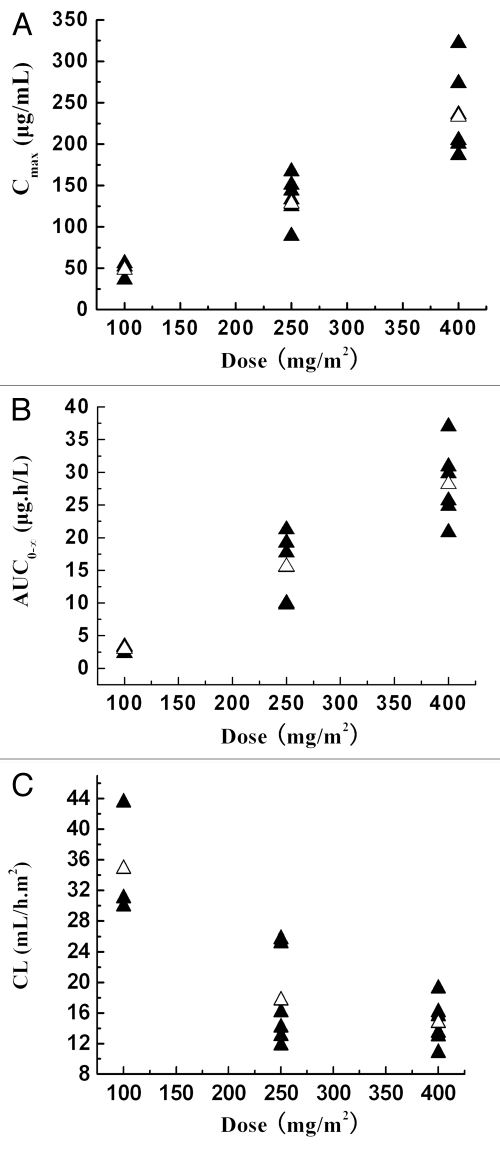
The mean serum concentration-time curves of CMAB009 following a dose of 100 mg/m2, 250 mg/m2 and 400 mg/m2 are shown in Figure 1. Concentration-time curve for each patient at the lowest dose group of 100 mg/m2 is shown in Supplemental Figure 5. CMAB009 was analyzed using a non-compartmental and a two-compartmental approach. The PK parameters were summarized in Table 4A and B. The PK parameters after non-compartmental and compartmental analysis were mostly in good agreement, with the exception of Tl/2ke of the lowest dose group. Following infusion of a single dose of CMAB009 at either 100 mg/m2 (n = 3), 250 mg/m2 (n = 6) or 400 mg/m2 (n = 6), CMAB009 reached peak serum concentrations at the end of the infusion and then declined slowly (Fig. 1). Serum concentrations of CMAB009 reached trough levels after 28 d for both of 250 mg/m2 group and 400 mg/m2 group. The measurable trough concentration at 100 mg/m2 dose level appeared approximately 15 days after administration. Mean AUC ranged from 2571.76 ± 626.07 to 23666.02 ± 3268.71 µg.h/mL across the 100 to 400 mg/m2 doses in a two-compartmental model (Table 4B) and from 2955.60 ± 571.57 to 28177.37 ± 5647.10 µg.h/mL in a non-compartmental model (Table 4A). Mean Cmax increased in a dose dependent manner and AUC0-∞ showed a greater than dose-proportionate increase (Fig. 2A and B).
Figure 1.
Mean concentration-time curve of CMAB009 after a single intravenous infusion of 100 mg/m2 (■, n = 3), 250 mg/m2 (●, n = 6), 400 mg/m2 (▴, n = 6). Data are expressed as mean ± SD.
Table 4A.
Single dose pharmacokinetic parameters of CMAB009: non-compartmental analysis
| Parameters (units) | CMAB009 dose (mg/m2) | ||
| 100 | 250 | 400 | |
| Ke (h−1) | 0.015 ± 0.002 | 0.009 ± 0.001 | 0.009 ± 0.002 |
| Tl/2ke (h) | 47.47 ± 6.61 | 78.42 ± 6.23 | 83.58 ± 15.86 |
| AUC0-t (µg.h/mL) | 2939.01 ± 569.47 | 15525.30 ± 4797.02 | 26615.95 ± 4827.53 |
| AUCt-∞ (µg.h/mL) | 16.59 ± 11.46 | 39.51 ± 23.46 | 1561.42 ± 1294.44 |
| AUC0-∞ (µg.h/mL) | 2955.60 ± 571.57 | 15564.81 ± 4812.12 | 28177.37 ± 5647.10 |
| AUC0-t % | 99.43 ± 0.35 | 99.76 ± 0.10 | 94.80 ± 3.77 |
| MRT (h) | 66.66 ± 3.98 | 124.43 ± 20.90 | 121.79 ± 22.24 |
| C//F (mL/h.m2) | 34.81 ± 7.55 | 17.63 ± 6.18 | 14.68 ± 2.93 |
| VSS (mL/m2) | 2300.28 ± 348.73 | 2116.88 ± 526.31 | 1745.34 ± 258.95 |
Table 4B.
Single dose pharmacokinetic parameters of CMAB009: two-compartmental analysis
| Parameters (units) | CMAB009 dose (mg/m2) | ||
| 100 | 250 | 400 | |
| Ke (h−1) | 0.009 ± 0.002 | 0.009 ± 0.001 | 0.008 ± 0.001 |
| Tl/2ke (h) | 77.15 ± 13.96 | 79.79 ± 6.91 | 86.25 ± 9.93 |
| AUC (µg.h/mL) | 2571.76 ± 626.07 | 13124.59 ± 3701.87 | 23666.02 ± 3268.71 |
| C//F (mL/h.m2) | 40.65 ± 10.92 | 20.28 ± 7.71 | 17.16 ± 2.23 |
| VSS (mL/ m2) | 2749.034 ± 363.56 | 2097.22 ± 518.63 | 2176.37 ± 627.10 |
Figure 2.
(A) Peak serum concentrations (Cmax, µg/mL) as a function of CMAB009 doses ranging from 100–400 mg/m2 (n = 15). ▴, individuals; △, mean. (B) Area under the serum-concentration time curve (AUC0-∞, µgh/mL) as a function of CMAB009 doses ranging from 100–400 mg/m2 (n = 15). ▴, individuals; △, mean. (C) Total body clearance based on body surface area as a function of CMAB009 doses ranging from 100–400 mg/m2 (n = 15). ▴, individuals; △, mean.
Mean terminal half-life (Tl/2ke) ranged from 77.15 ± 13.96 to 86.25 ± 9.93 h across the 100 to 400 mg/m2 doses in a two-compartmental model (Table 4B). In the non-compartmental model, mean terminal half-life (Tl/2ke) ranged from 47.47 ± 6.61 to 83.58 ± 15.86 h (Table 4A). A significant difference between the 100 mg/m2 and 250 mg/m2 groups (p = 0.00023, t test) was observed in the non-compartmental model, but there was no significant difference between the 250 mg/m2 and 400 mg/m2 groups (p > 0.05, t test). The short half-life estimates at 100 mg/m2 doses in the non-compartmental model may have been due to the lack of quantifiable concentrations in the terminal elimination phase at the lower dose.
Clearance as a function of dose is shown in Figure 2C. The mean total body clearance based on body surface area for CMAB009 was similar; the mean system clearance following doses of 250 mg/m2 and 400 mg/m2 were 17.63 ± 6.18 and 14.68 ± 2.93 mL/h·m2 (non-compartmental model), respectively. There was no significant difference between these two dose levels (p = 0.315, t test), but there was significant difference between 100 mg/m2 and 250 mg/m2 groups (p = 0.008, t test).
Mean estimates of the volume of distribution (Vd) based on body surface area ranged from 2300.28, 2116.88 to 1745.34 mL/m2 (non-compartmental model) across the dose range (100, 250 and 400 mg/m2 CMAB009), indicating that CMAB009 was confined primarily to the vascular system, which was consistent with results for endogenous IgG.
Multiple-dose pharmacokinetics of CMAB009.
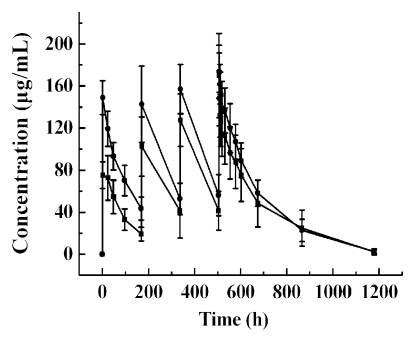
The mean serum concentration-time profiles of CMAB009 following multiple intravenous (iv) infusions of group A, dosed with 250 mg/m2 weekly and group B, initially dosed with 400 mg/m2, then 250 mg/m2 weekly, are shown in Figure 3. The PK parameters were summarized in Table 5A and B using a non-compartmental and a two-compartmental approach, respectively. A concentration of 88.46 µg/mL appeared to approach the estimated steady-state serum concentration after the fourth dose (day 22) in group A patients and 106.77 µg/mL in group B patients. The mean Cmax and Cmin concentrations at steady-state were 133.24 ± 41.47 µg/mL and 43.67 ± 21.58 µg/mL for group A and 157.76 ± 30.49 µg/mL and 55.77 ± 15.51 µg/mL for group B, respectively.
Figure 3.
Mean concentration-time curve of CMAB009 after multiple-dose intravenous infusion of group A (■, n = 7) and group B (●, n = 8). Data are expressed as mean ± SD.
Table 5A.
Multiple dose pharmacokinetic parameters of CMAB009: non-compartmental analysis
| Group | Patient no. | Kτ4 | t1/2 τ4 (h) | AUC (µg.h/mL) |
| Group A | 1 | 0.0002 | 117.5 | 8195 |
| 3 | 0.009 | 73.7 | 12491.4 | |
| 4 | 0.01 | 66.6 | 14695.1 | |
| 5 | 0.007 | 97.6 | 10235.8 | |
| 6 | 0.005 | 144.4 | 17344.8 | |
| 7 | 0.005 | 154 | 18525.7 | |
| 8 | 0.008 | 92.4 | 16665.3 | |
| Mean | 0.007 | 106.6 | 14021.9 | |
| SD | 0.002 | 33.5 | 3860 | |
| Group B | 9 | 0.006 | 111.8 | 20437.3 |
| 10 | 0.007 | 100.4 | 13282.8 | |
| 12 | 0.006 | 126 | 19749.6 | |
| 13 | 0.007 | 93.6 | 15195.2 | |
| 15 | 0.007 | 101.9 | 18265.3 | |
| 16 | 0.008 | 86.6 | 16779.3 | |
| 17 | 0.005 | 130.8 | 18685.3 | |
| 18 | 0.006 | 115.5 | 13372.5 | |
| Mean | 0.007 | 108.3 | 16970.9 | |
| SD | 0.0009 | 15.5 | 2779.8 |
Table 5B.
Multiple dose pharmacokinetic parameters of CMAB009: two-compartmental analysis
| Group | Patient no. | Kτ4 | t1/2 τ4 (h) | AUC (µg.h/mL) |
| Group A | 1 | 0.0002 | 82.36 | 18687.7 |
| 3 | 0.009 | 77.01 | 14768.4 | |
| 4 | 0.010 | 68.36 | 16406.02 | |
| 5 | 0.007 | 94.8 | 15727.48 | |
| 6 | 0.005 | 148.85 | 32430.11 | |
| 7 | 0.005 | 150 | 37070.36 | |
| 8 | 0.007 | 94.39 | 21604.26 | |
| Mean | 0.006 | 102.25 | 22384.90 | |
| SD | 0.003 | 33.54 | 8840.50 | |
| Group B | 9 | 0.0003 | 179.14 | 33055.41 |
| 10 | 0.007 | 101.97 | 20299.53 | |
| 12 | 0.005 | 127.37 | 34302.27 | |
| 13 | 0.007 | 94.48 | 21872.97 | |
| 15 | 0.007 | 106.46 | 26910.9 | |
| 16 | 0.008 | 86.63 | 23491.78 | |
| 17 | 0.001 | 129.22 | 32570.19 | |
| 18 | 0.001 | 126 | 21381.37 | |
| Mean | 0.007 | 118.91 | 26735.55 | |
| SD | 0.0009 | 29.12 | 5800.57 |
Human anti-chimeric antibody response.
Serum samples before each infusion and on day 8, 15 and 28 after the fourth infusion were tested for development of human anti-chimeric antibodies (HACAs) by antibody-bridge methods. A total of 105 serum samples obtained from 15 patients in the multiple-dose study were analyzed for the presence of antibodies to CMAB009. Only one of 15 (7%) of patients developed HACA levels above baseline, showing low titers of anti-drug antibodies (patient #3 in group A before the fourth dose and on days 8 and 15 after the fourth dose) that returned to baseline levels 28 days after the fourth administration. The presence of anti-CMAB009 anti-bodies was analyzed with the competitive inhibition assay and no neutralizing effect of serum was shown in the bioassay.
Clinical responses.
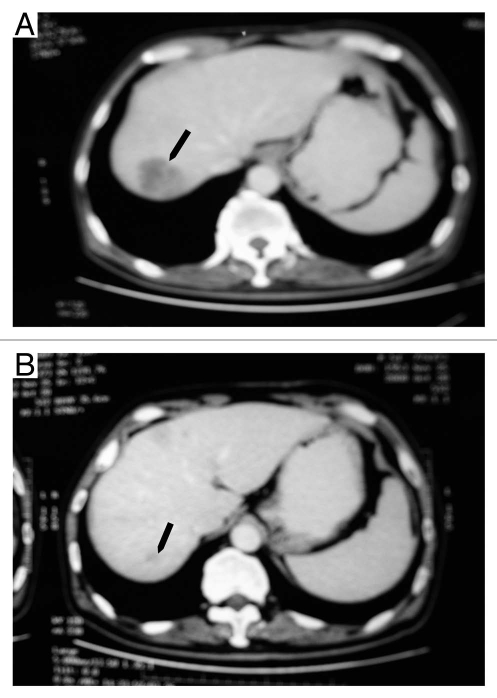
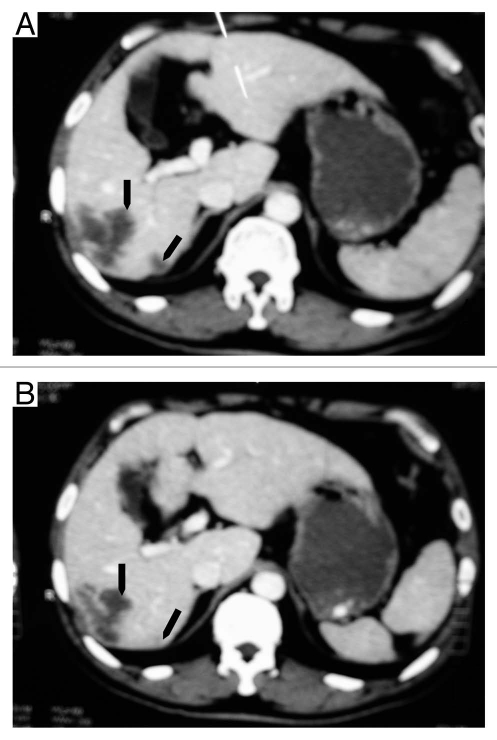
The study was not designed for evaluation of clinical responses; the goals were to determine the safety and explore PK characteristics of CMAB009 and to determine an appropriate treatment regimen for subsequent Phase 2 studies. Patients were nonetheless evaluated for therapeutic response during the study. Fifteen of the 18 patients treated in the extended-phase portion of the study were evaluated 28 days after the multiple CMAB009 infusions. Eight of the 15 assessable patients (53.3%) achieved stable disease (SD) and were eligible to receive additional doses of CMAB009 (five with colorectal tumors and three with non-small cell lung cancer). Two patients with colorectal tumors who were treated in the extension phase in group A and B, respectively, exhibited a partial response (PR) to therapy as defined by the response criteria described in Materials and Methods. The presence of a continued response at 4 weeks was confirmed by imaging studies. The two patients with partial response had been diagnosed with liver metastasis of colon carcinoma that included lesions at the right lobe. The patient (#5) in group A had a PR for 7 months (Fig. 6A and B), and the patient (#9) from group B had a PR for 4 months (Fig. 7A and B). Due to their good response to date, they both received beneficence weekly administration of CMAB009 for more than 20 weeks.
Figure 6.
CT images of a 64-year-old man (#5) with liver metastasis of colon carcinoma before treatment with CMAB009 (arrow in A) and 7 months later showing continuous marked response (arrow in B).
Figure 7.
CT images of a 54-year-old man (#9) with liver metastasis of colon carcinoma before treatment with CMAB009 (arrow in A) and 4 months later showing continuous marked response (arrow in B).
Discussion
In this Phase 1 clinical study, our goal was to investigate the safety and PK parameters of CMAB009 in Asian patients with advanced chemotherapy-resistant epithelial malignancies and to select a dose and schedule for additional Phase 2 studies. Safety studies of cetuximab concluded the mAb is well-tolerated, but just two of 111 patients in the cetuximab monotherapy group were Asian.12 This study was conducted in Chinese patients and the results showed that the CMAB009 treatment regimen we tested was well-tolerated and no significant neutralizing anti-chimeric antibodies were found. In this study, all planned dose levels were administered without reaching the MTD and there were no episodes of grade 3 or 4 AE. CMAB009 toxicity seemed to be unrelated to dose levels or number of doses. Previous studies of cetuximab reported that some patients experienced drug-related grade ≤3 toxicity, including rash, hypersensitivity reaction, hyperkinesias and aseptic meningitis.10,13 The lack of such AEs in this study may be due to the use of a different expression system and final product formulation for CMAB009. However, the number of dose groups and accumulative dose levels, as well as the number of individuals per dose level, limited the possibilities for evaluatation of CMAB009 toxicity, which should be evaluated in further Phase 2 and Phase 3 studies.
In previous reports, PK parameters of cetuximab were analyzed by non-compartment model,10,13 one-compartment model14 and two-compartment.11,15 However, a two-compartment model has previously been shown to be the best to describe the pharmacokinetics of IgG1 mAbs.11 In this study, CMAB009 was analyzed using a non-compartment model and a two compartment model. The PK parameters after non-compartmental and compartmental analysis were in good agreement except Tl/2ke of the lowest dose group. The short terminal half-life at 100 mg/m2 doses in the non-compartmental model may have been due to the lack of quantifiable concentrations in the terminal elimination phase at the lower dose.
Both compartmental analysis and non-compartmental analysis provided evidence that CMAB009 exhibited a non-linear PK profile over the dose range of 100–400 mg/m2. According to our data, as dose levels increased at a ratio of 1:2.5:4, the Cmax and AUC0-∞ increased at a ratio of 1:2.6:4.2 and 1:5.2:9.5, respectively. The Cmax increased in a roughly dose-proportional manner, but AUC0-∞ showed more than a dose-proportionate increase. Dose-dependent relationships were observed for Cl at lower doses, but these relationships were not observed at higher doses. This phenomenon may mirror the early studies and suggests that the receptor is saturated at the higher doses administered to these patients. In previous studies,11,13 dose-dependent antibody clearance was observed within the 20–100 mg/m2 dose range and complete saturation of drug clearance was achieved at doses within 200–400 mg/m2. In our single-dose escalation study, almost all PK parameters of the same dose level were consistent with those of the previous studies of centuximab.10,11 We therefore concluded that the expression system and formulation did not affect the PK parameters of CMAB009.
Panitumumab and cetuximab both target EGFR and are approved as treatments for metastatic colorectal cancer, but panitumumab is a human IgG2 mAb, while cetuximab is a chimeric IgG1 mAb. The products thus differ in their protein sequence source and isotype, and these differences may result in different bioactivities and different dose schedules for clinical utilities. Interestingly, clinical data suggest that the two mAbs have a similar nonlinear pharmacokinetic profile. Following a single 1 h infusion the area under the concentration-time curve (AUC) increased in a greater than dose-proportional manner, and clearance of panitumumab decreased from 30.6 to 4.6 ml/kg/day as the dose increased from 0.75 to 9 mg/kg. However, at doses above 2 mg/kg, the AUC of panitumumab increased in an approximately dose-proportional manner.16 The similar phenomenon of higher antibody doses resulting in reduced plasma clearance further supported saturation of extravascular clearance mechanisms at higher antibody doses. If this were the case, for any EGF receptor targeting mAbs, complete saturation of EGF receptor binding should be always accompanied by saturation of the antibody's systemic clearance.
The PK profile of CMAB009 following multiple iv infusions was consistent with that of the single-dose phase. Mean T1/2 values of the drug support weekly dosing. When the two multiple-dose groups were compared, group B tended to have a higher trough level than those in group A. Furthermore, there was no significant difference in the AEs between group B and group A. So, a loading dose of 400 mg/m2 and successive maintenance dose of 250 mg/m2 weekly is recommended in further clinical trials.
This Phase 1 study was not designed for analysis of clinical response to CMAB009, which probably would not be optimized until optimal serum levels were achieved and all tumor receptors were saturated. Nevertheless, the CMAB009 regimen administered in this study was associated with frequent stabilization of tumors, and tumor regression was observed in two patients with colorectal tumors. This has shown a promising prospect for tumor treatment and further clinical trials are warranted.
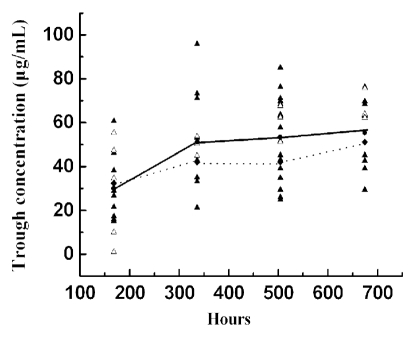
Observations were made with respect to the correlation of response with CMAB009 trough levels. Evaluation of CMAB009 trough levels and response revealed (Fig. 4), on average, patients with PR/SD response tended to have a higher trough level than those with progressive disease (PD), but the results were without statistical significance. Mean trough concentrations of CMAB009 were based on last-observation, suggesting that the trough level remained the same for individuals who withdrew from the study due to PD. Unexpected findings were most likely due to factors such as the limited numbers of evaluable patients and limited dosing regimen. Numerous studies of cetuximab in patients with various types of cancer, including colorectal tumors, have demonstrated a correlation between the incidence and severity of acne-like rash or skin reactions and efficacy.12,17–19 In this study, we observed that eight of 11 patients who experienced grades 1–2 skin rash achieved either an objective tumor response or a stable disease, and only three of 11 patients who experienced disease progression. On the other hand, one of seven patients without occurrence of rash achieved a tumor response, and six patients developed disease progression. It is of great interest to explore this point in detail, and we will evaluate this trend in future clinical studies.
Figure 4.
Trough levels of patients with PR/SD (▴) versus PD (△), where the lines represent the average trough levels based on last-observation-carryover-forward adjusted data.
Our Phase 1 study demonstrated that administration of CMAB009 was well-tolerated and the mAb exhibited non-linear PK profiles over a 100–400 mg/m2 dose range. The serum concentration of CMAB009 reached estimated steady state. Based on these findings, we recommended that CMAB009 should be studied as a treatment for patients with epithelial tumors at an initial dose of 400 mg/m2 followed by maintenance doses of 250 mg/m2 administered weekly. Pivotal Phase 2/3 clinical studies designed to evaluate the safety and efficacy of CMAB009 in more patients are ongoing.
Materials and Methods
CMAB009.
CMAB009 has the same amino acid sequence as cetuximab (C225, Erbitux; Merck KGaA). Cetuximab is produced in the NS0 myeloma cell line, while CMAB009 is produced in CHO cells. CMAB009 is produced as a secreted protein in large scale cultures grown in proprietary serum-free medium under controlled conditions. After clarification, the concentrated broth was purified through a series of chromatographic steps, vialed under asceptic conditions, and formulated as a pharmaceutical-grade product. The composition of CMAB009 and cetuximab are summarized in Supplemental Table 1. Compared to cetuximab's formulation, additional components of CMAB009 were included to improve stability.
Patient eligibility criteria.
Patients were eligible if they had a histological or cytological diagnosis of advanced epithelial malignancy, e.g., colorectal cancer, non-small-cell lung cancer (NSCLC), squamous cell carcinoma of the head and neck (SCCHN) and gastric and pancreatic cancer. Patients were required to be between 18 and 65 years of age, with a life expectancy ≥3 months, Eastern Cooperative Oncology Group performance of 0–2, white blood cell count >4,000/µl, hemoglobin >10.0 g/dl, a platelet count >100,000 µl, aspartate aminotransferase and alanine aminotransferase ≤1.25 times upper limit of normal and total bilirubin ≤1.25 times upper limit of normal. Women of childbearing potential were required to use an effective method of contraception. Written informed consents were obtained from all patients before they were entered into the study. Patients were excluded if they had a history of hypersensitivity with similar mAb therapy, prior surgery, chemotherapy or radiotherapy within four weeks of enrollment (six weeks for nitrosourea, mitomycin), or they also presented with severe internal disease.
The study was approved by the State Food and Drug Administration of China (Clinical trial approval number: 2007L02499) and the ethics committee of Cancer Institute and Hospital Chinese Academy of Medical Sciences (Beijing, China). The study was then conducted in the Cancer Hospital, Chinese Academy of Medical Sciences in accordance with the revised Declaration of Helsinki and Good Clinical Practice Requirements.
Study design.
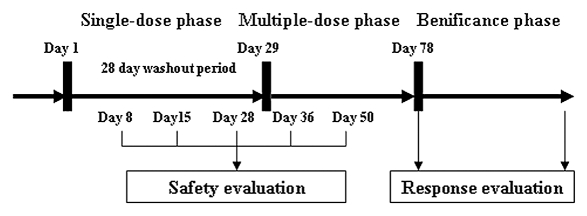
The study was designed as a single-center, open-label clinical trial to investigate the tolerability and PK properties of the test drug. This Phase 1 study had two phases of treatment: an open-label, randomized, single-dose phase followed by a weekly, multiple-dose safety and immunogenicity extension phase (Fig. 5). Patients were randomly assigned to receive one of three initial doses of CMAB009 ranging from 100, 250 and 400 mg/m2 for the purpose of single-dose PK evaluations. Three patients were enrolled in the 100 mg/m2 dose group, six patients in the 250 mg/m2 group and six patients in the 400 mg/m2 group.
Figure 5.
Study schema showing the administration of CMAB009.
Before and during the infusion, blood samples were drawn. Before each CMAB009 infusion, patients received an antihistamine as a preventive measure against hypersensitivity reactions (HSRs). CMAB009 was administered as a 2 h infusion on day 1 followed by a 28-day washout period to allow for characterization of PK end points over time. Starting on day 29, each patient received continuous weekly administrations of CMAB009 as a 2 h infusion at a fixed maintenance dose of 250 mg/m2 or an initial dose of 400 mg/m2 followed by maintenance dose of 250 mg/m2 weekly for 4 weeks. Patients who were evaluated as CR, PR or SD received beneficence medication until disease progression or unacceptable toxicity. Serum samples for trough CMAB009 concentration determinations were obtained.
Maximum-tolerated dose (MTD) criteria were based on the appearance of dose-limiting toxicity (DLT). DLT was defined as grade 3 or 4 toxicity at least possibly associated with CMAB009.
Evaluation of toxicity and assessment of response.
Adverse events were graded in accordance with the National Cancer Institute Common Toxicity Criteria version 2.0. At baseline, a history, physical examination, electrocardiogram, multiple-gated acquisition scan and laboratory tests, including a complete blood count with differential, electrolytes, biochemistry and urinalysis, were obtained. The latter was also repeated on day 8, 15 and 28 after medication administration for the single-dose study. In the multiple-dose part of the study, laboratory tests were collected on day 7 and 21 after the initial dose. Imaging of involved cancer areas were conducted four weeks after the whole administration. During the beneficence period, both the laboratory tests and imaging scans were performed every four weeks. Antitumor response was evaluated by physical examination and imaging pre-study and every four weeks until documented progressive disease (PD) or study withdrawal. Responses were defined by the RECIST criteria.20
Sample collection for pharmacokinetics and immunogen-icity assessments.
Blood samples were taken for determination of serum CMAB009 concentrations. In the single dose part of the study, blood samples were drawn before administration, 0 and 1 h after the infusion began and 0, 1, 3, 6, 12 and 24 h after the infusion ended; blood samples were also drawn 2, 3, 4, 8, 15 and 28 days after the infusion ended. In the multiple dose part of the study, blood samples for drug concentration detection were obtained before and immediately after every infusion and additional blood samples were collected at day 1, 2 and 4 after the first infusion, at 1, 3, 6, 12, 24 h and 2, 3, 4, 8, 15, 28 days after the last infusion. For each sample, serum was harvested by means of centrifugation (10,000 rpm, 10 min) from about 2 mL whole blood and stored for analysis at −20°C.
CMAB009 serum level assay.
Serum levels of CMAB009 were tested using competition assays by flow cytometric analysis, which was performed on a FACScan (Becton Dickinson). The EGFR-positive A431 cells were incubated with a subsaturation concentration of fluorescein isothiocyanate-labeled antibody and serial dilutions of the competitive unlabeled antibody. The mixture was brought to a final incubation volume of PBS containing 1% neonatal bovine serum (NBS). Competition among antibodies for binding to A431 cells was assayed by flow cytometry, then quantification of the unlabeled antibody. CMAB009 serum concentration in each sample was calculated through the standard curve. The following equation established from a for parameter logistic model was used as follows:
where X represents the concentration of CMAB009 in the samples, Y represents the geometric mean of the fluorescence intensity (FI), P represents the slope of the logit-log plot, the FI reduction rate followed by the concentration, X0 represents the half-maximal effective concentration (EC50) and A1 and A2 were the maximal and minimal fluorescence intensity, respectively. The calculated value of each sample was required to be within the range of the standard curve.
To determine anti-drug antibody in the serum samples, the antibody-bridge method was used. When the samples were positive, neutralizing anti-drug antibody would subsequently be detected by competitive enzyme-linked immunosorbent assay (ELISA) method.
Data analysis.
The PK parameters were determined by non-compartmental analysis using the DAS 2.1 software (Wannan Medical College, WuHu, China) and by two-compartmental analysis, using the Practical Pharmacokinetics Program 3p97 (Version 97; Chinese Pharmacological Association, Beijing, China). Terminal elimination half-life (Tl/2), elimination rate constant (Ke), mean residence time (MRT), clearance rate (Cl) and apparent volumes of distribution (Vss) were obtained through these software programs. The area under the concentration-time curve (AUC) was calculated using the statistic moment theory.
Ct is the concentration gained from the last time point.
Maximum serum concentration values (Cmax) and the corresponding time (Tmax) were defined as observed. Continuous data were presented as mean ± SD, median or range and categorical data were presented as counts or percentage. The serum concentrations of CMAB009 were summarized for patients belonging to the same dose group at each time-point.
Statistical methods.
Descriptive analyses on patient characteristics, toxicities and responses have been performed. Demographic data, consisting of gender, age, weight, BSA, ECOG were summarized using descriptive statistics. Statistical analysis was performed with a standard computerized statistical program, SPSS 13.0 for Windows software (SPSS, Inc., Chicago, IL). All grouped data were expressed as means ± SD. For data among at least three groups, analysis of variance (ANOVA) was applied to test differences of data on normal distribution and the Kruskal-Wallis test (K-W H test) was used when the data were not normally distributed. For a difference between two groups, the t-test was employed when the data were of normal distribution and variance was homogenous; otherwise, the Wilcoxon test was used. Shapiro-Wilks W test is used for assessing normality. We evaluated the homogeneity of variance by Levene's test. The p value <0.05 was considered statistically significant.
Acknowledgements
This work was supported by grants from National Natural Science Foundation of China, Ministry of Science & Technology of China (973 & 863 program projects), National Key projects for New Drug Development and Manufacture, Shanghai Commission of Science & Technology and Shanghai Leading Academic Discipline Project (B905).
Abbreviations
- AUC
area under the concentration-time curve
- Cl
clearance
- Cmax
maximum serum concentration
- CV
coefficient of variation
- PK
pharmacokinetics
- T1/2
terminal half-life
- Vd
volume of distribution
- CR
complete response
- PD
progressive disease
- PR
partial response
- SD
stable disease
- ECOG
Eastern Cooperative Oncology Group
- BSA
body surface area
- RECIST
response evaluation criteria in solid tumors
Supplementary Material
References
- 1.Carpenter G. Receptors for epidermal growth factor and other polypeptide mitogens. Annu Rev Biochem. 1987;56:881–914. doi: 10.1146/annurev.bi.56.070187.004313. [DOI] [PubMed] [Google Scholar]
- 2.Carpenter G, Cohen S. Epidermal growth factor. J Biol Chem. 1990;265:7709–7712. [PubMed] [Google Scholar]
- 3.Sato JD, Kawamoto T, Le AD, Mendelsohn J, Polikoff J, Sato GH. Biological effect in vitro of monoclonal antibodies to human epidermal growth factor receptors. Mol Biol Med. 1983;1:511–529. [PubMed] [Google Scholar]
- 4.Kawamoto T, Sato JD, Le A, Polikoff J, Sato GH, Mendelsohn J. Growth stimulation of A431 cells by epidermal growth factor: identification of high-affinity receptors for epidermal growth factor by an anti-receptor monoclonal antibody. Proc Natl Acad Sci USA. 1983;80:1337–1341. doi: 10.1073/pnas.80.5.1337. [DOI] [PMC free article] [PubMed] [Google Scholar]
- 5.Gill GN, Kawamoto T, Cochet C, Le A, Sato JD, Masui H, et al. Monoclonal anti-epidermal growth factor receptor antibodies which are inhibitors of epidermal growth factor binding and antagonists of epidermal growth factor-stimulated tyrosine protein kinase activity. J Biol Chem. 1984;259:7755–7760. [PubMed] [Google Scholar]
- 6.Mendelsohn J, Baselga J. Status of epidermal growth factor receptor antagonists in the biology and treatment of cancer. J Clin Oncol. 2003;21:2787–2799. doi: 10.1200/JCO.2003.01.504. [DOI] [PubMed] [Google Scholar]
- 7.Salomon DS, Brandt R, Ciardiello F, Normanno N. Epidermal growth factor-related peptides and their receptors in human malignancies. Crit Rev Oncol Hematol. 1995;19:183–232. doi: 10.1016/1040-8428(94)00144-i. [DOI] [PubMed] [Google Scholar]
- 8.Harding J, Burtness B. Cetuximab: an epidermal growth factor receptor chemeric human-murine monoclonal antibody. Drugs Today. 2005;41:107–127. doi: 10.1358/dot.2005.41.2.882662. [DOI] [PubMed] [Google Scholar]
- 9.Kurai J, Chikumi H, Hashimoto K, Yamaguchi K, Yamasaki A, Sako T, et al. Antibody-dependent cellular cytotoxicity mediated by cetuximab against lung cancer cell lines. Clin Cancer Res. 2007;13:1552–1561. doi: 10.1158/1078-0432.CCR-06-1726. [DOI] [PubMed] [Google Scholar]
- 10.Tan AR, Moore DF, Hidalgo M, Doroshow JH, Poplin EA, Goodin S, et al. Pharmacokinetics of cetuximab after administration of escalating single dosing and weekly fixed dosing in patients with solid tumors. Clin Cancer Res. 2006;12:6517–6522. doi: 10.1158/1078-0432.CCR-06-0705. [DOI] [PubMed] [Google Scholar]
- 11.Fracasso PM, Burris H, 3rd, Arquette MA, Govindan R, Gao F, Wright LP, et al. A phase I escalating single-dose and weekly fixed-dose study of cetuximab: pharmacokinetic and pharmacodynamic rationale for dosing. Clin Cancer Res. 2007;13:986–993. doi: 10.1158/1078-0432.CCR-06-1542. [DOI] [PubMed] [Google Scholar]
- 12.Cunningham D, Humblet Y, Siena S, Khayat D, Bleiberg H, Santoro A, et al. Cetuximab monotherapy and cetuximab plus irinotecan in irinotecan-refractory metastatic colorectal cancer. N Engl J Med. 2004;351:337–345. doi: 10.1056/NEJMoa033025. [DOI] [PubMed] [Google Scholar]
- 13.Baselga J, Pfister D, Cooper MR, Cohen R, Burtness B, Bos M, et al. Phase I studies of anti-epidermal growth factor receptor chimeric antibody C225 alone and in combination with cisplatin. J Clin Oncol. 2000;18:904–914. doi: 10.1200/JCO.2000.18.4.904. [DOI] [PubMed] [Google Scholar]
- 14.Delbaldo C, Pierga JY, Dieras V, Faivre S, Laurence V, Vedovato JC, et al. Pharmacokinetic profile of cetuximab (Erbitux) alone and in combination with irinotecan in patients with advanced EGFR positive adenocarcinoma. Eur J Cancer. 2005;41:1739–1745. doi: 10.1016/j.ejca.2005.04.029. [DOI] [PubMed] [Google Scholar]
- 15.Dirks NL, Nolting A, Kovar A, Meibohm B. Population pharmacokinetics of cetuximab in patients with squamous cell carcinoma of the head and neck. J Clin Pharmacol. 2008;48:267–278. doi: 10.1177/0091270007313393. [DOI] [PubMed] [Google Scholar]
- 16.Giusti RM, Shastri KA, Cohen MH, Keegan P, Pazdur R. FDA drug approval summary: Panitumumab (Vectibix) The Oncologist. 2007;12:577–583. doi: 10.1634/theoncologist.12-5-577. [DOI] [PubMed] [Google Scholar]
- 17.Saltz LB, Meropol NJ, Loehrer PJ, Sr, Needle MN, Kopit J, Mayer RJ. Phase II trial of cetuximab in patients with refractory colorectal cancer that expresses the epidermal growth factor receptor. J Clin Oncol. 2004;22:1201–1208. doi: 10.1200/JCO.2004.10.182. [DOI] [PubMed] [Google Scholar]
- 18.Herbst RS, Arquette M, Shin DM, Dicke K, Vokes EE, Azarnia N, et al. Phase II multicenter study of the epidermal growth factor receptor antibody cetuximab and cisplatin for recurrent and refractory squamous cell carcinoma of the head and neck. J Clin Oncol. 2005;23:5578–5587. doi: 10.1200/JCO.2005.07.120. [DOI] [PubMed] [Google Scholar]
- 19.Xiong HQ, Rosenberg A, LoBuglio A, Schmidt W, Wolff RA, Deutsch J, et al. Cetuximab, a monoclonal antibody targeting the epidermal growth factor receptor, in combination with gemcitabine for advanced pancreatic cancer: a multicenter phase II trial. J Clin Oncol. 2004;22:2610–2616. doi: 10.1200/JCO.2004.12.040. [DOI] [PubMed] [Google Scholar]
- 20.Therasse P, Arbuck SG, Eisenhauer EA, Wanders J, Kaplan RS, Rubinstein L, et al. New guidelines to evaluate the response to treatment in solid tumors. J Natl Cancer Inst. 2000;92:205–216. doi: 10.1093/jnci/92.3.205. [DOI] [PubMed] [Google Scholar]
Associated Data
This section collects any data citations, data availability statements, or supplementary materials included in this article.


