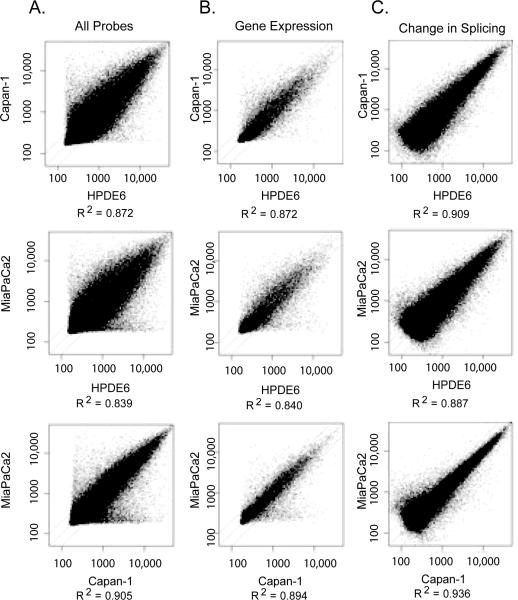
Figure 1. Variation in RNA transcripts found in pancreatic cancer cell lines reflecting varied degrees of differentiation.
A) Shown are expression levels for all of the probes found on the splicing array, with signal intensities plotted along X- and Y-axes. The `wings' along the axes correspond to probes specific for genes and spliceoforms that were turned on or off in nearly a binary fashion. B) Shown are relative levels of gene expression observed in pancreatic cancer cell lines. C) Shown are relative levels of expression of spliceoforms observed in the pancreatic cancer cell lines after normalizing the data for levels of gene expression.

