Abstract
A ternary surface monolayer, consisting of co-assembled thiolated capture probe (SHCP) mercaptohexanol (MCH) and dithiothreitol (DTT), is shown to offer dramatic improvements in the signal-to-noise characteristics of electrochemical DNA hybridization biosensors based on common self-assembled monolayers (SAMs). Remarkably low detection limits down to 40 zmole (in 4 μL samples) as well as only 1 CFU E. coli per sensor are thus obtained without any additional amplification step in connection to the commonly used horseradish peroxidase/3,3′,5,5′-tetramethylbenzidine (HRP/TMB) system. Such dramatic improvements in the detection limits (compared to common binary alkanethiol interfaces and to most electrochemical DNA sensing strategies without target or signal amplification) are attributed primarily to the remarkably higher resistance to non-specific adsorption. This reflects the highly compact layer (with lower pinhole density) produced by the coupling of the cyclic- and linear-configuration ‘backfillers’ that leads to a remarkably low background noise even in the presence of complex sample matrices. A wide range of surface compositions have been investigated and the ternary mixed monolayer has been systematically optimized. Detailed impedance spectroscopy and cyclic voltammetric studies shed useful insights into the surface coverage. The impressive sensitivity and high specificity of the simple developed methodology indicate great promise for a wide range of nucleic acid testing, including clinical diagnostics, biothreat detection, food safety and forensic analysis.
1. Introduction
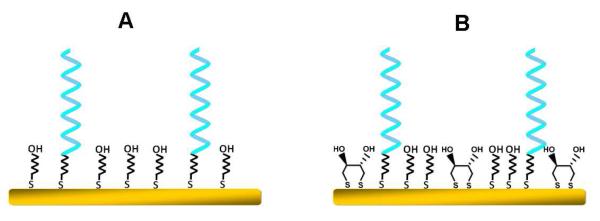
Electrochemical DNA biosensors are of considerable interest due to their ability to obtain sequence-specific information in a sensitive, simple, inexpensive and portable manner,1-3 making them particularly attractive for decentralized genetic testing. Surface chemistry plays a major role in the overall performance of electrochemical DNA biosensors. In particular, control of the surface chemistry and coverage is essential for assuring high reactivity, orientation/accessibility, and stability of the surface-bound probe, while avoiding non-specific adsorption and related background contributions. Several useful schemes for attaching nucleic acid probes onto electrode surfaces and controlling the surface chemistry have thus been developed.4-11 Alkanethiol self-assembly monolayer (SAM) methods have been particularly useful for preparing reproducible probe-modified surfaces with high hybridization efficiency.12 Most often, two-component SAM monolayers of thiol-derivatized single-stranded oligonucleotide probe (SHCP) and a short-chain 6-mercapto-1-hexanol (MCH) are used.12-14 Such mixed binary SAM route (Figure 1A) ensures that the thiolated oligonucleotide probe “stands up” and extends toward the solution while minimizing non-specific adsorption (through the MCH polar OH head group). However, recent studies have indicated that such two-component SHCP+MCH monolayers still display non-specific background contributions due to incomplete backfilling and related surface defects, and may lead to erroneous readings and low reproducibility.13-15 In addition, the MCH ‘backfiller’ is not sufficiently protein-resistant.16 Other SAM routes based on the co-immobilization of oligo(ethylene glycol) (OEG)-terminated thiols and SHCP have demonstrated effective minimization of non-specific adsorption and lower detection limits down to pM level.16-18 Moreover, Henry et al19 reported recently on the electrochemical characterization and performance of efficient binary self-assembled monolayers prepared by co-immobilization of PEGylated ssDNA and MCH on gold electrodes offering a detection limit of 6.25 nM. The introduction of a third ‘backfiller’ component 3-mercaptopropionic acid (MPA), bearing a carboxylic acid group, in a lengthy three-step process, has been suggested recently for enhancing the performance of electrochemical genosensors, enabling the detection of 10 pM target DNA.17,18 Further improvements in the backfilling of common SAM layers and minimization of surface defects are thus essential for enhancing the sensitivity of electrochemical DNA biosensors.
Figure 1.
Schematic illustration of the (A) conventional binary SHCP+MCH and (B) new ternary SHCP/DTT+MCH monolayers. (Note that these are schematic simplified presentations and do not represent the exact structure of these monolayers).
Here we illustrate the rational design of a ternary SAM assembly that dramatically improves the signal-to-noise characteristics and hence greatly lowers the detection limits of common SAM-based electrochemical DNA hybridization biosensors. In particular, we will demonstrate below that a ternary surface monolayer, prepared by a one-step co-immobilization of SHCP and the α,ω-alkanedithiol dithiothreitol (DTT), followed by the assembly of MCH (Figure 1B), performs considerably better than the conventional binary SHCP+MCH surface assemblies and other recently reported surface monolayers. Such improvements reflect the reduction in pinhole defects in the monolayer and the OH-richer hydrophilic environment that leads to a greater resistance to non-specific adsorption, and hence to minimization of related background contributions. Extremely low zeptomole detection limits of DNA target (10 fM), as well as for E. coli pathogenic bacteria (1 CFU per sensor), can thus be obtained in a reproducible manner, along with high specificity (vs. both biological and non-biological controls), without any deliberate signal amplification in connection to the commonly used horseradish peroxidase (HRP) tag and its 3,3′,5,5′-tetramethylbenzidine (TMB) cosubstrate.20,21 Such impressive detection limit for an electrochemical DNA biosensor is achieved without any target or signal amplification, emphasizing the crucial role of the surface chemistry in minimizing background contributions and measuring ultralow levels of nucleic acids. To the best of our knowledge, this is the lowest detection limit we are aware of for an electrochemical DNA biosensor based on a SAM. In the following sections we will report on the systematic optimization and detailed characterization of such ternary SHCP/DTT+MCH interfaces, and on the attractive analytical performance of the resulting electrochemical DNA biosensor, along with, a critical comparison to HRP-based DNA biosensors based on different binary and ternary SAMs involving diverse ‘backfillers’. Such assessment of the structure-function correlation leads to improved understanding of the role of the surface environment upon the sensor performance and to a rational assembly of the new ternary interface.
EXPERIMENTAL SECTION
Materials
DTT, MCH, MPA, trizma hydrochloride (Tris-HCl), ethylenediaminetetraacetic acid, human serum (from human male AB plasma) and bovine serum albumin were obtained from Sigma-Aldrich (St. Louis, MO) and used without further purification. Ethylene glycol-terminated thiol (HS-(CH2)11-EG2-OH, OEG) was purchased from Prochimia (Poland). The blocking agent casein was obtained from Pierce (Rockford). Anti-fluorescein horseradish peroxidase (Anti-FITC-HRP) Fab fragments was purchased from Roche (Mannheim, Germany) and TMB solution was purchased from Neogen (Lexington, KY) in a ready-to-use reagent format (K-Blue enhanced-activity substrate, containing also H2O2). A solution of K3Fe(CN)6 and K4Fe(CN)6 (Sigma-Aldrich, St. Louis, MO), 5 mM in each component, prepared in 0.1 M KCl, was used for electrochemical impedance spectroscopy (EIS) and cyclic voltammetry (CV) measurements.
All synthetic oligonucleotides used were purchased from Thermo Fisher Scientific (Ulm, Germany) and are listed in Table S-1 of the Supporting Information. Bacterial strains of E. coli NEB 5-α (New England Biolabs) and clinical isolate K. pneumoniae (KP210) were obtained from the University of California-Los Angeles (UCLA), Clinical Microbiology Laboratory, with approval from the UCLA and Veterans’ Affairs institutional review boards and appropriate Health Insurance Portability and Accountability Act exemptions. The isolates were received in centrifuge tubes and were stored at −80 °C until use. Overnight bacterial cultures were freshly inoculated into Luria broth (LB) and grown to logarithmic phase as measured by the optical density at 600 nm. Concentrations in the logarithmic-phase specimens were determined by serial plating.
The buffer solutions used in this study were as follows: The DNA immobilization buffer (IB) contained 10 mM Tris-HCl, 1 mM ethylenediaminetetraacetic acid, and 0.3 M NaCl (pH 8.0). The hybridization buffer (HB) was a 1 M phosphate buffer solution containing 2.5% bovine serum albumin (pH 7.2). The binding buffer (BB) for associating with Anti-FITC-HRP was 1×PBS (pH 7.2) containing 0.5% casein.
Apparatus
Amperometric measurements were performed using a PalmSens hand-held potentiostat equipped with an 8-channel PalmSens Multiplexer (CH8) (Palm Instruments BV, Electrochemical Sensor Interfaces, Netherlands). A 16-sensor Au electrode array, used for the DNA hybridization experiment, was purchased from GeneFluidics Inc. (Monterey Park, CA). Each sensor consisted of a central Au working electrode (2.5 mm diam.) surrounded by a quasi Au reference electrode and an Au auxiliary electrode. An electrochemical analyzer (CHI 660D, CH Instruments, Austin, TX) was used for the EIS and CV experiments, in connection to a conventional Au disk working electrodes (AuEs, φ = 2 mm), an Ag/AgCl reference electrode and a Pt wire auxiliary electrode. A previously described pretreatment procedure22 was applied to clean the AuE.
Preparation of the capture probe modified gold surface
Appropriate concentrations of the SHCP in IB, with and without 200 μM freshly prepared DTT (also in IB buffer), were prepared and allowed to stand for 10 min. Six μL aliquots of this SHCP/DTT solution were drop cast to cover each Au working electrode in the 16-sensor Au array, and were incubated overnight at 4 °C in a humidified surrounding. After washing with water and drying with nitrogen, the SHCP/DTT SAM-modified Au sensors were subsequently treated with 6 μL of either 1 mM MCH, OEG or MPA aqueous solution (in IB buffer) for 50 min to obtain different mixed SAMs. Finally, the sensors were thoroughly rinsed with water and dried under nitrogen.
EIS and CV measurements
Faradaic impedimetric and CV measurements were carried out in a 0.1 M KCl solution containing the [Fe(CN)6]3–/4– redox probe (5 mM of each component). Impedance spectra were performed over the frequency range of 0.01 to 10,000 Hz at +0.25 V (vs. Ag/AgCl). The amplitude of the alternating voltage was 0.01 V. Experimental spectra, presented in the form of complex plane diagrams (i.e., Nyquist plots), were analysed by non-linear least squares (NLLS) using the EQUIVCTR.PAS (EQU) program by Boukamp.23 The impedance Z is expressed in term of a real (Z’) and an imaginary (Z”) component.
DNA hybridization assay
The DNA detection protocol involved a sandwich-type hybridization assay and the capture of the HRP enzyme tag. Different concentrations of the DNA target were mixed with the FITC-DP (0.25 μM) in the HB. Aliquots (4 μL) of this target/FITC-DP hybrid solution were cast on each of the SHCP-modified gold sensors and were incubated for 15 min. After the array was washed and dried, 4 μL of a 0.5 U mL−1 Anti-FITC-HRP solution (prepared in BB) was cast on each of the working electrodes for 15 min. Subsequently, the array was washed and dried, and a prefabricated plastic 16-well manifold (GeneFluidics, Monterey Park, CA) was bonded to the sensor array. The sensor array was connected to the 8-channel PalmSens Multiplexer, and 50 μL of the TMB–H2O2 K-Blue reagent solution was placed sequentially on each of the sensors in the array, covering the three electrodes area. Chronoamperometric detection was performed sequentially for all 16 sensors after placing each TMB–H2O2 drop on the corresponding sensor, stepping the potential to −200 mV (vs. the gold reference electrode), and sampling the current at 60 s.
Bacterial 16S rRNA hybridization assay
The bacteria were lysed by resuspension of the appropriate pellet containing ~107 CFU bacteria in 10 μL of 1 M NaOH and incubation for 5 min.24,25 A 50 μL aliquot of FITC-DP (0.25 μM) in HB was added to this 10 μL bacterial lysate, leading to genetic material corresponding to ~107 CFU per 60 μL. This solution was serially diluted in the FITC-DP (0.25 μM) to provide different concentrations of bacterial genetic material (16S rRNA).
Aliquots (4 μL) of this raw bacterial-lysate target solution were cast on each capture-probe modified sensor and incubated for 15 min, followed by the same capture of Anti-FITC-HRP and the electrochemical detection steps, described earlier for the synthetic target DNA. All procedures were carried out at room temperature.
RESULTS AND DISCUSSION
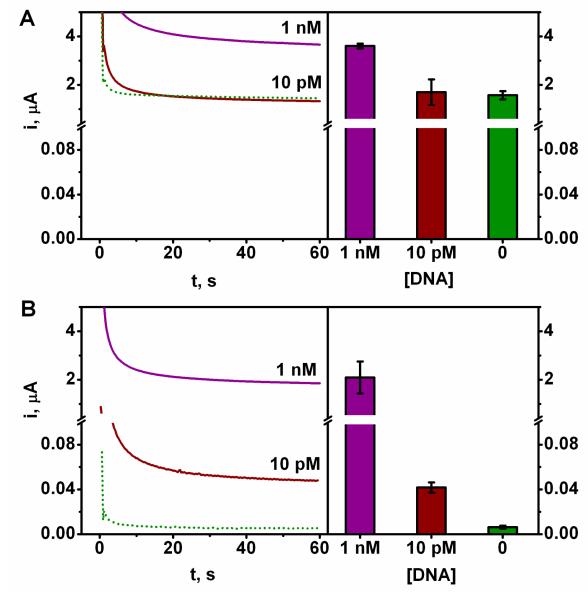
All testing and characterization were conducted in connection to the widely used sandwich hybridization amperometric biosensing involving the HRP enzyme tag and its TMB cosubstrate.20,21 Figure 2 compares the DNA hybridization chronoamperometric responses for target concentrations of 10 pM and 1 nM at the widely used SHCP+MCH binary interface (A) with those observed at the new ternary SHCP/DTT+MCH layer (B). These data clearly demonstrate that the new ternary layer offers a dramatically lower non-specific background contribution (dotted line), along with similar signals, and hence leading to a substantially higher signal-to-noise (S/N). (Note the change in the current scales.) For example, a 260-fold decrease in the background current (6 nA vs. 1,569 nA) is observed at the new ternary interface. Overall, the ternary monolayer leads to about 100-fold improvements in the S/N characteristics. As a result, the new interface offers convenient detection of the 10 pM target DNA as compared to the conventional binary layer assembly where such picomolar detection is not possible. On the basis of these dramatic improvements in the S/N characteristics we examined different ternary SAM interfaces and systematically optimized the structure of the ternary (SHCP/DTT+MCH) platform for the sequence-specific nucleic acid detection. As will be illustrated below, such optimization led to ultrasensitive DNA hybridization assays with fM (zeptomole) detection limits.
Figure 2.
Comparative hybridization discrimination effects at 2 different concentrations of target DNA on (A) the binary EC SHCP+MCH and (B) the ternary EC SHCP/DTT+MCH interfaces. Dotted line: non-specific background contribution as determined in negative control experiments in the absence of target EC DNA. Error bars estimated from five parallel experiments. (Note the change in the current scales)
Comparison of Different Interfaces and Design of the DTT-based Ternary SAM
Initial experiments involved the design and evaluation of different binary and ternary SAM layers towards understanding the influence of different ‘backfillers’ (MCH, MPA, DTT and OEG) upon the hybridization efficiency and the minimization of the background noise, and hence upon the overall S/N characteristics of the corresponding DNA electrochemical sensors. Such critical assessment of various mixed SAM assemblies led to an optimal design of remarkably sensitive genosensors based on a ternary SHCP/DTT+MCH interface, characterized by an excellent resistance to non-specific background contributions and a very high hybridization efficiency.
Different binary and multi-component ternary layers prepared with the different ‘backfillers’ were examined first in connection to both one-step co-assembly and two-step sequential assembly processes in connection to the enzyme-based sandwich hybridization amperometric assay. Table 1 displays the signal-to-noise characteristics of these different SAM interfaces for hybridization assays of 1 nM target DNA. As can be observed, the hybridization efficiency on a pure SHCP layer is extremely low (indicated from its very low signal) which is in agreement with earlier results by Boozer et al.16 According to Tarlov et al.,26 the introduction of a ‘dilution’ molecule, like MCH, leads to a configuration favoring the DNA hybridization. The ‘dilution’ molecule not only helps the DNA oligonucleotide probe to ‘stand up’ but also repels non-specific adsorption of the HRP tag on the surface by its negative OH head groups.26
Table 1.
Comparison of hybridization discrimination effects at different SAMs (prepared with EC SHCP) upon the S/N ratio obtained for 1 nM target EC DNA using HRP/TMB system.
| Monolayer composition | S | N | S/N | |
|---|---|---|---|---|
|
| ||||
| Monocomponent | SHCP | 203.6 | 110.2 | 1.8 |
| Binary | SHCP+MCH | 3600.1 | 1,569 | 2.3 |
| SHCP+OEG | 151 | 3.4 | 44.4 | |
| SHCP+MPA | 1487.8 | 27.3 | 54.5 | |
| SHCP/MCH | 1043 | 549 | 1.9 | |
| SHCP/DTT | 2904 | 52.8 | 55.0 | |
|
| ||||
| Ternary | SHCP/DTT+MCH | 1963.2 | 6.0 | 327.2 |
| SHCP/DTT+OEG | 2355.4 | 5.6 | 420.6 | |
| SHCP/DTT+MPA | 1466.6 | 8.3 | 176.7 | |
| SHCP/MPA + MCH | 1514.7 | 10.6 | 142.9 | |
| SHCP+DTT+MCH | 1452.4 | 8.4 | 172.9 | |
| SHCP+MPA+MCH | 531.8 | 6.8 | 78.2 | |
|
| ||||
| Quaternary | SHCP/DTT+MPA+MCH | 2270 | 6.4 | 354.7 |
* A/B: Simultaneous co-immobilization of A and B
* A+B: Sequential immobilization of A and B
See Experimental Section for other details.
Interestingly, the performance of the common binary (SHCP+MCH) surface could be dramatically improved by the introduction of a DTT ‘backfiller’. For example, the ternary SHCP/DTT+MCH surface offers a S/N of 327 for 1 nM DNA, which is ~140 and 6-fold higher than the SHCP+MCH and SHCP/DTT surfaces, respectively. Similarly, the SHCP/DTT+OEG surface provides a S/N of 421 for 1 nM DNA, which is ~10 times higher than binary SHCP+OEG and SHCP/DTT surfaces. Such attractive performance of the DTT-based ternary SAM is attributed to the coupling of cyclic- and linear-configuration ‘backfillers’, which overcomes the incomplete backfilling and related surface defects observed commonly in the binary SAM.13-15 The formation of the compact and complete surface by ternary SAM is also indicated by further comparison with a quaternary SAM surface. As shown in Table 1, a quaternary SAM (SHCP/DTT+MPA+MCH) interface provides a S/N of 355 for 1 nM target DNA, which is similar to the 327 value observed at the corresponding ternary SAM (SHCP/DTT+MCH) layer, indicating no further improvement from the additional ‘backfiller’. Note also that the exact preparation of the ternary SAM also affects the surface performance. As shown in Table 1, the SHCP+DTT+MCH surface, in which SHCP, DTT and MCH were assembled sequentially, provides a S/N of 173 for 1 nM target DNA. This S/N is nearly half of that (327) observed at the SHCP/DTT+MCH surface, where a co-immobilization strategy is used instead of the sequential assembly of SHCP and DTT. These results indicate that the co-immobilization route leads to improved performance compared to the sequential assembly.
The differential discrimination effects observed for interfaces could be related to the nature of the diluent interactions (hydrophobic and/or hydrophilic) along with differences in the SHCP coverage while forming either compact or defective mixed monolayers, as well as to the different chain lengths and head group functionalities. For example, compared to the MCH diluent, the high hydrophobicity of the MPA (−COO- head group with pKa ~ 5.2 at pH 7.4) could effectively orient the SHCP molecules in a perpendicular configuration, leading to a 20 % increased discrimination effect (Table 1).17 These results clearly demonstrate the crucial role of DTT, co-immobilized with SHCP, to assemble the capture probe with sufficient spacing for optimal hybridization and towards the creation of a highly compact SAM with minimal surface defects. The impedance spectroscopy data, described below, further support this conclusion. DTT is known to chemisorb onto gold surface via two Au-S bonds (with no free thiol), with the two hydroxyl groups exposed at the outer surface (e.g., Figure 1B),27,28 providing a hydrophilic microenvironment favorable for the hybridization that also enhances the non-fouling properties of the new monolayer.
Optimization of the co-assembled DTT/SHCP SAM
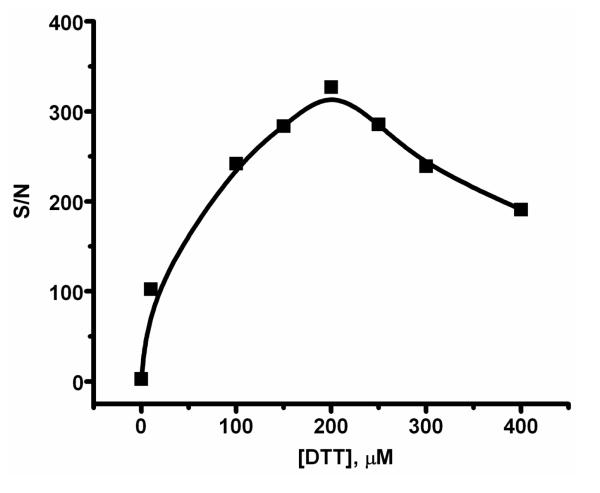
In the present work, the thiolated capture probe was assembled onto the surface by a co-immobilization step with DTT, leading to competition with DTT for the exposed gold surface. Thus, both the surface coverage and the spacing of the SHCP are dependent upon this competition. As indicated from Figure 3, at low concentration DTT cannot compete effectively with the probe, leading to the non-specific adsorption and to an inferior performance. With the increase of DTT concentration, more DTT molecules assemble on the surface, efficiently increasing the surface compactness and improving the probe spacing and resistance to non-specific adsorption, resulting in a greatly improved signal-to-noise ratio. However, increasing the DTT concentration above 200 μM leads to gradually reduced performance as DTT begins to dominate the surface, and the coverage of the thiolated capture probe decreases. Concentration-dependent reorientation of DTT may also take place and partially account for the trend observed in Figure 3. Optimal behavior is thus observed at a DTT concentration of 200 μM in connection with 0.05 μM SHCP, along with 1 mM MCH. Apparently, these concentrations provide the most favorable tradeoff between the surface compactness (induced by DTT) and hybridization efficiency (determined by the SHCP coverage). It should be pointed out that such optimal (submicromolar) level of SHCP (the presence of DTT) is substantially lower than the 1-10 μM level common with binary SHCP+MCH SAM.8,14
Figure 3.
Effect of the DTT concentration in the ternary EC SHCP/DTT+MCH monolayer upon the signal-to-noise ratio obtained for a 1 nM target DNA (using 0.05 μM of EC SHCP). See experimental Section for details.
Electrochemical Characterization of DTT-based Ternary SAM
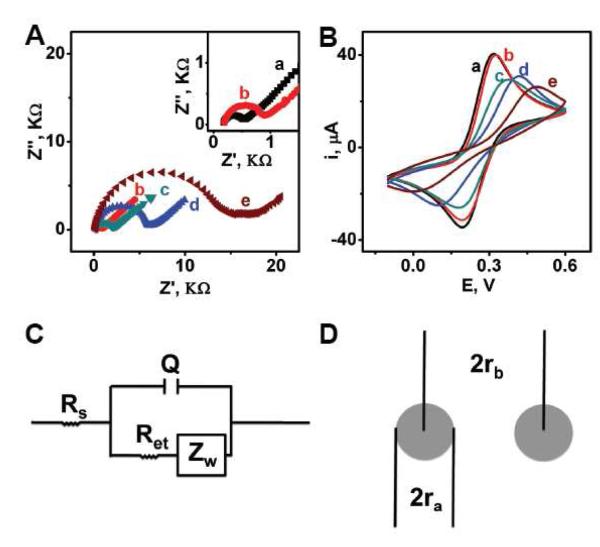
Impedance spectroscopy (EIS) and cyclic voltammetric studies shed useful insights into the surface coverage and compactness of the new ternary monolayer in comparison to commonly used binary SAM. Figure 4 compares Nyquist plots (A) and cyclic voltammograms (B) obtained in the presence of equimolar [Fe(CN)6]4-/3- for the bare AuE (a) and for Au electrodes modified with monocomponent SHCP (b), binary SHCP+MCH (c), SHCP/DTT (d) and ternary SHCP/DTT+MCH (e) monolayers. The bare AuE displays fast electron transfer process with a diffusional limiting step. As expected, increased electron transfer resistance is observed for electrodes coated with the different monolayers.15,29
Figure 4.
(A) Nyquist diagram (Z” vs Z’) for the faradaic impedance measurements and (B) cyclic voltammograms obtained with a bare AuE (curves a), a EC SHCP-AuE (curves b), a EC SHCP+MCH-AuE (curves c), a EC SHCP/DTT-AuE (curves d) and a EC SHCP/DTT+MCH-AuE (curves e). Operating conditions: EIS, 5 mM [Fe(CN)6]3–/4– (1:1) in 0.1 M KCl, 0.01–10,000 Hz frequency range with a 0.01 V r.m.s. signal at +0.25 V (vs. Ag/AgCl); CV, v = 100 mV s−1. Schematic representations of (C) the Randles equivalent used to model the electrochemical impedance spectroscopy data and (D) the pinhole model (ra is the radius of the pinhole and rb is half the distance between the centers of adjacent pinholes).
The Randles modified equivalent circuit (Figure 4C) was used to fit the EIS data and to determine the electrical parameters of the monolayers.29,30 Table 2 summarizes the values calculated for the electrolyte resistance (RS), the Warburg impedance resulting from ion diffusion from the electrolyte bulk (ZW), the electron transfer resistance (Ret), and the constant phase element Q (instead of the double layer capacitance, Cdl, to account that the frequency dispersion often related directly to electrode roughness). These Nyquist plots clearly illustrate the increased electron transfer resistance value upon changing from a naked surface, to the various binary and ternary SAM, from a Ret value of 366.9 to 14,698.1 μ (a vs. e) (Table 2). As will be illustrated below such change in the Ret value reflects the greatly increased surface coverage values associated with the binary and ternary layers.
Table 2.
Summary of electrochemical impedance data extracted and calculated from data modeling using the Randles equivalent circuit (EC SHCP).
| Surface | Q(μF) | ZW(Ω·s−1/2) | Ret(Ω) | Rs(Ω) | θ IS R | θ IS P | ra(μm) | rb(μm) |
|---|---|---|---|---|---|---|---|---|
| Bare | 2.12 | 7.81×10⁻⁴ | 366.9 | 166.4 | — | — | — | — |
| SHCP | 1.93 | 8.17×10⁻⁴ | 751.4 | 175.9 | 0.5117 | — | — | — |
| SHCP+MCH | 0.268 | 6.67×10⁻⁴ | 5,877.3 | 171.0 | 0.9376 | 0.9847 | 1.1 | 8.7 |
| SHCP/DTT | 0.849 | 5.90×10⁻⁴ | 1,866.6 | 187.8 | 0.8034 | — | — | — |
| SHCP/DTT+MCH | 0.466 | 4.64×10⁻⁴ | 14,698.1 | 186.4 | 0.9750 | 0.9895 | 2.3 | 22.6 |
As expected, electrodes modified with different monolayers display a decreased cyclic voltammetric peak current and an increased peak-potential separation compared to the voltammetric behaviour observed at the bare electrode (Figure 4B). These voltammetric data (i.e., ‘blocking’ behaviour) are consistent with the observations of the EIS experiments.
The charge-transfer resistance (Rct) can be related to the coverage of the electrode (θISR), assuming that electron-transfer reactions occur only at bare surface spots and that the diffusion to these defect sites is planar:31
| (1) |
where RctAuE and RctSAM are the charge-transfer resistances measured at the bare and monolayer-covered electrodes, respectively. When the θISR value approaches one (θ > 0.9), the coverage can be estimated using a model based on the pinhole size32:
| (2) |
where σW is the Warburg coefficient (calculated from the characterization of the bare AuE), and m is the slope of the linear interval observed in the high frequencies region of the Z’ vs ω−1/2 function obtained at the SAM modified electrode.32
As shown in Table 2, θISp of the SHCP/DTT, SHCP+MCH and SHCP/DTT+MCH are 0.8034, 0.9847 and 0.9895, respectively. These data clearly indicate that the surface coverage follows the order: SHCP/DTT+MCH ≥ SHCP+MCH > SHCP/DTT. Apparently, the co-assembly of the DTT molecule via two Au-S bonds,27,28 leads to ternary monolayer with a high packing density and surface coverage compared to common SAM prepared with a linear-configuration backfiller (SHCP+MCH). In addition, the surface coverage of the SHCP/DTT layer is greatly improved by complementary backfilling with a linear-configuration backfiller (MCH). As a result, a high surface coverage of 0.9895 is achieved for the ternary SHCP/DTT+MCH SAM. These estimated surface coverages may be a subject to overestimation due to nonidealities, such as assumptions regarding the geometry of the pores as well as to the uncertainty of the slope values due to the noisy nature of this numerical subtraction.31
Moreover, the fraction of the pinhole area, (1- θISp), can be related to the size of the pinholes (ra)33 and the distance between the centres of adjacent pinholes (rb) (Figure 4D) by:
| (3) |
As can be seen in Table 2, ra and rb values obtained for conventional binary SHCP+MCH and new ternary SHCP/DTT+MCH SAMs are consistent with a microelectrode array behaviour of gold electrodes modified with these SAMs,34 with pinhole radii and separation of ca. 0.1–10 μm 1–100 μm, respectively.
Compared to the SHCP+MCH SAM, the SHCP/DTT+MCH surface offers largely bigger rb values (Table 2), indicating substantially fewer pinholes on the ternary SAM. As was discussed earlier, the reduced amount of the pinholes reflects the compact and nearly complete surface coverage offered by the ternary SAM. Overall, the EIS data indicate that the ternary SHCP/DTT+MCH surface offers the following advantages compared with the most common SHCP+MCH SAM. First, the bigger EIS capacitance value of the DTT-based ternary surface indicates that the inclusion of this short spacer provides a compact, yet somewhat disordered self assembled monolayers with high electron permeability and very good overall surface coverage, making the system suitable for electrochemical sensing.27,35 In addition, the high θISp value of the ternary monolayer (i.e., its high surface coverage), leads to a greater resistance to surface fouling. Finally, higher rb value indicates that this SAM possesses fewer pinholes, leading to better spacing of the capture probe, which provides freedom for the target coiling.
Electrochemical Detection of DNA Hybridization
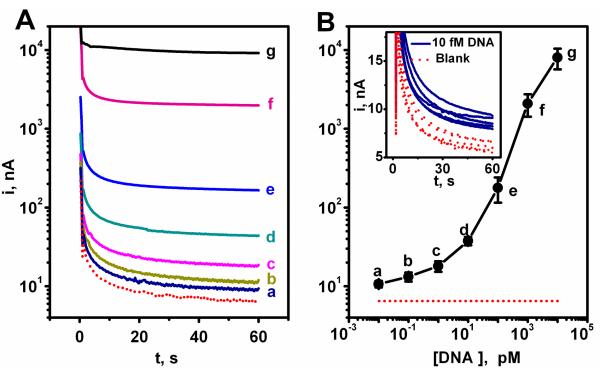
The analytical performance of the DNA hybridization assay based on the optimal SHCP/DTT+MCH interface was characterized using microliter (4 μL) samples. Figure 5A displays the chronoamperometric response at −0.2 V for different concentrations of target DNA: (a) 10 fM, (b) 100 fM, (c) 1 pM, (d) 10 pM, (e) 100 pM, (f) 1 nM and (g) 10 nM. The resulting calibration plot, shown in Figure 5B, indicates a nonlinear logarithmic dependence between the amperometric signal and the target DNA concentration over such wide (nM – fM) range. The lowest detectable concentration, 10 fM (see inset in Figure 5B), corresponds to 40 zmole in the 4 μL sample.
Figure 5.
(A) Chronoamperometric response for different concentrations of the target EC DNA: (dotted red line) 0, (a) 10 fM, (b) 100 fM, (c) 1 pM, (d) 10 pM, (e) 100 pM, (f) 1 nM, and (g) 10 nM. Potential step to −0.2 V. (B) Logarithmic plot of current vs. target EC DNA concentration. Error bars estimated from five parallel experiments. Inset: 5 chronoamperometric signals for 10 fM target EC DNA along with the corresponding blank (0 target EC DNA) signals. Differences between samples containing the 10 fM target EC DNA and the negative control (without target EC DNA) were significant (P < 0.05). Chips modified with the EC SHCP/DTT + MCH monolayer.
For comparison, we also prepared DNA sensors based on the common backfilling approach proposed by Herne and Tarlov.26,36 As was shown earlier in Figure 2, such binary SHCP+MCH interface is characterized with a limit of detection around 100 pM, which is 10,000 times higher than that obtained with the new ternary monolayer, reflecting the higher non-specific background contribution (Figure 2, dotted line) observed with the binary monolayer. The 5 repetitive runs for the background and 10 fM DNA solutions [Figure 5B (inset) and Figure S-1 of the Supporting Information] demonstrated clearly the ability to use the new ternary interface for detecting ultralow (fM) target concentrations.
The detection limit obtained with the ternary monolayer (10 fM or 40 zmole target DNA) is notably lower compared to those reported previously for SAM-based electrochemical DNA sensors. For example, it is 100-1,000 fold lower than the detection limits reported recently for binary SHCP+OEG37 or ternary SHCP+MPA+MCH monolayers.17,18 This indicates that the co-assembly of DTT offers a greatly lower detection limits even when compared to other ternary monolayers (see Table 1).
Apart from the substantial improvement in the S/N characteristics, extensive data - obtained with more than 50 coated electrodes - clearly indicate that the new ternary interface actually enhances the overall reproducibility (compared to common binary monolayers), including in situations where the gold surfaces are not reproducible (e.g., different batches of commercial gold chips, with RSDs of 24.7 and 99.4 %, respectively, for the S/N values for 1 nM of target DNA). Coating other common commercial gold electrodes (disks or strips) with the ternary monolayer resulted also in an improvement in S/N in comparison with the binary monolayer (data not shown), reflecting the scope and power of the new interface.
In order to evaluate also the applicability of the new electrochemical DNA sensor to biological fluids, we have compared its performance in pure HB buffer and in complex biological samples. These experiments (described in Figure S-2 in the Supporting Information), indicate that that the SHCP/DTT + MCH SAMs are highly resistant to non-specific adsorptions, with minimal changes of the background noise and nearly the same hybridization signal for the 1 nM target DNA even in the presence of 25% of human serum or urine. These data suggest that the presence of biological fluids has a small effect upon the performance, indicating great potential for real-world applications.
Genosensor response for E. coli 16S rRNA
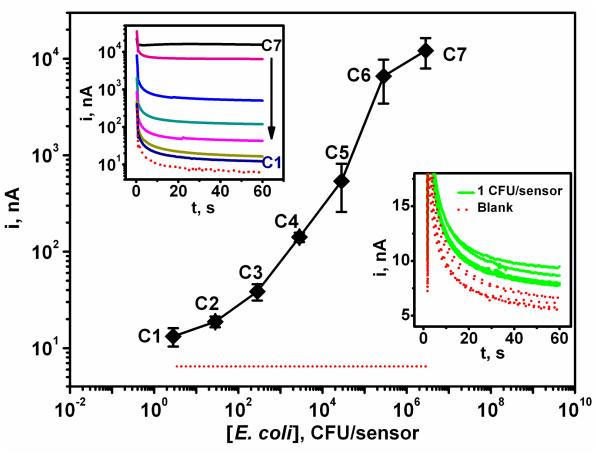
The practical utility of the DNA hybridization assay at the new ternary interface was illustrated using the detection of E. coli pathogenic 16S rRNA. Figure 6 (left inset) displays chronoamperometric signals obtained for different bacterial lysate solutions corresponding to E. coli cells concentrations of: (a) 3, (b) 30, (c) 300, (d) 3×10³, (e) 3×10⁴, (f) 3×10⁵, (g) 3×10⁶ CFU per sensor. The resulting calibration plot (also shown in Figure 6) indicates a nonlinear logarithmic dependence between the current signal and the level of E. coli 16S rRNA down to 3 CFU per sensor. Furthermore, a series of 5 measurements of 16S rRNA corresponding to 1 CFU per sensor was carried out along with 5 control experiments (blank signals). As indicated from the right inset of Figure 6 and Figure S-1 of the Supporting Information, the repetitive signals obtained for these 1 CFU samples can be clearly distinguished from those observed without the bacterial rRNA target. Considering the 4 μL sample volume such detection limit corresponds to 250 CFU mL−1. Taking into account that E. coli contain approximately 2×10⁴ copies of 16S rRNA per cell,38 the present detection limit of 250 CFU mL−1 can be translated to the detection of 8 fM ribosome copies, which is consistent with the 10 fM detection limit observed in Figure 5 for the target DNA.
Figure 6.
Calibration plot for E. coli 16S rRNA corresponding to different pathogen bacteria concentrations: (dotted red line) 0, (C1) 3, (C2) 30, (C3) 300, (C4) 3×10³, (C5) 3×10⁴, (C6) 3×10⁵ and (C7) 3×10⁶ CFU per sensor. Inset (top left): corresponding chronoamperograms; inset (bottom right): response for 16S rRNA of 1 CFU/sensors along with the corresponding blank (0 CFU) signals. Differences between samples containing 1 CFU and the negative control (without target DNA) were significant (P < 0.05). Error bars estimated from five parallel experiments. Chips modified with the EC SHCP/DTT + MCH monolayer.
Precision, Specificity and Validation Studies
The precision of the new biodetection platform was examined in connection to ultralow target concentrations. Reproducible signals were obtained for 10 parallel measurements of 10 fM target DNA (Figure 5B, inset) or 5 16S rRNA measurements corresponding to 1 CFU/sensor (Figure 6, right inset), leading to favorable relative standard deviations (RSDs) of 9.9 % and 10.3 %, respectively.
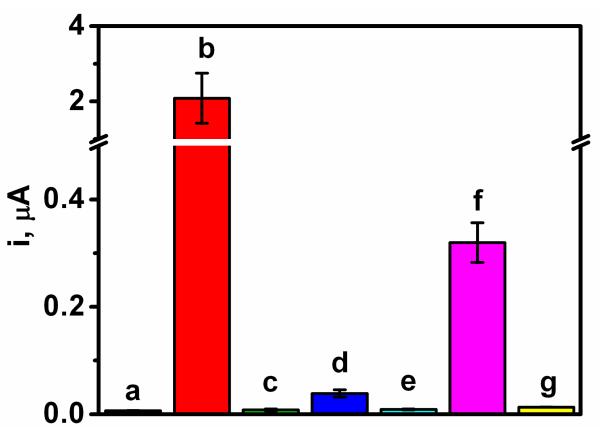
The specificity of the sensing protocol was examined by challenging the system with various non-complementary and mismatched oligonucleotides. Figure 7 shows the corresponding column graph of chronoamperometric responses obtained for 1 nM sample solutions of non-complementary and different mismatched oligonucleotides. As expected, non-complementary (c) and 3-base mismatched oligonucleotides (e) display a negligible change in the response (compared to the control signal without the nucleic acid (a)). The 2-base mismatched DNA (d) yields a very small defined signal of 39 nA, compared to 2,087 nA observed for a similar target concentration (b), reflecting the partial duplex formation of the double mismatch.
Figure 7.
Column bar corresponding to the chronoamperometric responses obtained with 0 nM EC target DNA (a), and 1 nM of the target EC DNA (b), a non-complementary EC DNA (c), a 2-base mismatched EC oligonucleotide (d), a 3-base mismatched EC oligonucleotide (e), 16S rRNA corresponding to 2.2×10⁴ CFU/sensor E. coli (f) and 16S rRNA corresponding to 2.9×10⁴ CFU/sensor K. pneumoniae (g). Errors bars estimated as a triple of the standard deviation (n = 2). Chips modified with the EC SHCP/DTT + MCH monolayer.
The specificity of the bioassay was also tested using as no-target biological control Klebsiella pneumoniae (K. pneumoniae), another gram-negative pathogenic Enterobacteriaceae.39 As illustrated in Fig. 7, and contrary to the chronoamperometric signal obtanined for E. coli 16S rRNA (f), the response observed in the presence of K. pneumoniae 16S rRNA (g) is similar to that observed for the negative control (without target DNA) (a). Overall, the data of Figure 7 indicate that the new ternary interface offers high specificity to the complementary DNA (and E. coli 16S rRNA), reflecting the negligible non-specific adsorption of the detection probe onto the proposed DTT-based ternary SAM.
The practicability and specificity of the new platform were evaluated and validated more thoroughly by using 18 well-characterized uropathogenic isolates. These results (included in the Supporting Information Section ‘Application for diagnosing of real uropathogenic clinical isolates’) clearly indicate that the microarray is able to detect and successfully identify the 100 % of the E. coli clinical isolates within 45 min. These observations demonstrate that the system offers significant improvements over the laborious standard identification procedures and provide a rapid tool for the identification of clinical isolates.
CONCLUSIONS
We have demonstrated that a rational design of a new ternary SAM structure, incorporating a thiolated capture probe, MCH and DTT, addresses the incomplete backfilling and related surface defects observed commonly in the binary SAM and offers a dramatic improvement in the signal-to-background characteristics of SAM- and HRP/TMB-based electrochemical DNA biosensors. Such improvements reflect the lower pinhole defects and the significantly higher resistance to the non-specific adsorption of nucleic acids and of proteins (such as the HRP tag) leading to negligible background current contributions even in the presence of complex biological samples such as serum or urine. The resulting high signal-to-background characteristics lead to a remarkably sensitive electrochemical DNA biosensor with a zeptomole detection limit. Such value is particularly impressive considering the simplicity of the developed methodology and the absence of any deliberate (signal or target) amplification protocol. Apart from the notably lower detection limits compared to previously non-amplification SAM-based electrochemical DNA sensors, the new sensor reduces considerably the consumption of the thiolated probe. The applicability of the new genosensor has been illustrated for measuring ultralow levels of E. coli pathogenic bacteria down to the 1 CFU/sensor and for the unequivocal identification of uropathogenic clinical isolates. Once prepared, the new DNA platform can detect directly raw bacterial ribosomal RNA without isolation or purification steps, allowing pathogen determination in only 30 min. Current efforts aim at exploiting the improved performance (lower detection limit) offered by the new ternary interface to determine pathogen antibiotic susceptibility directly from clinical samples at an earlier timepoint than would otherwise have been possible. The remarkable sensitivity and high specificity, as demonstrated for the successful diagnosis of clinical isolates, indicate great promise for a wide range of nucleic acid testing, including biomedical diagnostics, food safety, biothreat detection, and forensic analysis. This study has broader implications into other bioaffinity assays (e.g., immunoassays of proteins) by emphasizing again the crucial role of the surface architecture in achieving ultralow detection limits.
Supplementary Material
Acknowledgements
Financial support from the National Institutes of Health (Award U01 AI075565) and National Science Foundation (Award CHE 0506529) are gratefully acknowledged. S.C. thanks the University Complutense of Madrid and Programa Becas Complutense del Amo (2010-2011).
References
- (1).Gooding JJ. Electroanalysis. 2002;14:1149–1156. [Google Scholar]
- (2).Palecek E, Fojta M. Anal. Chem. 2001;73:74A–83A. doi: 10.1021/ac0123936. [DOI] [PubMed] [Google Scholar]
- (3).Wang J. Anal. Chim. Acta. 2002;469:63–71. [Google Scholar]
- (4).Chrisey LA, Lee GU, O’Ferrall CE. Nucleic Acids Research. 1996;24:3031–3039. doi: 10.1093/nar/24.15.3031. [DOI] [PMC free article] [PubMed] [Google Scholar]
- (5).Gu J, Lu X, Ju H. Electroanalysis. 2002;14:949–954. [Google Scholar]
- (6).Garnier F, Bouabdallaoui B, Srivastava P, Mandrand B, Chaix C. Sens. Actuat. B. 2007;123:13–20. [Google Scholar]
- (7).Loaiza OA, Campuzano S, Pedrero M, Pingarrón JM. Talanta. 2007;73:838–844. doi: 10.1016/j.talanta.2007.04.059. [DOI] [PubMed] [Google Scholar]
- (8).Loaiza OA, Campuzano S, Pedrero M, Pingarrón JM. Electroanalysis. 2008;20:1397–1405. [Google Scholar]
- (9).Satjapipat M, Sanedrin R, Zhou F. Langmuir. 2001;17:7637–7644. [Google Scholar]
- (10).Sun X, He P, Liu S, Ye J, Fang Y. Talanta. 1998;47:487–495. doi: 10.1016/s0039-9140(98)00108-8. [DOI] [PubMed] [Google Scholar]
- (11).Flechsig G-U, Peter J, Hartwich G, Wang J, Gründler P. Langmuir. 2005;21:7848–7853. doi: 10.1021/la051176n. [DOI] [PubMed] [Google Scholar]
- (12).Levicky R, Herne TM, Tarlov MJ, Satija SK. J. Am. Chem. Soc. 1998;120:9787–9792. [Google Scholar]
- (13).Lao R, Song S, Wu H, Wang L, Zhang Z, He L, Fan C. Anal. Chem. 2005;77:6475–6480. doi: 10.1021/ac050911x. [DOI] [PubMed] [Google Scholar]
- (14).Keighley SD, Li P, Estrela P, Mighorato P. Biosens. Bioelectron. 2008;23:1291–1297. doi: 10.1016/j.bios.2007.11.012. [DOI] [PubMed] [Google Scholar]
- (15).Radi AE, Sánchez JLA, Baldrich E, O’Sullivan CK. Anal. Chem. 2005;77:6320–6323. doi: 10.1021/ac0505775. [DOI] [PubMed] [Google Scholar]
- (16).Boozer C, Chen SF, Jiang SY. Langmuir. 2006;22:4694–4698. doi: 10.1021/la052908e. [DOI] [PubMed] [Google Scholar]
- (17).Dharuman V, Hahn JH. Biosens. Bioelectron. 2008;23:1250–1258. doi: 10.1016/j.bios.2007.11.015. [DOI] [PubMed] [Google Scholar]
- (18).Dharuman V, Chang BY, Park SM, Hahn JH. Biosens. Bioelectron. 2010;25:2129–2134. doi: 10.1016/j.bios.2010.02.019. [DOI] [PubMed] [Google Scholar]
- (19).Henry OYF, Perez J. Gutierrrez, Sanchez J. Ll. Acero, O’Sullivan CK. Biosens. Bioelectron. 2010;25:978–983. doi: 10.1016/j.bios.2009.09.007. [DOI] [PubMed] [Google Scholar]
- (20).Volpe G, Compagnone D, Draisci R, Palleschi G. Analyst. 1998;123:1303–1307. doi: 10.1039/b003176n. [DOI] [PubMed] [Google Scholar]
- (21).Fanjul-Bolado P, González-García MB, Costa-García A. Anal. Bioanal. Chem. 2005;382:297–302. doi: 10.1007/s00216-005-3084-9. [DOI] [PubMed] [Google Scholar]
- (22).Campuzano S, Gálvez R, Pedrero M, de Villena F. J. Manuel, Pingarrón JM. J. Electroanal. Chem. 2002;526:92–100. [Google Scholar]
- (23).Boukamp BA. Users Manual. second ed University of Twente; The Netherlands: 1993. Equivalent Circuits. [Google Scholar]
- (24).Liao JC, Mastali M, Gau V, Suchard MA, Moller AK, Bruckner DA, Babbitt J, Li Y, Gornbein J, Landaw EM, McCabe ERB, Churchill BM, Haake DA. J. Clin. Microbiol. 2006;44:561–570. doi: 10.1128/JCM.44.2.561-570.2006. [DOI] [PMC free article] [PubMed] [Google Scholar]
- (25).Wu J, Chumbimuni-Torres KY, Galik M, Thammakhet C, Haake DA, Wang J. Anal. Chem. 2009;81:10007–10012. doi: 10.1021/ac9018507. [DOI] [PMC free article] [PubMed] [Google Scholar]
- (26).Steel AB, Herne TM, Tarlov MJ. Anal. Chem. 1998;70:4670–4677. doi: 10.1021/ac980037q. [DOI] [PubMed] [Google Scholar]
- (27).MacDairmid AR, Gallagher MC, Banks JT. J. Phys. Chem. B. 2003;107:9789–9792. [Google Scholar]
- (28).Creczynski-Pasa TB, Millone MAD, Munford ML, de Lima VR, Vieira TO, Benitez GA, Pasa AA, Salvarezza RC, Vela ME. Phys. Chem. Chem. Phys. 2009;11:1077–1084. doi: 10.1039/b811964c. [DOI] [PubMed] [Google Scholar]
- (29).Ruan C, Yang L, Li Y. Anal. Chem. 2002;74:4814–4820. doi: 10.1021/ac025647b. [DOI] [PubMed] [Google Scholar]
- (30).Yang L, Li Y, Erf GF. Anal. Chem. 2004;76:1107–1113. doi: 10.1021/ac0352575. [DOI] [PubMed] [Google Scholar]
- (31).Janek RP, Fawcett WR. Langmuir. 1998;14:3011–3018. [Google Scholar]
- (32).Amatore C, Savéant JM, Tessier D. J. Electroanal. Chem. 1983;147:39–51. [Google Scholar]
- (33).Tokuda K, Gueshi T, Matsuda H. J. Electroanal. Chem. 1979;102:41–48. [Google Scholar]
- (34).Finklea HO. Electrochemistry of organized monolayers of thiols and related molecules on electrodes. In: Bard AJ, Rubinstein I, editors. Electroanalytical Chemistry: A Series of Advances. vol. 19. Marcel Dekker Inc.; New York: 1996. pp. 109–335. [Google Scholar]
- (35).Millone M. A. Daza, Vela ME, Salvarezza RC, Creczynski-Pasa TB, Tognalli NG, Fainstein A. Chem. Phys. Chem. 2009;10:1927–1933. doi: 10.1002/cphc.200900265. [DOI] [PubMed] [Google Scholar]
- (36).Steel AB, Levicky RL, Herne TM, Tarlov MJ. Biophys. J. 2001;79:975–981. doi: 10.1016/S0006-3495(00)76351-X. [DOI] [PMC free article] [PubMed] [Google Scholar]
- (37).Zhang J, Lao RJ, Song SP, Yan ZY, Fan CH. Anal. Chem. 2008;80:9029–9033. doi: 10.1021/ac801424y. [DOI] [PubMed] [Google Scholar]
- (38).Neidhardt F, Umbarger H. Chemical composition of Escherichia coli. In: Neidhardt F, et al., editors. Escherichia coli and Salmonella typhimurium. 2nd ed vol. I. ASM Press; Washington, D.C.: 1996. pp. 13–16. [Google Scholar]
- (39).LaGier MJ, Scholin CA, Fell JW, Wang J, Goodwin KD. Mar. Poll. Bull. 2005;50:1251–1261. doi: 10.1016/j.marpolbul.2005.04.034. [DOI] [PMC free article] [PubMed] [Google Scholar]
Associated Data
This section collects any data citations, data availability statements, or supplementary materials included in this article.


