Abstract
Biological imaging applications often employ molecular probes or nanoparticles for enhanced contrast. However, resolution and detection are still often limited by the intrinsic heterogeneity of the Isample, which can produce high levels of background that obscure the signals of interest. In this article we describe approaches to overcome this obstacle based on the concept of dynamic contrast, a strategy for elucidating signals by the suppression or removal of background noise. Dynamic contrast mechanisms can greatly reduce the loading requirement of contrast agents, and may be especially useful for single-probe imaging. Dynamic contrast modalities are also platform-independent, and can enhance the performance of sophisticated biomedical imaging systems or simple optical microscopes alike. Dynamic contrast is performed in two stages: i) a signal modulation scheme to introduce time-dependent changes in amplitude or phase, and ii) a demodulation step for signal recovery. Optical signals can be coupled with magnetic nanoparticles, photoswitchable probes, or plasmon-resonant nanostructures for modulation by magnetomotive, photonic, or photothermal mechanisms respectively. With respect to image demodulation, many of the strategies developed for signal processing in electronics and communication technologies can also be applied toward the editing of digital images. The image processing step can be as simple as differential imaging, or may involve multiple reference points for deconvolution using cross-correlation algorithms. Periodic signals are particularly amenable to image demodulation strategies based on Fourier transform; the contrast of the demodulated signal increases with acquisition time, and modulation frequencies in the kHz range are possible. Dynamic contrast is an emerging topic with considerable room for development, both with respect to molecular or nanoscale probes for signal modulation, and also to methods for more efficient image processing and editing.
Keywords: Imaging, contrast agents, nanoparticles, magnetic properties, photothermal
Introduction
Biological and biomedical imaging methods are indispensible tools for the diagnosis of the human condition, and for advancing our understanding of the multiple factors that contribute toward disease states. Optical modalities are especially favorable for biological imaging at the level of cells and tissues, and can also be applied effectively toward small-animal imaging. From a clinical perspective, optical imaging is traditionally performed on tissues acquired from biopsies using histological methods, but current efforts in biomedical imaging are focused on intravital or minimally invasive approaches with the goal of achieving subcellular resolution in vivo.[1,2] This challenge is far from trivial, as biological tissues are complex materials that often produce high levels of scattering and autofluorescence at optical wavelengths. These sources of noise can be mitigated by (i) using near-infrared (NIR) wavelengths between 750 and 1300 nanometers, which penetrate more deeply through tissue than visible light, and (ii) introducing NIR-active contrast agents to generate optical signatures within a region of interest (ROI).[3-7] Nevertheless, even the brightest signals can be obscured by the intrinsic opacity of biological tissue and difficult to resolve against a heterogeneous background, particularly if they are at a low concentration.
Approaches to contrast enhancement fall into two categories. The first method is to improve signal quality by designing contrast agents with exceptional optical activity. Plasmon-resonant gold nanoparticles are widely used in biological imaging applications, as they can be engineered to support large absorption and scattering cross sections at NIR wavelengths and are also presumed to be biocompatible.[4-8] For contrast based on fluorescence, a wide range of molecules and nanoparticles are capable of producing strong emissions at select wavelengths.[9-12] However, the signal amplitude from single molecules or nanoparticles is limited, and most optical imaging modalities require a relatively high concentration for detectable contrast in biological tissues and other complex specimens.
The other route for enhancing optical contrast is to develop mechanisms for reducing background noise. This approach is less obvious than the optimization of signal strength, although some options already exist. For example, many molecular dyes and nanoparticles have large two-photon absorption cross sections, and can be excited by ultrashort NIR laser pulses to generate nonlinear optical signals such as hyper-Rayleigh scattering (HRS), two-photon excited luminescence (TPL), or two-photon excited fluorescence (TPF).[6,13-15] These multiphoton imaging modalities produce minimal background interference and can improve signal-to-background ratios (SBRs) by several orders of magnitude over standard fluorescence imaging, often enabling the detection of single molecules or nanoparticles.[16,17] However, nonlinear optical imaging is generally limited to shallow penetration depths (less than 0.3 mm below the surface), and is typically performed under confocal microscopy conditions. Alternative strategies for background suppression are thus desirable, particularly those that are compatible with long working distances for greater penetration depth, and can be performed with relatively simple optical instrumentation.
The purpose of this paper is to outline the concept of dynamic contrast as a method for enhancing signal detection in complex environments. Dynamic contrast is different from dynamic imaging, which is essentially a recording (movie) of images at a fixed frame rate. Instead, dynamic contrast is generated by periodic changes in signal, which can be readily distinguished against a field of static or aperiodic signals. Dynamic contrast is generated in two stages: modulation for signal amplification and encoding, and demodulation for noise filtering (Figure 1). Mechanisms for signal modulation can involve a selective response by the contrast agent to external fields, applied at a rate defined by the imaging experiment; the stimuli are typically periodic and can be magnetic, optical, or thermal in nature. Contrast enhancement is realized in the demodulation step: A signal processing algorithm deconvolutes the encoded information from the background. The signal quality is largely determined by the differential generated in the modulation step, whereas image contrast is derived by the removal of background noise. The modulation and demodulation stages are independent and therefore interchangeable; various combinations have been reported, and are summarized in Table 1. In this article, we place a particular emphasis on the use of Fourier transform (FT) as an efficient method for signal demodulation and SNR enhancement.
Figure 1.
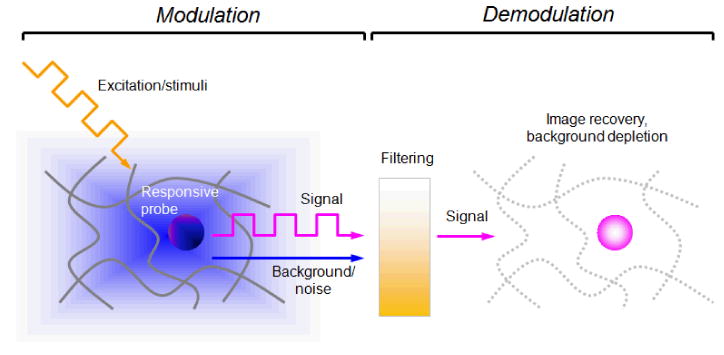
Scheme for dynamic contrast generation, based on signal modulation/demodulation strategies.
Table 1. Selected examples of probes used for dynamic contrast in imaging.
| Modulation | Dynamic contrast agents | Imaging modality | Demodulation | Reference |
|---|---|---|---|---|
| Magnetomotive | Magnetofluorescent particles | Fluorescence | Differential imaging | [28-32] |
| Gold nanostars with Fe3O4 cores | Darkfield scattering | Fourier transform | [48, 49] | |
| Fe3O4@Au core–shell nanoparticles | Darkfield scattering | Fourier transform | [49, 50] | |
| Fe3O4 nanoparticles | Optical coherence tomography (OCT) | Differential imaging | [58-61],[65] | |
| Hemoglobin | Optical Doppler tomography (ODT) | Differential imaging | [64] | |
| Fe3O4@Au core–shell nanoparticles | Photoacoustic | Cross-correlation | [66] | |
| FexOy nanoparticles | Ultrasound | Fourier transform | [67] | |
| Optical | Ag nanodots | Fluorescence | Fourier transform | [81,82] |
| Photoswitchable fluorophores | Fluorescence | Cross-correlation, Fourier transform | [81,82], [92] | |
| CdSe quantum dots (QDs) | Fluorescence | Cross-correlation | [80] | |
| 6-Fam/TAMRA, Cy3/Cy5 (FRET dyes) | Fluorescence | Fourier transform | [83] | |
| Photothermal | Gold nanoparticles | OCT | Fourier transform | [88] |
| Gold nanoshells | OCT | Fourier transform | [89, 90] | |
Signal Modulation Strategies
Dynamic contrast is dependent on molecular probes or nanoparticles whose physical properties can be modulated by an external stimulus. Multifunctional nanoprobes with variable optical responses are especially useful for supporting imaging modalities involving signal modulation;[18-20] examples include hybrid magnetic/fluorescent and magnetic/plasmonic nanoparticles, photoswitchable fluorophores, and photothermally active nanomaterials. Described below are several examples of dynamic contrast based on stimuli-responsive probes.
Magnetomotive signal modulation
Magnetically active contrast agents, which are already widely used in magnetic resonance imaging (MRI)[21] and multimodal variants,[22-24] also offer several opportunities for optical signal modulation. Magnetic nanoprobes that are subject to a time-dependent (AC) magnetic field gradient or switching field can experience a magnetomotive force or torque, introducing a dynamic component to their optical states. The most basic forms of magnetomotive (MM) contrast are spatiotemporal in nature, such that the MM force results in periodic modulations in displacement. For instance, the detection sensitivity of fluorescent DNA sequences can be improved by 100-fold when attached to magnetic beads, which are driven in and out of the optical beam path by an AC magnetic field.[25-27] MM mechanisms for signal modulation are straightforward and adaptable to both sensor (1D) and optical imaging (2D and 3D) modalities, but so far only a handful of examples have been reported in the latter case.
Magneto-optical modulation can also be achieved using rotating magnetic field gradients, which enables one to detect “stationary” signals with potential for improvement in spatial resolution. A relatively early example was reported by Kopelman and co-workers, who used magnetomotive torque for generating dynamic fluorescence contrast from magnetically modulated optical nanoprobes (MagMOONs).[28-32] These contrast agents are comprised of fluorescent magnetic microbeads coated with metallic half-shells (Figure 2a); variations on this theme also include coated pancake-shaped microparticles or chains of magnetic beads.[29] In the original study, periodic changes in signal amplitude were generated using a low-frequency torque (up to 10 Hz); the metal half-shell served both as a barrier in the “off” state to block fluorescence excitation and as a reflector in the “on” state to increase effective quantum yield, resulting in time-dependent fluorescence emission in sync with the driving frequency (Figure 2b,c). Image contrast enhancement was achieved simply by subtracting background signal (autofluorescence, nonspecific staining, and electronic noise) from a reference image without magnetic field modulation, enabling the fluorescent probe to be easily distinguished (Figure 2d). In fact, the frequency-domain spectrum indicates a SBR of 4000 after 100 cycles of signal modulation (10 seconds of data acquisition), so much higher image contrast is possible with more advanced signal demodulation methods (see below).
Figure 2.
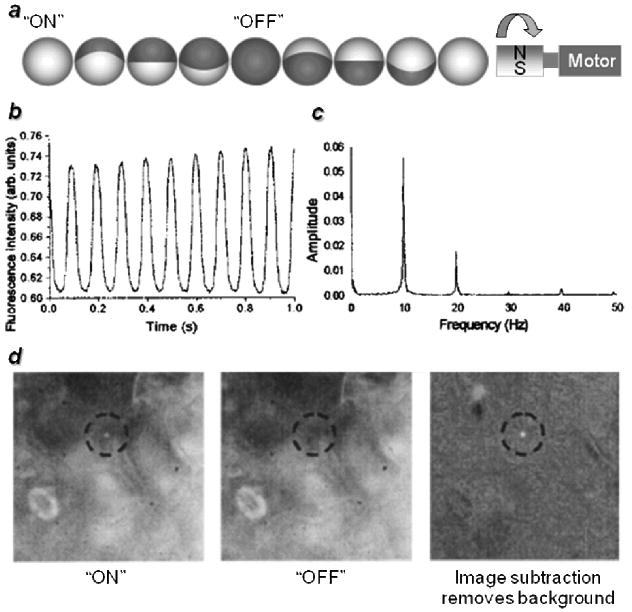
Magnetically modulated fluorescence probes.[28,30] a) Illustration of semi-coated probes turning in response to a rotating magnetic field; b) modulation of fluorescence signal; c) Fourier (power) spectrum; d) contrast enhancement by differential imaging (background subtraction). Published with permission from the American Institute of Physics and the American Chemical Society.
The advantages of MM modalities in dynamic optical contrast are even more clear when imaging molecular or nanoscale probes that produce signals below the diffraction limit:
where d is the diameter of the optical signal, λ is the wavelength, n is the local refractive index, and sin α is the defined by the numerical aperature of the viewing objective. The diffraction limit of research-grade microscopes is typically 200–250 nm in the visible-to-NIR region, making functionalized, superparamagnetic nanoparticles the contrast agent of choice. In this regard, hybrid “magnetoplasmonic” nanoparticles are very appealing: as already mentioned, the large optical cross sections of plasmon-resonant nanoparticles can be configured for resonances at NIR wavelengths, and anisotropic modes are sensitive to changes in polarization as demonstrated in the case of gold nanorods[6,7,33] and nanostars.[34-36] In addition, localized surface plasmons can support several forms of optical emission such as surface-enhanced Raman scattering (SERS) and surface-enhanced fluorescence (SEF),[7,8] so their signals can also benefit from dynamic contrast mechanisms.
Several types of magnetoplasmonic nanoparticles have now been reported, including spherical core–shell nanoparticles,[37-41] dumbbell-shaped heterodimers,[42-45] and anisotropic structures such as nanopyramids,[46] nanocrescents,[47] and nanostars.[48] Some of these have been featured in signal modulation schemes: for example, Lee and co-workers used magnetic modulation to enhance the utility of nanocrescents as single-particle SERS substrates.[47] In this case, the modulation is not periodic; instead the local field enhancement factors are polarization-dependent, and can be oriented in a linear magnetic field gradient to produce the maximum Raman scattering (peak enhancement factor ∼108).
With respect to signal modulation for imaging applications, magnetoplasmonic nanoparticles are strongly scattering and readily detectable by darkfield microscopy or optical coherence tomography (see below), with further contrast enhancement possible under MM conditions. Dynamic optical contrast at NIR wavelengths is possible at the single-particle level, as has been demonstrated recently by Wei and co-workers using gold nanostars with magnetic cores using rotating or linear (in-plane) magnetic field gradients.[48,49] In the case of gyromagnetic contrast (Figure 3a), nanostars rotate in response to a low-frequency torque, and produce periodic modulations in amplitude when illuminated under polarized darkfield conditions. The NIR-active plasmon mode is radial and associated with one of the nanostar arms, and produces maximum scattering when aligned along the polarization plane. For this reason, the “twinkling” frequency of gyromagnetic scattering is double the driving frequency (Figure 3b,c). In the case of MM contrast with linear field gradients (Figure 3d), amplitude modulation relies on the reorientation of nanostars in response to an in-plane switching field at a set frequency; the nanostars are “reset” by a restoring force when the field is off. Under these conditions, the frequency of signal modulation is the same as the switching field (Figure 3e,f).
Figure 3.
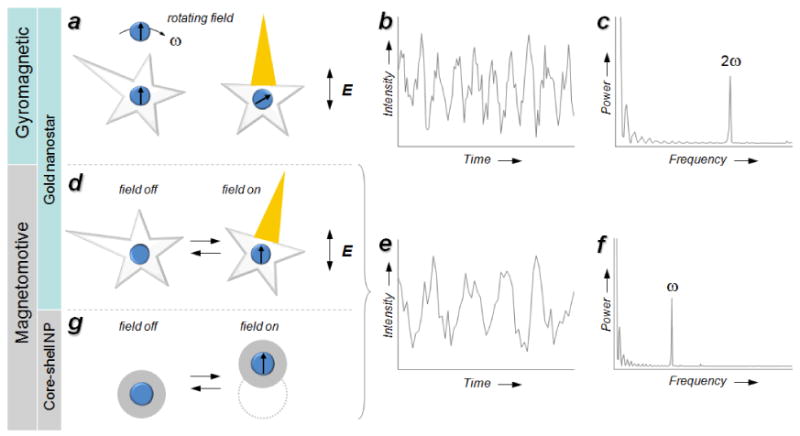
Signal modulation under gyromagnetic and magnetomotive (MM) conditions. [48,49] a) Gyromagnetic modulation of polarized scattering using NIR-active gold nanostars; b) periodic changes in intensity as a function of time; c) power spectrum with a characteristic 2ω peak frequency; d–f) MM modulation of polarized scattering using nanostars, similar to above but with a characteristic ω peak frequency; g) spatiotemporal MM modulation using Au@Fe3O4 core–shell nanoparticles. Published with permission from the American Chemical Society.
It should be noted that signal modulation under gyromagnetic conditions depends on polarization as a filtering mechanism, but can otherwise be considered as a subset of magnetomotive contrast, which is a generic concept and applicable to many kinds of magnetically active nanoparticles. For example, spatiotemporal filtering can be used in place (or in addition to) polarization filtering (Figure 3g), as demonstrated by the localized detection of Fe3O4@Au core–shell nanoparticles.[49,50] Regardless of the filtering method, the pixelated image data acquired under MM conditions is amenable to Fourier transform and can be converted into frequency-selective images, with dramatic improvements in SNR and SBR relative to time-averaged images. Image demodulation by FT and its application toward the detection of MM nanostars in noisy environments will be discussed in the second part of this article.
Magnetomotive modulation has also been used in optical coherence tomography (OCT), a 3D imaging modality based on optical interferometry at NIR wavelengths. [51,52] OCT is capable of providing cellular-level resolution with millimeter-level penetration depth, and is widely used in ophthalmic applications such as retinal imaging. Applying OCT for the analysis of other biological tissues is challenged by intrinsically high background scattering and structural complexity, and requires the development of contrast agents to meet its full potential. In fact, NIR-resonant Au nanoparticles such as nanorods,[53,54] nanoshells,[55] and nanocages[56] have been relatively successful in enhancing OCT contrast, to the stage that detection of nanorods in human breast carcinoma is possible.[57] However, the amount of Au nanoparticle needed for contrast is on the order of several hundred ppm, which is too high to be useful for clinical imaging. This limit may be lowered considerably by replacing static contrast agents with ones that can support dynamic contrast mechanisms.
Boppart and coworkers first developed magnetomotive modalities for OCT (MM-OCT) using colloidal (ca. 20 nm) Fe3O4 nanoparticles, with application toward both in vitro and in vivo imaging. [58-60] The principle is the same as that described in Figure 3: MM signal modulation can be achieved using rotational, coaxial or transverse field gradients (Figure 4a), and applied in step with the axial scan rate so that on/off states are acquired for each volumetric pixel (voxel). The modulation in scattering is derived both from the magnetic nanoparticles and the structures to which they are bound. The MM contrast is thus based on differences in signals between on/off states, and can be displayed as an intensity map over a structural (unmodulated) OCT image (Figure 4b). Recent improvements in signal acquisition using phase-resolved, spectral-domain OCT have increased the sensitivity of MM-OCT imaging with Fe3O4 particle loadings as low as 20 ppm Fe,[61] and enabled their use as labels for the in vivo detection of macrophages in animal models.[59-63]
Figure 4.
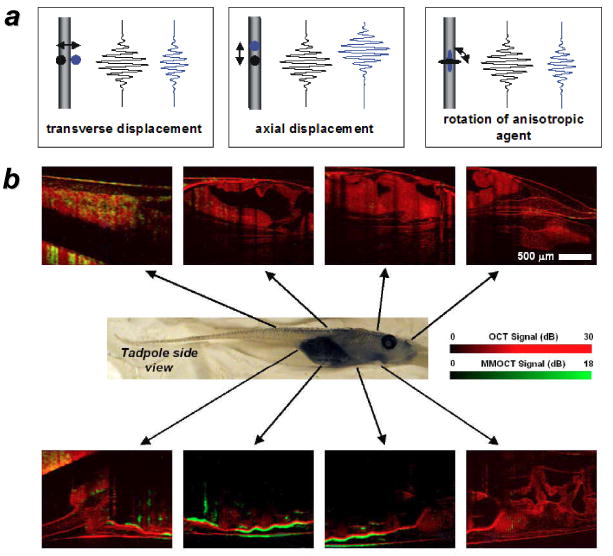
a) Magnetomotive mechanisms for OCT signal modulation based on transverse, axial, or rotational motion; b) in vivo MM-OCT signals (green) from Fe3O4 nanoparticles ingested by live Xenopus laevis tadpoles, superimposed on a structural (unmodulated) OCT image (red).[58,59] Published with permission from the Optical Society of America.
In a similar vein, MM versions of optical Doppler tomography (ODT) have been developed for imaging hemoglobin in blood flow[64] and superparamagnetic FexOy nanoparticles in flow channels.[65] ODT is a variant of OCT that detects the Doppler shift of backscattered photons, and is well suited for imaging moving objects. It is noteworthy that the high Fe content of hemoglobin (4 Fe atoms per protein) is already sufficient for magnetomotive contrast, using a modulation frequency of 50 Hz and a peak magnetic field strength of 0.7 T.[64]
It is worth mentioning that MM signal modulation is applicable toward photoacoustic imaging[66] as well as non-optical imaging methods such as ultrasound (US), a relatively inexpensive but less sensitive modality when compared with magnetic resonance imaging (MRI) and computed tomography (CT). The dynamic range of US frequencies (20 kHz to 200 MHz) is at least nine orders of magnitude lower than visible light, and contrast typically depends on the amplitude difference of backscattered sound waves. Enhanced US contrast has been realized recently by combining MM modulation with Doppler detection. In a demonstration of this method, colloidal FexOy nanoparticles were taken up by macrophages in excised mouse livers then imaged by US while exposed to a 2-T magnetic field, using either a constant frequency of 1–40 Hz or a swept-frequency source.[67] The MM-induced frequency modulations were easily detected as Doppler shifts, with characteristic peaks at twice the driving frequency (2ω).
Optical signal modulation
The concept of using optical input for dynamic contrast is similar to that described above, but with the added benefit of providing greater speed and spatiotemporal control over local contrast generation. All-optical signal modulation can also be decoupled from the physical environment of the contrast agent, and the modulation frequencies can be faster (KHz range or higher) than those delivered by MM modulation (<100 Hz). This is because the latter relies on the physical reorientation or displacement of the magneto-optical probes, and thus limited by its mechanical coupling to local substrate. In fact, MM imaging modalities may be highly suitable for the characterization of local viscoelastic properties, as has been demonstrated recently by micromechanical studies using OCT-based methods. [68,69]
Optical signal modulation is based on reversible changes in photophysical states in response to photonic inputs. Many of these switching events can be achieved on a microsecond timescale, which dictates the upper limit in signal modulation rate: examples of such photoswitchable agents include low-molecular weight dyes,[70] fluorescent proteins,[72,73] and nanoparticles. [74,75] The limitations of optical modulation are defined by the photostablity of the contrast agent, and also by penetration depth for biological samples. While the latter can be remedied in part by the use of NIR wavelengths, most photoswitchable probes operate at visible wavelengths, indicating a direction for further development.
All-optical dynamic contrast has been applied with great success to confocal microscopy, enabling the development of “super-resolution” methods that defy the limits of classical optical diffraction. Photoswitchable probes have been employed in subwavelength optical imaging techniques such as photoactivation light microscopy (PALM),[76,77] stochastic reconstruction optical microscopy (STORM),[78] and related methods,[79,80] with image reconstruction based essentially on background subtraction methods (Figure 5a). Optical contrast can also be enhanced by combining optical modulation with various signal demodulation methods (Figure 5b), although the quality of contrast enhancement depends on the photostability of the optical probe. Recent examples reported by Dickson and co-workers demonstrate that ultrafast optical pulses can be delivered with relatively low excitation energy, for reversible bleaching and reactivation of photoactive states. In this technique, termed synchronously amplified fluorescence image recovery (SAFIRe), photoactive fluorophores with metastable dark states such as silver nanodots[81] and xanthene dyes[82] can be switched reversibly while imaged continuously using a dual-laser system, with modulation frequencies of up to 1000 Hz. The secondary laser is responsible for changes in population between on and off states, and can also enhance the photoemission intensity to a certain extent. The same strategy has recently been applied toward donor–acceptor dye pairs used in fluorescence energy resonance transfer (FRET), coupling dynamic contrast enhancement with biomolecular signaling.[83] Fluorescence signal demodulation by FT resulted in frequency-selective images with enhanced signal quality and image contrast, similar to the examples discussed above involving MM modulation.[48,49]
Figure 5.
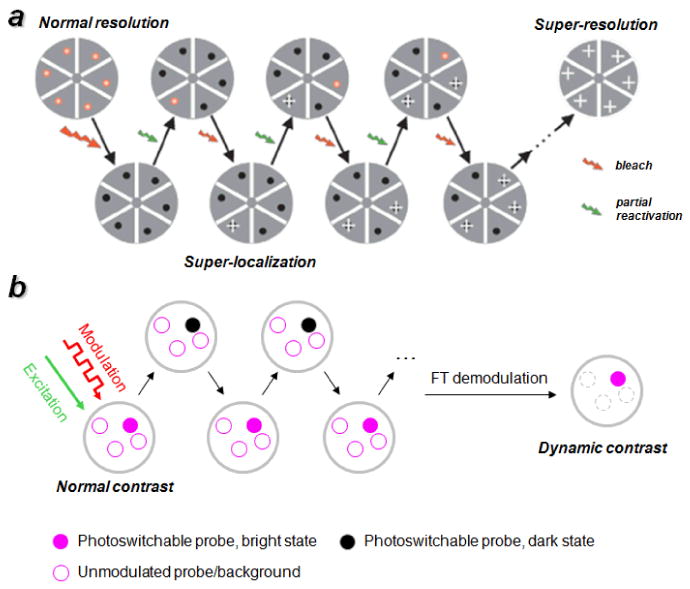
All-optical signal modulation using photoswitchable probes. a) Fluorophores with photoswitchable dark states for super-resolution imaging: stochastic reactivation produces signals at a low density, whose positions can be mapped with subwavelength precision for reconstructive imaging. [76,78] Published with permission from the Nature Publishing Group. b) Photoswitchable fluorescent signals modulated by a periodic bleaching/recovery cycle, followed by FT demodulation for dynamic contrast enhancement. [81,82]
Photothermal signal modulation
Most physical properties are thermally sensitive, providing another mechanism for optical signal modulation. Imaging modalities based on thermal variations in optical contrast are well served by materials with high specific absorption rates and heat capacities, relative to the local medium. Plasmon-resonant Au nanoparticles are particularly useful, as most of their absorbed energy is dissipated in nonradiative fashion, resulting in localized heating. [7,8,84-86] The in situ rise in temperature is accompanied by small but significant changes in local refractive index, which can be detected by a modulation in optical path length. Au particles as small as 2.5 nm have been detected by optical imaging using photothermal (PT) modulation strategies; in comparison, the minimum size for the detection of Au nanoparticles by standard darkfield scattering is 40 nm.[87]
Photothermal modulation has been used as a dynamic optical contrast mechanism in spectral-domain and phase-sensitive OCT, using Au nanospheres or nanoshells as contrast agents. [88-90] Initial studies involved a heating laser at visible wavelengths λex=532 nm) to generate oscillations in temperature at a low modulation frequency (25 Hz), with a detection sensitivity of 14 ppm Au in tissue phantoms.[88] However, PT modulation can also be performed with NIR laser heating using gold nanoshells, and is abetted by a high rate of heat dissipation under physiological conditions. The latter allows for a wide range of modulation frequencies from 500 Hz to 60 kHz, which is compatible with OCT scanning rates. This range of frequencies also makes it easy to optimize dynamic contrast, with signal demodulation by FT yielding at least a 20-fold enhancement in SBR relative to passive, amplitude-based contrast.[89]
PT-OCT has recently been applied toward the ex vivo detection of unfunctionalized Au nanoshells dispersed in highly scattering human breast tumor tissue up to 600 μm below the surface, using modulation frequencies of 5-20 KHz (Figure 6).[90] Although the loading of Au nanoshells was not fully quantified in this work (a 50-μL aliquot at 5 × 10⁹ particles/mL was injected in a random location), a subsequent PT-OCT study involving hybrid Au/Fe3O4 “nanoroses” indicates detectable contrast in rabbit aorta tissue at 2.5 × 10⁹ particles/mL, or 8 ppm, and an even lower limit of detection in tissue phantoms.[91] Therefore, the use of dynamic contrast mechanisms appears highly promising for reducing the loading requirement of contrast agents for tissue imaging applications.
Figure 6.
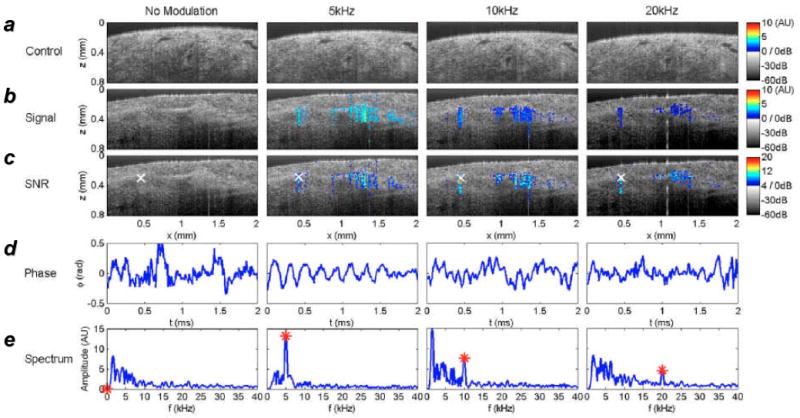
Ex vivo imaging of Au nanoshells dispersed in human breast carcinoma using PT-OCT.[90] a–c) Phase-sensitive PT-OCT signals superimposed onto structural (B-mode) OCT images of tissue impregnated with nanoshells. Photothermal modulation was performed at various frequencies, with optimal contrast obtained at 5 KHz. d,e) Real-time phase modulation and corresponding power spectra, measured at position ‘×’ in c). Published with permission from the Optical Society of America.
Approaches to Signal Demodulation
Signal modulation is only the first step in generating dynamic contrast: A demodulation algorithm must also be applied to recover the image data and to filter out extraneous background information. The primary role of signal demodulation is to suppress background levels and increase SBR (the metric that defines image contrast), but appropriately designed filters can also improve signal quality and increase peak signal-to-noise ratios (SNR). In their simplest form, these two metrics can be expressed as:
where S is the peak signal intensity and B and σB represent the mean and standard deviation of the background intensity (most often defined by the ROI). Numerous signal processing methods have already been developed for removing unmodulated image data, and are directly applicable toward dynamic contrast enhancement. Here we describe three common types of demodulation strategies based on differential imaging, cross-correlation analysis, and Fourier transform (FT) (Figure 7).
Figure 7.
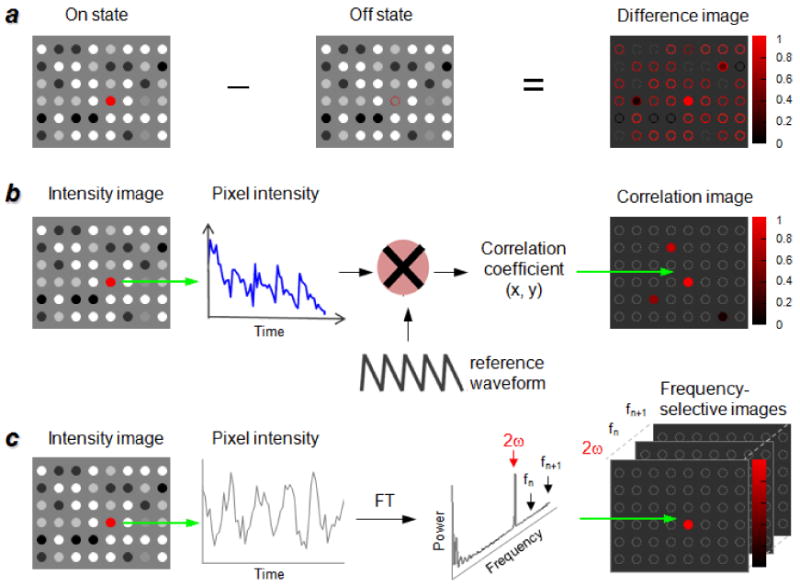
Three common strategies for signal demodulation in imaging: a) Differential image analysis; b) Cross-correlation analysis; c) FT image processing.
Differential imaging
Also commonly referred to as background subtraction, differential analysis is the simplest method of reducing or removing unmodulated image data. A minimum of two successive images are acquired, one prior to signal modulation (reference or “off” state) and the other during or after the modulation event (“on” state); the amplitude differences in the two states yields the desired image with SBR enhancements ranging from several-fold to over an order of magnitude, depending on the imaging modality as well as the complexity of the sample (Figure 7a). A standard assumption for linear subtraction is a minimum change to the image environment between off and on states; in practice, perturbations introduced by thermal motion and uncorrelated (random) modulation events are common and produce a nominal background and false positive signals after image subtraction. For example, the differential fluorescence image in Figure 2d clearly reveals the MagMOON probe, but also introduces positive (and negative) signals in the upper left region, likely due to a change in local morphology.[28] Despite this, the simplicity and benefits of differential image analysis make it useful for a variety of optical imaging modalities based on dynamic contrast (Table 1), and the signals from dynamic contrast agents can be further distinguished from false positives by increasing their concentration in the ROI via targeted delivery mechanisms.
Cross-correlation analysis
If the signal modulation is modest or is challenging to discern against the sample background, multiple modulation cycles can be applied in a programmable fashion, then subjected to cross-correlation algorithms for image demodulation (Figure 7b). In this approach, a series of signal modulation events is encoded by a reference waveform or pulse sequence. Images are recorded over time as the signal modulation sequence is applied, then correlated with the reference waveform to produce correlation coefficient values for each pixel. Those below a threshold value are automatically rejected and the remaining data are used to build the demodulated image, with pixel intensities assigned according to the correlation value distribution. The quality of a correlation image is generally higher than that produced by linear subtraction methods but can still give rise to false positives, and is subject to the sophistication of the applied waveforms and deconvolution algorithms. This often results in a tradeoff between image quality and the efficiency of signal processing, a subject beyond the scope of this article.
Marriott and co-workers developed a dynamic contrast method termed optical lock-in detection (OLID) for fluorescence-based biological imaging, using a photoswitchable fluorophore (nitroBIPS) or fluorescent protein (Dropna) for optical signal modulation and a cross-correlation algorithm for image demodulation.[92] These optical switches have dark states with an appreciable two-photon absorption cross section, and can be converted to their photoactive states by picosecond NIR laser pulses (Figure 8a,b). Irradiation at a second wavelength over time induces their reversion to optically inactive forms, which can be cycled multiple times at a low modulation rate (<0.2 Hz). Cells and tissues loaded with photoswitchable fluorophores were imaged while subject to an optical modulation sequence comprised of up to ten on/off cycles, with the brightest signals serving as an internal reference waveform for cross-correlation analysis (Figure 8c–e). Correlation coefficient values for each pixel were then used to generate the demodulated image with a several-fold increase in SBR. The OLID method was used for the in vivo imaging of Dropna-labeled neurons in zebrafish larvae, with sufficient contrast to resolve neuronal processes having relatively low signal intensity (Figure 8f). These filamental structures are not resolvable by conventional (time-averaged) fluorescence microscopy, demonstrating again the benefits of dynamic contrast for optical imaging.
Figure 8.
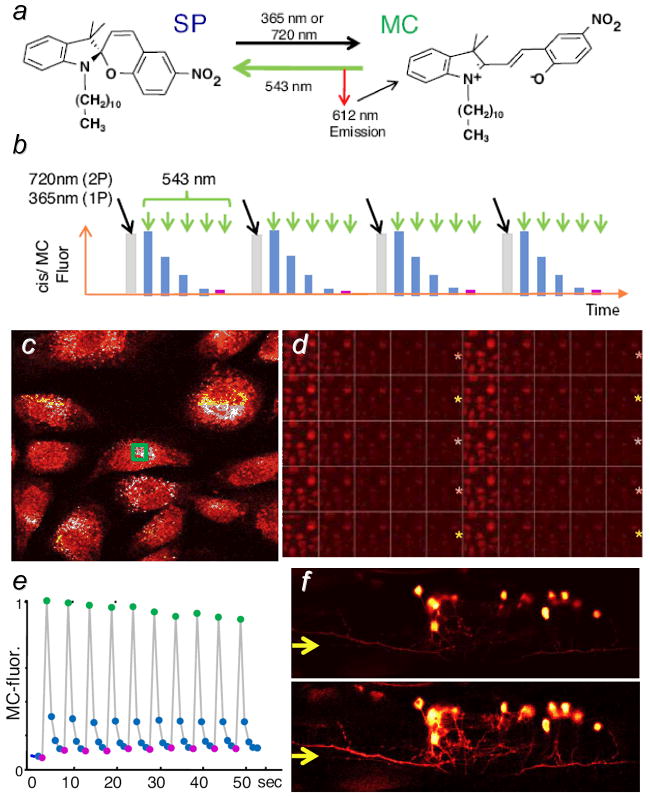
Optical lock-in detection (OLID) of photoswitchable fluorescence probes, using cross-correlation analysis.[92] a) Dark and active optical states of nitroBIPS, corresponding to its spiropyran (SP) and merocyanin (MC) forms; b) optical modulation cycle using two input wavelengths; c) nitroBIPS-labeled fibroblasts at the peak of their fluorescence; d) partial frame sequence showing changes in fluorescence intensity, subject to the modulation cycle in b); e) internal reference waveform, based on the normalized fluorescence intensity within the green region of image c); f) unmodulated fluorescence image (upper) versus correlation image (lower) of cytoplasmic Dronpa in the neurons of a live zebrafish larva. Published with permission from the author.
It should be noted that increasing the number of modulation cycles (N) often improves contrast enhancement as an approximate function of √ N, a well-recognized tradeoff between acquisition time and signal quality. In the case above however, the number of applicable cycles is restricted by the stochastic nature of photoswitching and photobleaching, which degrade the signal intensity over time. The efficiency of photoswitching can also place limits on the modulation frequency, which is an important consideration for real-time imaging modalities such as OCT. Such limits can be removed by developing more robust, optically bistable probes with high quantum efficiencies for photoswitching.
Fourier transform
Most signal modulation sequences are periodic, and thus amenable to demodulation by Fourier transform (Figure 7c). FT-based methods convert periodic modulations of signal intensity into frequencies, obviating the need for pre-encoded or internal reference waveforms employed in cross-correlation analysis. Image contrast is generated in the input frequency channel, and scales with increasing amplitude modulation. Regions exhibiting sizable changes in intensity give rise to high peak values, whereas regions with static or aperiodic modulations in signal are displayed as having nearly zero power.
With respect to imaging, FT-based algorithms can be used for parallel processing of individual pixel addresses in a real-time image sequence. Periodic signal modulations within a ROI are converted into peak powers, while asynchronous signals are simultaneously rejected as background noise. Such algorithms are already available on commercial or public-domain software: Using the gyromagnetic imaging of Au nanostars as an example,[48] signal amplitudes in the time-domain image sequence A(x,y,t) are converted directly into peak powers in the frequency-domain image stack P(x,y,f) using a FT-based plug-in for ImageJ, an open-source program for image data processing.[93] The frequency image stack is useful not only for evaluating image contrast at a specific frequency (f =2ω in the case of gyromagnetic imaging), but also enable image slices to be scanned across the entire frequency range up to the maximum frame rate, something not possible by correlation analysis.
FT-based algorithms are very effective at extracting low-quality signal modulations from noisy environments, and separating them from unmodulated signals of greater intensity. Even if the modulated amplitudes are barely above the noise level, the recovered peak signals in the power spectra typically have large quality factors and narrow linewidths (FWHM < 0.2 Hz), which translate easily into frequency-selective images with high contrast. In the following example, a nanostar was found to be below the threshold of acceptable signal quality (20 dB) when imaged with a low-intensity broadband source, due to the high level of background noise in the time-domain image (Figure 9b).[48] However, signal modulation under gyromagnetic conditions and FT demodulation provided a dramatic boost in contrast and SNR, as well as a rejection of brighter but aperiodic scatterers that might have otherwise obscured the weaker nanostar signal (Figure 9c). Gyromagnetic nanostars could be imaged with an acceptable level of signal quality after just a few modulation cycles, with acquisition times under 1 sec (Figure 9d). If the sampling conditions are further optimized (e.g., by using a NIR laser for illumination), the SNRs of individual nanostars can be as high as 66 dB and with enhancements in SBRs by at least two orders of magnitude, relative to time-averaged images without signal demodulation and recovery.[48]
Figure 9.
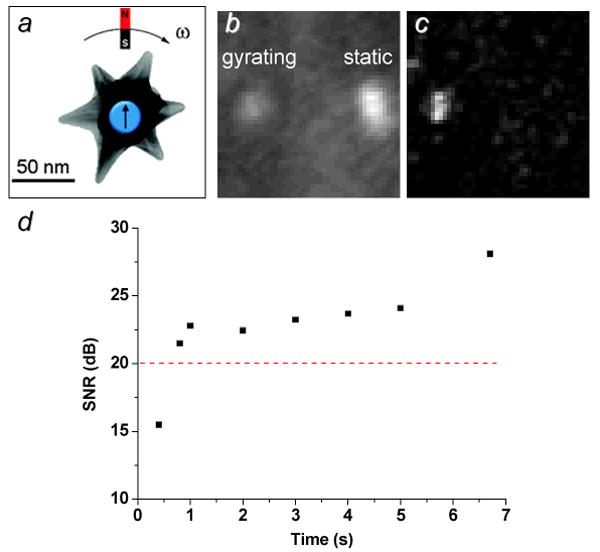
Gyromagnetic imaging of gold nanostars in tumor cell under low-lighting conditions, using polarized scattering.[48] a) Gyromagnetic activity as a mechanism for signal modulation; b) time-averaged image of active (left) and static (right) nanostars, prior to demodulation; c) 2ω-selective image recovered by FT, with complete elimination of unmodulated scatterer (image acquisition time = 7 sec). d) SNR of gyromagnetic nanostar as a function of time (ω=4.7 Hz). Published with permission from the American Chemical Society.
Not surprisingly, FT-based methods have been successfully used for signal demodulation in several imaging modalities employing dynamic contrast (Table 1). In addition to enhancing the contrast of individual probes, Fourier-domain imaging can be applied in conjunction with dynamic contrast at the level of cells and biological tissue. Sokolov and co-workers have shown that entire cells can be magnetomotively displaced when loaded with high levels of Fe3O4@Au core–shell nanoparticles, and easily distinguished by MM imaging from unlabeled cells or cells loaded with gold nanospheres having comparable scattering intensity (Figure 10).[50] With respect to tissue and organ analysis, an interferometric approach was used to record MM deflections from a microreflector implanted in the developing eye of a zebrafish embryo.[94] The frequencies derived from the nanoscale deflections were applied toward micromechanical models to estimate the stiffness of the embryonic eye tissue. Such studies as well as others previously mentioned[68,69] represent novel developments toward minimally invasive methods for biomechanical analysis, based on the physical coupling between magnetically active probes and biological structures. Again, demodulation strategies will likely be important for elucidating mechanical resonances in a spatially resolved manner.
Figure 10.
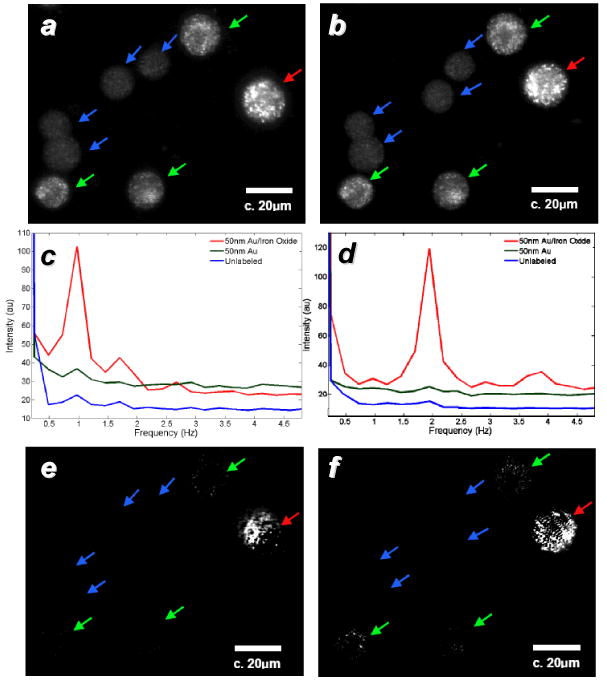
a,b) Darkfield microscopy of A-431 cells labeled with 40-nm Au particles (green arrows), 50-nm Fe3O4@Au core–shell particles (red arrows), and unlabeled cells (blue arrows); c,d) power spectra of labeled cells responding to modulation frequencies of 0.9 and 1.9 Hz, respectively; e,f) frequency-selected MM images.[50] Published with permission from the Optical Society of America.
Conclusion and Outlook
Dynamic signal generation and processing methods, which have long been staples in communications and spectroscopy, are now being used to enhance signal quality and contrast in optical imaging. A key component in this development is the growing availability of novel contrast agents based on stimuli-responsive molecules and nanomaterials, whose optical properties can be modulated by magnetic fields, photonic switching, or photothermal actuation. Dynamic contrast agents may be especially useful in the field of biomedical optics, and have already had a significant impact on OCT and other real-time, 3D optical imaging modalities. As camera resolution, image recording times, and data processing algorithms continue to improve, dynamic contrast will become increasingly useful for imaging applications that require the detection of rare signals in noisy samples, or the elucidation of fine structures in complex biological specimens. Finally, the coupling of dynamic probes with biomolecular or biophysical markers is anticipated to support unique, noninvasive methods for imaging chemical or mechanical properties of sample microenvironments with optical resolution.
Acknowledgments
We gratefully acknowledge support from the National Institutes of Health (RC1 CA147096).
References
- 1.Weissleder R, Pittet MJ. Nature. 2008;452:580–589. doi: 10.1038/nature06917. [DOI] [PMC free article] [PubMed] [Google Scholar]
- 2.Ntziachristos V. Nat Methods. 2010;7:603–614. doi: 10.1038/nmeth.1483. [DOI] [PubMed] [Google Scholar]
- 3.Frangioni JV. Curr Opin Chem Biol. 2003;7:626–634. doi: 10.1016/j.cbpa.2003.08.007. [DOI] [PubMed] [Google Scholar]
- 4.Liao H, Nehl CL, Hafner JH. Nanomedicine. 2006;1:201–208. doi: 10.2217/17435889.1.2.201. [DOI] [PubMed] [Google Scholar]
- 5.Jain PK, Huang X, El-Sayed IH, El-Sayed MA. Acc Chem Res. 2008;41:1578–1586. doi: 10.1021/ar7002804. [DOI] [PubMed] [Google Scholar]
- 6.Tong L, Wei Q, Wei A, Cheng JX. Photochem Photobiol. 2009;85:21–32. doi: 10.1111/j.1751-1097.2008.00507.x. [DOI] [PMC free article] [PubMed] [Google Scholar]
- 7.Wei Q, Wei A. In: Inorganic Nanoprobes for Biological Sensing and Imaging. Mattoussi H, Cheon J, editors. Artech House; New York: 2009. pp. 197–233. [Google Scholar]
- 8.Wei Q, Wei A. In: The Supramolecular Chemistry of Organic-Inorganic Hybrid Materials. Rurack K, Martínez-Máñez R, editors. John Wiley & Sons, Inc.; Hoboken: 2010. pp. 319–349. [DOI] [PubMed] [Google Scholar]
- 9.Michalet X, Pinaud FF, Bentolila LA, Tsay JM, Doose S, Li JJ, Sundaresan G, Wu AM, Gambhir SS, Weiss S. Science. 2005;307:538–544. doi: 10.1126/science.1104274. [DOI] [PMC free article] [PubMed] [Google Scholar]
- 10.Medintz IL, Uyeda HT, Goldman ER, Mattoussi H. Nat Mater. 2005;4:435–446. doi: 10.1038/nmat1390. [DOI] [PubMed] [Google Scholar]
- 11.Resch-Genger U, Grabolle M, Cavaliere-Jaricot S, Nitschke R, Nann T. Nat Methods. 2008;5:763–775. doi: 10.1038/nmeth.1248. [DOI] [PubMed] [Google Scholar]
- 12.Kim JH, Park K, Nam HY, Lee S, Kim K, Kwon IC. Prog Polym Sci. 2007;32:1031–1053. [Google Scholar]
- 13.Zipfel WR, Williams RM, Webb WW. Nat Biotechnol. 2003;21:1369–1377. doi: 10.1038/nbt899. [DOI] [PubMed] [Google Scholar]
- 14.He GS, Tan LS, Zheng Q, Prasad PN. Chem Rev. 2008;108:1245–1330. doi: 10.1021/cr050054x. [DOI] [PubMed] [Google Scholar]
- 15.Pawlicki M, Collins H, Denning R, Anderson H. Angew Chem Int Ed. 2009;48:3244–3266. doi: 10.1002/anie.200805257. [DOI] [PubMed] [Google Scholar]
- 16.Larson DR, Zipfel WR, Williams RM, Clark SW, Bruchez MP, Wise FW, Webb WW. Science. 2003;300:1434–1436. doi: 10.1126/science.1083780. [DOI] [PubMed] [Google Scholar]
- 17.Wang H, Huff TB, Zweifel DA, He W, Low PS, Wei A, Cheng JX. Proc Natl Acad Sci USA. 2005;102:15752–15756. doi: 10.1073/pnas.0504892102. [DOI] [PMC free article] [PubMed] [Google Scholar]
- 18.Park K, Lee S, Kang E, Kim K, Choi K, Kwon IC. Adv Funct Mater. 2009;19:1553–1566. [Google Scholar]
- 19.Kim J, Piao Y, Hyeon T. Chem Soc Rev. 2009;38:372–390. doi: 10.1039/b709883a. [DOI] [PubMed] [Google Scholar]
- 20.Shi D. Adv Funct Mater. 2009;19:3356–3373. [Google Scholar]
- 21.McCarthy JR, Weissleder R. Adv Drug Deliv Rev. 2008;60:1241–1251. doi: 10.1016/j.addr.2008.03.014. [DOI] [PMC free article] [PubMed] [Google Scholar]
- 22.Jun Yw, Lee JH, Cheon J. Angew Chem Int Ed. 2008;47:5122–5135. doi: 10.1002/anie.200701674. [DOI] [PubMed] [Google Scholar]
- 23.Mulder WJM, Griffioen AW, Strijkers GJ, Cormode DP, Nicolay K, Fayad ZA. Nanomedicine. 2007;2:307–324. doi: 10.2217/17435889.2.3.307. [DOI] [PubMed] [Google Scholar]
- 24.Cheon J, Lee JH. Acc Chem Res. 2008;41:1630–1640. doi: 10.1021/ar800045c. [DOI] [PubMed] [Google Scholar]
- 25.Danielli A, Arie A, Porat N, Ehrlich M. Opt Express. 2008;16:19253–19259. doi: 10.1364/oe.16.019253. [DOI] [PubMed] [Google Scholar]
- 26.Danielli A, Porat N, Arie A, Ehrlich M. Biosens Bioelectron. 2009;25:858–863. doi: 10.1016/j.bios.2009.08.047. [DOI] [PubMed] [Google Scholar]
- 27.Danielli A, Porat N, Ehrlich M, Arie A. Curr Pharm Biotechnol. 2010;11:128–137. doi: 10.2174/138920110790725375. [DOI] [PubMed] [Google Scholar]
- 28.Anker JN, Kopelman R. Appl Phys Lett. 2003;82:1102–1104. [Google Scholar]
- 29.Anker JN, Behrend C, Kopelman R. J Appl Phys. 2003;93:6698–6700. [Google Scholar]
- 30.McNaughton BH, Kehbein KA, Anker JN, Kopelman R. J Phys Chem B. 2006;110:18958–18964. doi: 10.1021/jp060139h. [DOI] [PubMed] [Google Scholar]
- 31.Anker JN, Behrend CJ, Huang H, Kopelman R. J Magn Magn Mater. 2005;293:655–662. [Google Scholar]
- 32.Roberts TG, Anker JN, Kopelman R. J Magn Magn Mater. 2005;293:715–724. [Google Scholar]
- 33.Sönnichsen C, Alivisatos AP. Nano Lett. 2005;5:301–304. doi: 10.1021/nl048089k. [DOI] [PubMed] [Google Scholar]
- 34.Hao E, Bailey RC, Schatz GC, Hupp JT, Li S. Nano Lett. 2004;4:327–330. [Google Scholar]
- 35.Nehl CL, Liao H, Hafner JH. Nano Lett. 2006;6:683–688. doi: 10.1021/nl052409y. [DOI] [PubMed] [Google Scholar]
- 36.Hao F, Nehl CL, Hafner JH, Nordlander P. Nano Lett. 2007;7:729–732. doi: 10.1021/nl062969c. [DOI] [PubMed] [Google Scholar]
- 37.Lyon JL, Fleming DA, Stone MB, Schiffer P, Williams ME. Nano Lett. 2004;4:719–723. [Google Scholar]
- 38.Xu Z, Hou Y, Sun S. J Am Chem Soc. 2007;129:8698–8699. doi: 10.1021/ja073057v. [DOI] [PubMed] [Google Scholar]
- 39.Wang L, Park HY, Lim SII, Schadt MJ, Mott D, Luo J, Wang X, Zhong CJ. J Mater Chem. 2008;18:2629–2635. [Google Scholar]
- 40.Wang L, Bai J, Li Y, Huang Y. Angew Chem Int Ed. 2008;47:2439–2442. doi: 10.1002/anie.200800014. [DOI] [PubMed] [Google Scholar]
- 41.Levin CS, Hofmann C, Ali TA, Kelly AT, Morosan E, Nordlander P, Whitmire KH, Halas NJ. ACS Nano. 2009;3:1379–1388. doi: 10.1021/nn900118a. [DOI] [PMC free article] [PubMed] [Google Scholar]
- 42.Yu H, Chen M, Rice PM, Wang SX, White RL, Sun S. Nano Lett. 2005;5:379–382. doi: 10.1021/nl047955q. [DOI] [PubMed] [Google Scholar]
- 43.Shi W, Zeng H, Sahoo Y, Ohulchanskyy TY, Ding Y, Wang ZL, Swihart M, Prasad PN. Nano Lett. 2006;6:875–881. doi: 10.1021/nl0600833. [DOI] [PubMed] [Google Scholar]
- 44.Choi Js, Jun Yw, Yeon SI, Kim HC, Shin JS, Cheon J. J Am Chem Soc. 2006;128:15982–15983. doi: 10.1021/ja066547g. [DOI] [PubMed] [Google Scholar]
- 45.Choi SH, Na HB, Park YI, An K, Kwon SG, Jang Y, Park Mh, Moon J, Son JS, Song IC, Moon WK, Hyeon T. J Am Chem Soc. 2008;130:15573–15580. doi: 10.1021/ja805311x. [DOI] [PubMed] [Google Scholar]
- 46.Lee J, Hasan W, Lee MH, Odom TW. Adv Mater. 2007;19:4387–4391. [Google Scholar]
- 47.Liu GL, Lu Y, Kim J, Doll JC, Lee LP. Adv Mater. 2005;17:2683–2688. [Google Scholar]
- 48.Wei Q, Song HM, Leonov AP, Hale JA, Oh D, Ong QK, Ritchie K, Wei A. J Am Chem Soc. 2009;131:9728–9734. doi: 10.1021/ja901562j. [DOI] [PMC free article] [PubMed] [Google Scholar]
- 49.Song HM, Wei Q, Ong QK, Wei A. ACS Nano. 2010 doi: 10.1021/nn101202h. [DOI] [PMC free article] [PubMed] [Google Scholar]
- 50.Aaron JS, Oh J, Larson TA, Kumar S, Milner TE, Sokolov KV. Opt Express. 2006;14:12930–12943. doi: 10.1364/oe.14.012930. [DOI] [PubMed] [Google Scholar]
- 51.Fujimoto JG. Nat Biotechnol. 2003;21:1361–1367. doi: 10.1038/nbt892. [DOI] [PubMed] [Google Scholar]
- 52.Zysk AM, Nguyen FT, Oldenburg AL, Marks DL, Boppart SA. J Biomed Opt. 2007;12:051403. doi: 10.1117/1.2793736. [DOI] [PubMed] [Google Scholar]
- 53.Oldenburg AL, Hansen MN, Zweifel DA, Wei A, Boppart SA. Opt Express. 2006;14:6724–6738. doi: 10.1364/oe.14.006724. [DOI] [PubMed] [Google Scholar]
- 54.Troutman TS, Barton JK, Romanowski M. Opt Lett. 2007;32:1438–1440. doi: 10.1364/ol.32.001438. [DOI] [PubMed] [Google Scholar]
- 55.Gobin AM, Lee MH, Halas NJ, James WD, Drezek RA, West JL. Nano Lett. 2007;7:1929–1934. doi: 10.1021/nl070610y. [DOI] [PubMed] [Google Scholar]
- 56.Cang H, Sun T, Li ZY, Chen J, Wiley BJ, Xia Y, Li X. Opt Lett. 2005;30:3048–3050. doi: 10.1364/ol.30.003048. [DOI] [PubMed] [Google Scholar]
- 57.Oldenburg AL, Hansen MN, Ralston TS, Wei A, Boppart SA. J Mater Chem. 2009;19:6407–6411. doi: 10.1039/b823389f. [DOI] [PMC free article] [PubMed] [Google Scholar]
- 58.Oldenburg AL, Gunther JR, Boppart SA. Opt Lett. 2005;30:747–749. doi: 10.1364/ol.30.000747. [DOI] [PubMed] [Google Scholar]
- 59.Oldenburg AL, Toublan F, Suslick K, Wei A, Boppart SA. Opt Express. 2005;13:6597–6614. doi: 10.1364/opex.13.006597. [DOI] [PubMed] [Google Scholar]
- 60.John R, Rezaeipoor R, Adie SG, Chaney EJ, Oldenburg AL, Marjanovic M, Haldar JP, Sutton BP, Boppart SA. Proc Natl Acad Sci USA. 2010;107:8085–8090. doi: 10.1073/pnas.0913679107. [DOI] [PMC free article] [PubMed] [Google Scholar]
- 61.Oldenburg AL, Crecea V, Rinne SA, Boppart SA. Opt Express. 2008;16:11525–11539. [PMC free article] [PubMed] [Google Scholar]
- 62.Oh J, Feldman MD, Kim J, Kang HW, Sanghi P, Milner TE. Laser Surg Med. 2007;39:266–272. doi: 10.1002/lsm.20473. [DOI] [PubMed] [Google Scholar]
- 63.Oh J, Feldman MD, Kim J, Sanghi P, Do D, Mancuso JJ, Kemp N, Cilingiroglu M, Milner TE. J Biomed Opt. 2008;13:054006. doi: 10.1117/1.2985762. [DOI] [PubMed] [Google Scholar]
- 64.Kim J, Oh J, Milner TE, Nelson JS. Opt Lett. 2006;31:778–780. doi: 10.1364/ol.31.000778. [DOI] [PubMed] [Google Scholar]
- 65.Kim J, Oh J, Milner TE, Nelson JS. Nanotechnology. 2007;18:035504. doi: 10.1088/0957-4484/18/3/035504. [DOI] [PubMed] [Google Scholar]
- 66.Jin Y, Jia C, Huang SW, O'Donnell M, Gao X. Nature Commun. 2010;1:41. doi: 10.1038/ncomms1042. [DOI] [PMC free article] [PubMed] [Google Scholar]
- 67.Oh J, Feldman MD, Kim J, Condit C, Emelianov S, Milner TE. Nanotechnology. 2006;17:4183–4190. doi: 10.1088/0957-4484/17/16/031. [DOI] [PubMed] [Google Scholar]
- 68.Liang X, Oldenburg AL, Crecea V, Chaney EJ, Boppart SA. Opt Express. 2008;16:11052–11065. doi: 10.1364/oe.16.011052. [DOI] [PMC free article] [PubMed] [Google Scholar]
- 69.Crecea V, Oldenburg AL, Liang X, Ralston TS, Boppart SA. Opt Express. 2009;17:23114–23122. doi: 10.1364/OE.17.023114. [DOI] [PMC free article] [PubMed] [Google Scholar]
- 70.Raymo FM, Tomasulo M. J Phys Chem A. 2005;109:7343–7352. doi: 10.1021/jp052440o. [DOI] [PubMed] [Google Scholar]
- 71.Yildiz I, Deniz E, Raymo FM. Chem Soc Rev. 2009;38:1859–1867. doi: 10.1039/b804151m. [DOI] [PubMed] [Google Scholar]
- 72.Lippincott-Schwartz J, Altan-Bonnet N, Patterson GH. Nat Cell Biol. 2003;5:S7–S14. [PubMed] [Google Scholar]
- 73.Lukyanov KA, Chudakov DM, Lukyanov S, Verkhusha VV. Nat Rev Mol Cell Biol. 2005;6:885–891. doi: 10.1038/nrm1741. [DOI] [PubMed] [Google Scholar]
- 74.Wu W, Li ADQ. Nanomedicine. 2007;2:523–531. doi: 10.2217/17435889.2.4.523. [DOI] [PubMed] [Google Scholar]
- 75.Tian Z, Wu W, Li ADQ. ChemPhysChem. 2009;10:2577–2591. doi: 10.1002/cphc.200900492. [DOI] [PubMed] [Google Scholar]
- 76.Betzig E, Patterson GH, Sougrat R, Lindwasser OW, Olenych S, Bonifacino JS, Davidson MW, Lippincott-Schwartz J, Hess HF. Science. 2006;313:1642–1645. doi: 10.1126/science.1127344. [DOI] [PubMed] [Google Scholar]
- 77.Hess ST, Girirajan TPK, Mason MD. Biophys J. 2006;91:4258–4272. doi: 10.1529/biophysj.106.091116. [DOI] [PMC free article] [PubMed] [Google Scholar]
- 78.Rust MJ, Bates M, Zhuang X. Nat Methods. 2006;3:793–795. doi: 10.1038/nmeth929. [DOI] [PMC free article] [PubMed] [Google Scholar]
- 79.Hu D, Tian Z, Wu W, Wan W, Li ADQ. J Am Chem Soc. 2008;130:15279–15281. doi: 10.1021/ja805948u. [DOI] [PMC free article] [PubMed] [Google Scholar]
- 80.Dertinger T, Colyer R, Iyer G, Weiss S, Enderlein J. Proc Natl Acad Sci USA. 2009;106:22287–22292. doi: 10.1073/pnas.0907866106. [DOI] [PMC free article] [PubMed] [Google Scholar]
- 81.Richards CI, Hsiang JC, Senapati D, Patel S, Yu J, Vosch T, Dickson RM. J Am Chem Soc. 2009;131:4619–4621. doi: 10.1021/ja809785s. [DOI] [PMC free article] [PubMed] [Google Scholar]
- 82.Richards CI, Hsiang JC, Dickson RM. J Phys Chem B. 2010;114:660–665. doi: 10.1021/jp909167j. [DOI] [PMC free article] [PubMed] [Google Scholar]
- 83.Richards CI, Hsiang JC, Khalil AM, Hull NP, Dickson RM. J Am Chem Soc. 2010;132:6318–6323. doi: 10.1021/ja100175r. [DOI] [PMC free article] [PubMed] [Google Scholar]
- 84.Link S, El-Sayed MA. Int Rev Phys Chem. 2000;19:409–453. [Google Scholar]
- 85.Link S, El-Sayed MA. Annu Rev Phys Chem. 2003;54:331–366. doi: 10.1146/annurev.physchem.54.011002.103759. [DOI] [PubMed] [Google Scholar]
- 86.Huang X, Jain P, El-Sayed I, El-Sayed M. Lasers Med Sci. 2007;23:217–228. doi: 10.1007/s10103-007-0470-x. [DOI] [PubMed] [Google Scholar]
- 87.Boyer D, Tamarat P, Maali A, Lounis B, Orrit M. Science. 2002;297:1160–1163. doi: 10.1126/science.1073765. [DOI] [PubMed] [Google Scholar]
- 88.Skala MC, Crow MJ, Wax A, Izatt JA. Nano Lett. 2008;8:3461–3467. doi: 10.1021/nl802351p. [DOI] [PMC free article] [PubMed] [Google Scholar]
- 89.Adler DC, Huang SW, Huber R, Fujimoto JG. Opt Express. 2008;16:4376–4393. doi: 10.1364/oe.16.004376. [DOI] [PubMed] [Google Scholar]
- 90.Zhou C, Tsai TH, Adler DC, Lee HC, Cohen DW, Mondelblatt A, Wang Y, Connolly JL, Fujimoto JG. Opt Lett. 2010;35:700–702. doi: 10.1364/OL.35.000700. [DOI] [PMC free article] [PubMed] [Google Scholar]
- 91.Paranjape AS, Kuranov R, Baranov S, Ma LL, Villard JW, Wang T, Sokolov KV, Feldman MD, Johnston KP, Milner TE. Biomed Opt Express. 2010;1:2–16. doi: 10.1364/BOE.1.000002. [DOI] [PMC free article] [PubMed] [Google Scholar]
- 92.Marriott G, Mao S, Sakata T, Ran J, Jackson DK, Petchprayoon C, Gomez TJ, Warp E, Tulyathan O, Aaron HL, Isacoff EY, Yan Y. Proc Natl Acad Sci USA. 2008;105:17789–17794. doi: 10.1073/pnas.0808882105. [DOI] [PMC free article] [PubMed] [Google Scholar]
- 93.ImageJ is an open-source image processing program supported by the U. S. National Institutes of Health. It can be obtained free of charge at: http://rsb.info.nih.gov/ij.
- 94.Reed J, Ramakrishnan S, Schmit J, Gimzewski JK. ACS Nano. 2009;3:2090–2094. doi: 10.1021/nn900473y. [DOI] [PMC free article] [PubMed] [Google Scholar]


