

Abstract
The role of intracellular organelles in Ca2+ homeostasis was studied in salamander rod and cone photoreceptors under conditions that simulate photoreceptor activation by darkness and light. Sustained depolarization evoked a Ca2+ gradient between the cell body and ellipsoid regions of the inner segment (IS). The standing pattern of calcium fluxes was created by interactions between the plasma membrane, endoplasmic reticulum (ER), and mitochondria. Pharmacological experiments suggested that mitochondria modulate both baseline [Ca2+]i in hyperpolarized cells as well as kinetics of Ca2+ entry via L type Ca2+ channels in cell bodies and ellipsoids of depolarized rods and cones. Inhibition of mitochondrial Ca2+ sequestration by antimycin/oligomycin caused a three-fold reduction in the amount of Ca2+ accumulated into intracellular organelles in both cell bodies and ellipsoids. A further 50% decrease in intracellular Ca2+ content within cell bodies, but not ellipsoids, was observed after suppression of SERCA-mediated Ca2+ uptake into the ER. Inhibition of Ca2+ sequestration into the endoplasmic reticulum by thapsigargin or cyclopiazonic acid decreased the magnitude and kinetics of depolarization-evoked Ca2+ signals in cell bodies of rods and cones and decreased the amount of Ca2+ accumulated into internal stores. These results suggest that steady-state [Ca2+]i in photoreceptors is regulated in a region-specific manner, with the ER contribution predominant in the cell body and mitochondrial buffering [Ca2+] the ellipsoid. Local [Ca2+]i levels are set by interactions between the plasma membrane Ca2+ channels and transporters, ER and mitochondria. Mitochondria are likely to play an essential role in temporal and spatial buffering of photoreceptor Ca2+.
Keywords: Retina, Inner segment, Mitochondria, Endoplasmic reticulum, Tiger salamander
Introduction
Calcium regulation lies at the heart of photoreceptor signaling. Phototransduction, membrane excitability, energy metabolism, cytoskeletal dynamics, and transmitter release are all modulated by changes in intracellular Ca2+ concentration [Ca2+]i (reviewed in Fain et al., 2001; Križaj & Copenhagen, 2002; Heidelberger et al., 2005). Ca2+ enters photoreceptor cytosol through plasma membrane channels and by Ca2+ release from the endoplasmic reticulum (ER) (Bader et al., 1982; Rieke & Schwartz, 1994; Križaj et al., 2003; Zhang & Townes-Anderson, 2002). In acute and inherited retinal diseases, excessive Ca2+ influx causes pathological increases in the intracellular calcium concentration [Ca2+]i which could be instrumental in the triggering of apoptosis (Chang et al., 1993; Donovan & Cotter, 2002; Doonan et al., 2005). Intracellular organelles such as the ER and mitochondria play a central role in the initiation, maintenance, and prevention of the neuronal apoptotic process by hosting pro- and anti-apoptotic proteins such as Bcl-2, Bax and Bid, and by regulating [Ca2+]i levels during the Ca2+ overload (Babcock & Hille, 1998; Duchen, 1999; Hajnoczky et al., 2003; Mattson & Chan, 2003). Suppression of Ca2+ sequestration into the ER induces degeneration of developing rod photoreceptors (Chiarini et al., 2003), whereas antagonists of Ca2+release from stores have protective functions. Presently, little is known about Ca2+ storage capacities of intracellular compartments in rods and cones, their role in creating [Ca2+]i overload and their interactions with plasma membrane Ca2+ influx and extrusion systems. While Ca2+ sequestration into ER stores plays a crucial role in tonic neurotransmitter release (Križaj et al., 1999; Suryanarayanan & Slaughter, 2006; Cadetti et al., 2006), depletion of ryanodine-sensitive Ca2+ stores empties only a fraction of the total accumulated Ca2+ in rods (Križaj et al., 2003). This suggests that photoreceptors contain another, major and previously unidentified, class of intracellular Ca2+ store.
Here we tested the hypothesis that mitochondria, an organelle localized at extremely high densities in the ellipsoid region of the inner segment (IS; Mariani, 1986; Hoang et al., 2002), are responsible for regulating the second component of intracellular Ca2+ sequestration in rods and cones. We took advantage of the highly region-specific localization of ER and mitochondria in the photoreceptor inner segment (IS), to analyze Ca2+accumulation into the mitochondria and ER in the cell body and ellipsoid regions, and to study interactions between the plasma membrane and intracellular stores. Our data suggests that Ca2+-induced Ca2+ release from the ER acts in tandem with passive Ca2+ accumulation and release from the mitochondria to modulate the time course and amplitude of depolarization-evoked [Ca2+]i signals in different regions of the photoreceptor IS.
Materials and methods
Preparation of isolated cells
Larval stage tiger salamanders (Ambystoma tigrinum) were decapitated and pithed using procedures approved outlined by U.S. National Institutes of Health, The Society for Neuroscience and approved by the Committee on Animal Research at University of California San Francisco. Dissociated photoreceptors were prepared following slight modification of protocols described previously (Križaj & Copenhagen, 1998). Briefly, retinas were dissected from enucleated eyes and incubated in 0 Ca2+/papain (7 U/ml; Worthington, Freehold, NJ) saline for 20–30 min at room temperature (20–22°C). Enzyme-treated retinas were washed with L15 (Leibovitz’s culture medium, Gibco-Invitrogen, Carlsbad, CA), cut into pieces and incubated in L15. Prior to experiments, individual pieces of tissue were triturated with a 100 × l μl pipette in which the tip has been cut off with a razor blade. Cells were plated onto coverslips coated with 0.2 mg/ml concanavalin A (Sigma, St. Louis, MO). Salamander retina contains at least four classes of cones (Mariani, 1986). All cones studied here responded to pharmacological manipulations in an identical manner. Viability of isolated cone ellipsoids was tested by 30– 60 s incubation with 0.01% toluidine blue. The dye was excluded from isolated ellipsoids, suggesting that these IS subregions reseal and form viable compartments following dissociation. The recording chamber was superfused via two multi-inlet manifolds (MP-8, Warner Instruments, Hamden, CT). Control saline solution contained, in mM, 97 NaCl, 2 KCl, 2 CaCl2, 2 MgCl2, 10 HEPES, 20 glucose, 1 pyruvic acid, 2 lactic acid, 0.3 ascorbic acid, and 1 taurine at 240 mOsm. pH was adjusted to 7.6 with NaOH. To block Ca2+ uptake into the mitochondrial matrix, the mitochondrial membrane potential Ψm was depolarized with antimycin A1 (10 μM), which inhibits the complex III of the electron transport chain. The reduction in Ψm blocks the driving force for passive Ca2+ entry via the uniporter as well as the proton motive force that drives ATP synthesis via the complex V (F1F0 ATP synthetase). Exposure to antimycin has little effect on cell morphology. To prevent extra ATP hydrolysis resulting from reversal of F1F0 ATP synthetase and to ensure complete depolarization, the complex V was suppressed by oligomycin (10 μM) added to all solutions containing antimycin. Control experiments were also performed in saline solutions containing oligomycin alone to measure the effect of inhibiting ATP production without changes in Ψmit. As described later in the text, oligomycin alone had no effect on baseline [Ca2+]i, the magnitude of Ca2+ stores in mitochondria or the magnitude of depolarization-evoked [Ca2+]i signals. To additionally stimulate glycolysis through the Pasteur effect, glucose concentration in all solutions was increased to 20 mM (e.g., Winkler et al., 2003). All drugs were obtained from Sigma. At least three animals for each experiment were used; several runs using different coverslips (at least three, usually more than five) were made from each eye. An exception is the data for antimycin-treated isolated ellipsoids stimulated with 30 mM K. This data comes from two animals (that is, four eyes).
Free [Ca2+]i measurement and data acquisition
These methods are fully described elsewhere (Križaj & Copenhagen, 1998). Briefly, photoreceptors were loaded with 2–5 μM fura-2 AM (Fura 2-acetoxymethylester; Molecular Probes, Carlsbad, CA)for 10 min and subsequently washed for 20 min. Regions of interest (ROI) defined the cell body and ellipsoid regions, respectively. The size of the ROI was ~ 20 μm2 for the cell body and ~10 μm2 for the ellipsoid. The fluorescence signals were acquired on an inverted microscope (Nikon Eclipse 200) using a dry 40× objective (N.A. = 0.8) or an oil 100× objective (N.A. = 1.2). Image acquisition was run at 0.3–2 Hz by a cooled 12 bit digital CCD camera (Cascade, Photometrics, Tucson, AZ). The camera and the shutter (DG-4, Sutter Instruments, Novato, CA) were controlled by commercial software (Metafluor 6.1; Molecular Devices, Sunnyvale, CA). Ratios between the 340 nm and 380 nm excitation wavelengths were calculated after subtraction of background fluorescence. Free Ca2+ levels were calibrated in situ with 10 μM ionomycin using the standard relationship; Kd for Ca2+ binding to fura-2 was taken to be 224 nM (Almers & Neher, 1985; Neher, 1995). The four groups of cells (control; antimycin/oligomycin, thapsigargin and antimycin/oligomycin+ thapsigargin) were incubated in 0 Ca until the 340/380 ratio signal reached a stable minimum, which typically took 2–3 min.
To test for potential compartmentalization of fura-2 dye within the mitochondria and other intracellular organelles, fura-2-loaded cells were depolarized with 20 mM KCl together with 2 mM Mn2+. More than 95% of the fura-2 signal was quenched by exposure to Mn2+, indicating that most of the dye was cytoplasmic (data not shown). Data for uncalibrated cells is presented as 340/380 nm ratios. The decay time constants were calculated by fitting single exponentials to the decrease in [Ca2+]i following exposure to KCl (e.g., Križaj & Copenhagen, 1998). [Ca2+]i rise times (which equal the rate of entry minus the rate of clearance) were estimated by fitting the rising phase with linear fits (Igor Pro, Wavemetrics, Lake Oswego, OR). All pooled data are presented as mean ± S.E.M.
For MitoTracker staining, cells were labeled for 15 min in 0.5–1 μM solutions of MitoTracker Red or 200 nM MitoTracker Green (Molecular Probes). The two dyes bind to the inner mitochondrial membrane and fluoresces independently of [Ca2+]mit or Ψm, thus providing a marker for mitochondrial localization. TMRM, a mitochondrial indicator dye, which fluoresces at negative membrane potentials, was used at 100 nM; dye loading was 30 min. TMRM fluorescence was analyzed using the 594 nm line of the confocal microscope (LSM5 Pascal, Zeiss, Tarrytown, NY).
Statistics
The significance of results from experiments on two independent populations of cells was established with the standard t-test. The significance of drug treatment on the same population of cells was determined with the paired t-test. The significance of means of three different treatments was determined with one-way ANOVA and the Bonferrioni’s posthoc test. The degree of significance is indicated by asterisks (*p < 0.05; **p < 0.001; ***p < 0.0001). Error bars represent S.E.M.
Results
The aim of this report is to examine regulation of intracellular free Ca2+ in vertebrate rods and cones. Spatial and temporal dynamics of depolarization-evoked [Ca2+]i responses were studied by Ca2+ imaging using photoreceptors isolated from the tiger salamander retina. According to a simple compartmental model, photoreceptors consist of two anatomically and functionally distinct segments—an outer segment (OS) that hosts the phototransduction cascades and an “inner segment” (IS) comprised of the ellipsoid, cell body and the synaptic terminal. The non-OS regions are traversed by contiguous cisternae of smooth ER extending between the synaptic terminal and the cell body, whereas the ellipsoid itself is packed with mitochondria (Nilsson, 1985; Mercurio & Holtzman, 1982; Hoang et al., 2002). These studies focused on Ca2+ regulation in the cell body and ellipsoid regions that contain the two classes of Ca2+ store (Nilsson, 1985; Mercurio & Holtzman, 1982; Townes-Anderson et al., 1985).
Ca2+ release from ER stores modulates the amplitude and timing of [Ca2+]i signals
[Ca2+] signals evoked by depolarization and release from ER stores are invariably larger and faster in the photoreceptor cell body compared to the ellipsoid. This is illustrated in Fig. 1 for hyperpolarized and depolarized rods. The hyperpolarized light-adapted cell in Fig. 1A was stimulated with 128 ms puffs of high K+, evoking transient [Ca2+]i increases due to activation of voltage-operated Ca2+ channels. The amplitude of depolarization-evoked [Ca2+]i transients was ~40% higher in the cell body compared to the ellipsoid. Exposure to caffeine, an agonist of the ryanodine class of intracellular Ca2+ release channels, triggered a transient [Ca2+]i response due to Ca2+ release from the ER. CICR was followed by SERCA-mediated sequestration of Ca2+ into ER cisternae, seen as a decrease in baseline [Ca2+]i following caffeine removal and marked by arrowhead in Fig. 1A (see also Križaj et al., 2003; Fig. 7). Similar amplitude differences in responses of IS subdomains to caffeine were observed in all hyperpolarized rods studied (n > 50). The onset of the rod response to caffeine and the response to depolarization were the same in the cell body as in the ellipsoid (P = 0.0103; n = 17). However, the normalized response rise time in the cell body was faster from that observed in the ellipsoid by 4.68 ±1.29 s (n = 17; P = 0.00523). The time-to-peak was 44.76 ± 3.32 s for the cell body and 54.58 ± 4.49 s for the ellipsoid (P < 0.005). Caffeine responses were not studied in cones as Ca2+, released from cone ER stores, is extruded before it is captured by optical dyes (Križaj et al., 2003).
Fig. 1.

Regional [Ca2+]i differences in response to depolarization. (A) Rod photoreceptor stimulated with 128 ms puffs of 90 mM KCl. The amplitude of free [Ca2+]i in the cell body is higher than in the ellipsoid. Superfusion with 10 mM caffeine differentially raises [Ca2+]i in the cell body (solid line) versus the ellipsoid (dotted line). Return to control saline causes a [Ca2+]i undershoot due to SERCA activation (arrowhead). (B). Rod photoreceptor continuously superfused with 20 mM KCl. [Ca2+]i represented as 340/380 nm ratio. Panels a–e: 20 mM KCl elevates [Ca2+]i throughout the cell, with larger sustained [Ca2+]i levels in the cell body (blue circle) compared to the ellipsoid (yellow ellipse). (b) τ = 7.2 s. Following caffeine application, [Ca2+]i increases in the cell body disproportionately to the ellipsoid. (c) τ = 19.2 s. Delayed [Ca2+]i elevation in the ellipsoid. (d) τ = 27.6 s. [Ca2+]i decrease in the cell body and ellipsoid occurs in the presence of caffeine. (e) τ = 132 s. Washout.
Fig. 7.

Kinetics of depolarization-evoked [Ca2+]i responses in rods and cones in the presence of SERCA and Ψmit antagonists. (A) Cones. Rise times of depolarization-evoked responses in isolated cone ellipsoids, intact cone ellipsoids and cell bodies during depolarization with 30 mM KCl in control saline (“Cont” = high KCl control response), in the presence of antimycin/oligomycin (“A”) and in the presence of antimycin/oligomycin and thapsigargin (“A + TG”). (B) Rods. Rise times of depolarization-evoked responses in rod ellipsoids and cell bodies during depolarization with 30 mM KCl in control saline, in antimycin/oligomycin and in antimycin/oligomycin and thapsigargin. (C, D) Decay time constants of depolarization-evoked responses in cone and rod ellipsoids and cell bodies during depolarization with 30 mM KCl in control saline, in antimycin/oligomycin and in antimycin/oligomycin and thapsigargin. Inset above panel A: cone IS response to depolarization. Rise times estimated with a linear fit, decay times with a single exponential fit (thick traces).
[Ca2+]i levels in perikarya of cells continually depolarized with 20 mM KCl were consistently elevated in comparison to the ellipsoid. [Ca2+]i in depolarized rods is high in the cytosol sandwiched between the nucleus and the plasma membrane, as well as in the subellipsoid space; lower [Ca2+]i was detected within the areas comprising nucleus itself and the ellipsoid (Fig. 1B). Below we analyze how Ca2+ influx through plasma membrane channels of depolarized cells is amplified and modulated by release from stores and how accumulation into and release of Ca2+ from intracellular stores contributes to the amplitude and kinetics of [Ca2+]i responses in rods and cones.
Modulation of IS [Ca2+]i signals by CICR is domain-specific
To determine the relative weight of ER-based Ca2+ release in the cell body and the ellipsoid, release from ryanodine and/or InsP3 stores was blocked with inhibitors of sarcoplasmic-endoplasmic Ca2+ ATPase (SERCA)-mediated Ca2+ sequestration (Inesi & Sagara, 1994; Uyama et al., 1992; Demaurex et al., 1992; Treiman et al., 1998). Cells were depolarized with 30 mM KCl and exposed to SERCA blockers cyclopiazonic acid (CPA) or thapsigargin in order to deplete ER stores and prevent the positive feedback by CICR. 5 μM CPA suppressed the amplitude of depolarization-evoked Ca2+ responses in cell bodies of rods to 66 ± 6% (n = 6; p < 0.05) but had less effect in the ellipsoid (decrease to 88 ±3%, not significant; Fig. 2). A decrease in the amplitude of depolarization-evoked [Ca2+]i responses was also observed in cone cell bodies (67 ±8%; P = 0.056) and ellipsoids (79 ±5%) (n = 10). Similar results were observed following exposure to 1 μM thapsigargin. 10 min incubation with thapsigargin decreased the amplitude of K+–evoked responses in rod cell bodies from 1172 ± 53 nM to 673 ± 226 nM (n = 6, P < 0.05). Thapsigargin alone had no significant effect on ellipsoid [Ca2+]i (943 ± 43 nM and 836 ± 186 nM in control and thapsigargin-treated cells, respectively, n = 5, P > 0.05). This data suggests that Ca2+ release from ER stores via CICR (Ca2+-induced Ca2+ release) exhibits spatial heterogeneity, with significant contribution to the cell body of rods but a relatively modest role in ellipsoid [Ca2+]i. Effects of CICR inhibition on the amplitude of sustained depolarization-evoked [Ca2+]i responses in cone cell bodies were statistically not significant, suggesting CICR plays a more prominent role in rod, than cone, perikarya.
Fig. 2.

Rod photoreceptor. Cyclopiazonic acid (CPA; 5 μM) reduces he amplitude of KCl-evoked transients in the cell body but not the ellipsoid. (A) High K+ (30 mM)-triggered [Ca2+]i elevation in the cell body (continuous trace) and the ellipsoid (dotted trace). (B, C) Summary of data for CPA exposures in rod and cone cell bodies and ellipsoids for baseline [Ca2+]i (B) and 30 mM KCl-evoked [Ca2+]i responses. CPA reduced the amplitude of depolarization-evoked [Ca2+]i responses in rod cell bodies (P < 0.05) and cone cell bodies (P = 0.056).
Photoreceptor mitochondria can accumulate Ca2+
Mitochondria were previously implicated in Ca2+ overload and photoreceptor apoptosis (He et al., 2000). The ellipsoid, easily identified by the electron dense globule formed by mitochondria, is packed with mitochondria (Hoang et al., 2002)and consequently stains well with mitochondrial markers such as the MitoTracker dyes (Figs. 3B and 3D) or rhodamine-based membrane potential dyes such as TMRM (Figs. 3F and 3G). To ascertain whether mitochondria can sequester free Ca2+ we used pharmacological agents that inhibit mitochondrial Ca2+ uptake. Ca2+ content of ellipsoid stores was determined by using a cocktail consisting of antimycin (10 μM) A1 and oligomycin (10 μM). Antimycin inhibits the electron transport between cytochrome b and c1 in the respiratory chain whereas oligomycin prevents depletion of ATP by blocking reversal of the F1/F0 ATP synthase in the inner mitochondrial membrane. It was necessary to confirm that antimycin indeed dissipates the mitochondrial membrane potential Ψmit in intact ellipsoids. For this purpose, Ψmit was monitored in TMRM-loaded ellipsoids following application of antimycin. As illustrated in Fig. 3G, antimycin/oligomycin caused a rapid reduction in Ψmit within the ellipsoid (n = 12/12 cells). Following exposure to antimycin, TMRM fluorescence irreversibly disappeared within <1 min from all ellipsoids on the coverslip. In contrast, the signals from Mitotracker Green dye co-loaded with TMRM were unaffected by antimycin (data not shown; see also Scaduto & Grotyohann, 1999; Pendergrass et al., 2004). Oligomycin alone had no effect on baseline [Ca2+]i, the amount of Ca2+ stored into the intracellular compartments or the magnitude of depolarization-evoked [Ca2+]i signals (n = 5; data not shown).
Fig. 3.

(A) Transmission image of a cone IS. (B) Same cell, labeled with 200 nM MitoTracker Red (‘MitoRed’). (C) Transmission image of a rod photoreceptor IS. (D) Same cell, labeled with MitoRed. (E) Nomarski image of an intact cone and an isolated cone. (F) Same view, with both cells exposed to TMRM (100 nM). The TMRM dye stains the mitochondria-rich ellipsoid region in the cone intact IS as well as in the isolated ellipsoid. Scale bar = 10 μm. (G) Confocal linescan recording of TMRM fluorescence from a cone ellipsoid exposed to antimycin/oligomycin (8 μM). The cocktail triggers a rapid and irreversible decline in TMRM fluorescence.
The Ca2+ response induced by ionomycin in Ca2+-free saline in the presence of EGTA was used as an estimate of the Ca2+ content of the ER ([Ca2+]ER) before and after exposure to antimycin (e.g., Martin et al., 2002). Resting [Ca2+]i levels in naïve cells in control saline were 44 ± 8 and 57 ± 7 nM for cones and rods, respectively. Perfusion with Ca2+-free saline resulted in a decline in the resting [Ca2+]i to 8 ±1 in cones and 16 ±2 nM in rods. In intact untreated cones, 10 μM ionomycin increased ellipsoid [Ca2+]i by 247 ± 22 nM (n = 11) (Fig. 4A). Following incubation with antimycin/oligomycin, ionomycin increased cone ellipsoid [Ca2+]i by only 77 ±10 nM (n = 7). Comparable results were observed in rods—ionomycin-evoked [Ca2+]i elevations in rod ellipsoids decreased from 298 ±75 nM (n = 9) under control conditions to 44 ± 16 nM (n = 4) after antimycin/oligomycin (Fig. 4B). Interestingly, treatment with antimycin/oligomycin also decreased the perikaryal ionomycin-sensitive pool (Fig. 4).
Fig. 4.
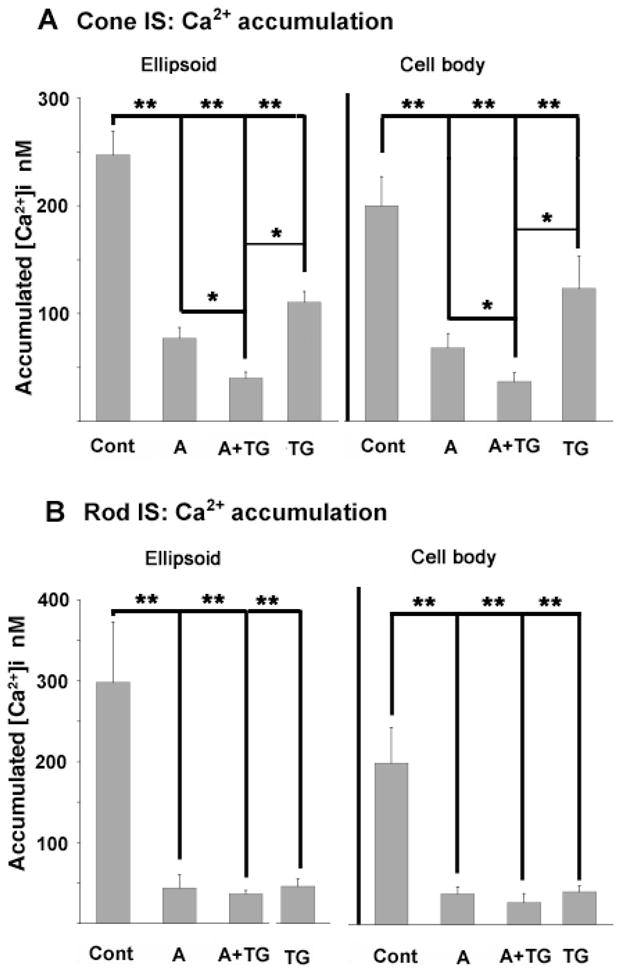
Sequestered mitochondrial and ER Ca2+ pools. Cells were incubated in 0 Ca until the 340/380 ratio signal reached a stable minimum, which typically took 2–3 min. Accumulated residual Ca2+ was released with 10 μM ionomycin in Ca2+-free saline. Intracellular Ca2+ content was measured in naive cells or following exposure to antimycin/oligomycin (“A”); antimycin/oligomycin + thapsigargin- (“A+TG”) and thapsigargin alone (“TG”). The data is presented for cell cohorts studied in separate experiments. (A) Cones. Both antimycin/oligomycin and thapsigargin reduced the amount of accumulated store Ca2+ in ellipsoids and cell bodies. Further reduction in accumulated store [Ca2+]i was observed following combined exposure to antimycin/oligomycin and thapsigargin (“A+TG”). (B) Rods. Intracellular [Ca2+]i content in control saline, antimycin/oligomycin-, thapsigargin- and antimycin/oligomycin + thapsigargin-treated rods. Thapsigargin treatment alone and antimycin/oligomycin alone caused significant reduction in accumulated Ca2+.
To determine the amount of free [Ca2+]i that remains in the ER following inhibition of mitochondrial Ca2+sequestration, antimycin/oligomycin-treated photoreceptors were superfused with thapsigargin (1 μM). Similar to the effects of CPA (Fig. 2), thapsigargin slightly raised baseline [Ca2+]i in the cell body of cones (on average ~13 nM; n = 7, P = 0.085); this increase was ~16 nM (n = 4; P = 0.026) for rods. More pronounced was the effect of thapsigargin on the size of the pool of stored Ca2+ in photoreceptors. In rods, thapsigargin alone decreased the accumulated Ca2+ from 298 ±75 nM to 35 ±12 nM in the cell body and from 201 ± 52 nM to 39 ±8 nM in the ellipsoid. In control cones, thapsigargin lowered accumulated Ca2+ from 247 ± 22 nM and 201 ± 27 nM in the cell body and ellipsoid to 120 ± 29 nM and 110 ±14 nM. Blocking SERCA-mediated Ca2+ sequestration reduced the Ca2+ content in cell bodies and ellipsoids of antimycin/oligomycin-treated photoreceptors, with a significant Ca2+ content reduction in cones. This data suggests that IS ER and mitochondria store pools of Ca2+ that are released with Ca2+ ionophores.
Mitochondria regulate depolarization-evoked [Ca2+]i signals in cell bodies and ellipsoids
Mitochondrial depolarization has been shown to cause a rapid inhibition of L-type Ca2+ currents and a decrease in the amplitude of depolarization-evoked [Ca2+]i increases in chromaffin cells and retinal amacrine cells (Hernandez-Guijo et al., 2001; Medler & Gleason, 2002). Because L-type Ca2+ channels represent the primary entry pathway for Ca2+ into photoreceptor ISs (Rieke & Schwartz, 1994, 1996; Nachman-Clewner et al., 1999; Steele et al., 2005), we investigated the interactions between voltage-gated Ca2+ channels and ellipsoid mitochondria. Ca2+ influx in intact cones was stimulated by depolarization with high K+ in the presence of antimycin/oligomycin. In the presence of the mitochondrial electron chain blocker, 30 mM KCl elicited only 115 ± 15 nM increase in free [Ca2+]i within the ellipsoid, as opposed to 711 ± 82 nM [Ca2+]i elevation in control conditions (n = 13, Fig. 5A; P < 0.001). Likewise, in cone cell bodies, suppression of mitochondrial Ca2+ accumulation by anti/oligomycin caused a decrease in the amplitude of intracellular Ca2+ transients from 1047 ±140 nM to 299 ± 55 nM (Fig. 5A). Similar results were observed for rod perikarya (Fig. 5B).
Fig. 5.

Mitochondria and ER modulate the amplitude of depolarization-evoked [Ca2+]i elevations in rods and cones. (A) Cones. The effect of antimycin (10 μM)/oligomycin (10 μM)and thapsigargin (1 μM)on [Ca2+]i transients evoked by 30 mM KCl. [B = baseline [Ca2+]i; KCl = [Ca2+]i elevation in 30 mM KCl] Left panel: Antimycin/oligomycin [“A”] elevated baseline [Ca2+]i (P < 0.05) and suppressed KCl-evoked Ca2+ transients (P < 0.05) in the isolated cone ellipsoid Central panel: [Ca2+]i baseline and depolarization-evoked Ca2+ transients in the intact ellipsoid. Antimycin/oligomycin suppressed the amplitude of KCl-evoked [Ca2+]i responses (P < 0.001). Thapsigargin [“A + TG”] had little additional effect. Right panel: Antimycin/oligomycin suppressed the amplitude of KCl-evoked [Ca2+]i responses in the cell body (P < 0.001). Thapsigargin [“A+TG”] had little additional effect. (B) Rods. Left panel: Antimycin/oligomycin decreases the amplitude of KCl-evoked [Ca2+]i responses in the cell body (P < 0.05). Right panel: Exposure to antimycin/oligomycin reduces the depolarization-evoked Ca2+ transients in the cell body (not significant, P = 0.0501). Further reduction in the amplitude of cell body depolarization-evoked [Ca2+]i elevations occurs following thapsigargin (P < 0.05).
Because it is presently unclear whether Ca2+ entry into the ellipsoid occurs directly via native Ca2+ channels or indirectly via diffusion from the cell body, voltage-dependent Ca2+ entry was first determined in ellipsoids isolated from the cell body following an enzymatic dissociation protocol. Isolated ellipsoids had normal Ψmit, as measured by concomitant recordings from ellipsoids in intact cells and isolated ellipsoids (Fig. 3F; n = 7 pairs). Application of antimycin resulted in a statistically significant increase in baseline [Ca2+]i in the isolated ellipsoid (Fig. 6A; P < 0.05), consistent with suppressed Ca2+ sequestration into an ellipsoid Ca2+ sink. Next, isolated ellipsoids were depolarized with high KCl to stimulate Ca2+ entry via L-type voltage-operated Ca2+ channels (Szikra & Križaj, 2006). 30 mM KCl evoked a 356 ± 42 nM increase in [Ca2+]i (n = 9). Following exposure to antimycin/oligomycin, isolated ellipsoid responses to depolarization were reduced by ~60% to 119 ± 6 nM elevation in free [Ca2+] (Figs. 5A and 6B). Similar results were observed in 8/9 isolated ellipsoids recorded in depolarized antimycin/oligomycin-treated cells. No effect of antimycin/oligomycin was detected in one isolated ellipsoid. This data suggests that mitochondria modulate local Ca2+ entry into the cone ellipsoid.
Fig. 6.
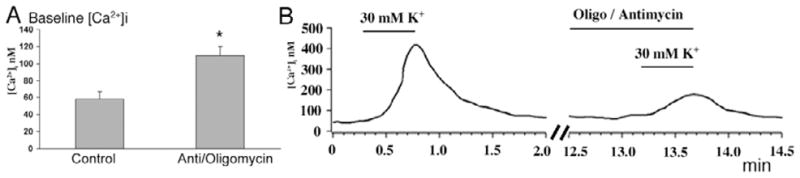
(A) Baseline [Ca2+]i in the isolated ellipsoid is elevated following exposure to antimycin/oligomycin. (B) Elimination of Ψmit causes a decrease in the amplitude of depolarization-evoked [Ca2+]i increases in the isolated cone ellipsoid. Left panel: control response of an isolated ellipsoid to 30 mM KCl. Right panel: the depolarization-evoked [Ca2+]i response following superfusion with antimycin/oligomycin.
The time constants of [Ca2+]i decay in cones were typically about 50% faster compared to rods (Fig. 7C, 7D), consistent with higher rates of Ca2+ extrusion in cone ISs (Križaj & Copenhagen, 1998). Exposure to antimycin/oligomycin prolonged the decay time constants in cones but had little effect on rods: in intact cone ellipsoids, the [Ca2+]i decay time constants in antimycin/oligomycin were 44 ±4 s, increased from 24 ±4 s in control saline (n = 10); in rod ellipsoids the time constants were 43 ±12 s in control saline and 53 ±17 s in antimycin/oligomycin. These results suggest that mitochondrial Ca2+ sequestration plays a more significant role in cytosolic clearance of Ca2+ in cones compared to rods. In the presence of antimycin/oligomycin [Ca2+]i rise times at the onset of depolarization slowed about 7-fold for cone cell bodies (from 59 ± 12 nM s in controls to 8 ± 3 nM/s). Similar decrease in rise-time kinetics was observed in intact rod and cone ellipsoids (Fig. 7A).
We next studied how much Ca2+ is stored into the ER of cells with dysfunctional mitochondrial Ca2+ accumulation. Consistent with the results in intact cells (Fig. 2), depolarization-evoked [Ca2+]i elevations in antimycin-treated rod cell bodies, but not ellipsoids, were decreased by the irreversible SERCA antagonist thapsigargin (to 53 ±6% and 92 ±10%, respectively; Figs. 5, 8A, 8C). Thapsigargin also slowed [Ca2+]i rise times (from 27 ± 8 nM/s to 9 ± 2 nM/s, a three-fold decrease) in perikarya of antimycin-treated rods, suggesting that Ca2+ release from the ER regulates the kinetics of depolarization-evoked Ca2+signals in this compartment (Fig. 7B). In contrast, decay time constants of rod responses in antimycin/oligomycin were not significantly changed by the additional exposure to thapsigargin (Fig. 7D). Note that the Ca2+ ionophore induced little release of Ca2+ in the Ca2+-free saline (Fig. 8A), indicating that internal Ca2+ stores in this cell were depleted following exposure to antimycin/oligomycin and thapsigargin.
Fig. 8.

Rod photoreceptor. The amplitude of KCl-evoked transients in cells with depleted mitochondrial stores is further reduced following exposure to thapsigargin (1 μM). (A) High K+ (30 mM)-triggered [Ca2+]i elevation in the rod cell body (continuous trace) and ellipsoid (dotted trace) in the presence of antimycin/oligomycin. Thapsigargin caused a significant decrease in the amplitude of cell body responses and moderate decreases in the ellipsoid. Little additional Ca2+ release occurs following addition of the Ca2+ ionophore ionomycin in Ca2+-free saline, indicating Ca2+stores were depleted in this cell. (B)Cones. The amplitude of depolarization-evoked [Ca2+] responses in cone ellipsoids and cell bodies in antimycin/oligomycin + thapsigargin as a percentage of control (i.e., antimycin/oligomycin-treated cones). (C) Rods. The amplitude of depolarization-evoked [Ca2+] responses in rod ellipsoids and cell bodies in antimycin/oligomycin + thapsigargin as a percentage of control (i.e. antimycin/oligomycin-treated rods).
The effects of thapsigargin on the kinetics of [Ca2+]i rise times and decay time constants were less pronounced in cones than in rods. A moderate increase in rise times and decay time constants in cone perikarya, but not ellipsoids, was observed (Figs. 7A, 7C). However, exposure to thapsigargin did trigger an additional decrease in the amount of Ca2+ accumulated in intracellular stores in the cell body and the ellipsoid (Fig. 4) and a moderate decrease in the amplitude of depolarization-evoked [Ca2+]i (69 ±7% decrease in the cell body and 77 ± 9% decrease in ellipsoids; Fig. 8B).
Taken together, this data suggests that both amplitude and kinetics of depolarization-evoked [Ca2+]i signals in rod and cone photoreceptors are modulated by the ER and mitochondria in a region-delimited manner.
Discussion
The present investigation was aimed at clarifying the importance of intracellular organelles in photoreceptor IS Ca2+ homeostasis. Optical imaging was used to study the role of CICR in amplification of [Ca2+]i during sustained depolarization and to determine the role of mitochondrial Ca2+ sequestration in photoreceptor compartments in naïve and depolarized cells.
Calcium stores and the spatiotemporal Ca2+ gradient within photoreceptor regions
The IS contains the highest amounts of intracellular Ca2+ in amphibian photoreceptors with foci of high [Ca2+]i in presumed cisternae of smooth ER (Ungar et al., 1981, 1984; Somlyo & Walz, 1985). The data presented here confirms that ER stores significant amounts of free Ca2+. SERCA antagonists CPA and thapsigargin reduced the magnitude of depolarization-evoked [Ca2+]i elevations in the cell body by ~40%, while significantly lower (~10–20%) [Ca2+]i reductions were detected in the ellipsoid. Consistent with this, CICR and Ca2+ sequestration into the ER enhanced the kinetics of perikaryal, but not ellipsoid, depolarization-evoked Ca2+ signaling. As shown before (Križaj et al., 2003), the contribution of the ER to kinetics of photoreceptor [Ca2+]i responses is more prominent in rods than in cones, possibly reflecting the cell type-specific distribution pattern of ER cisternae (Mercurio & Holtzman, 1982) and expression of SERCA2 transporters, ryanodine and InsP3 receptors (Križaj et al., 2004) in rods and cones.
A previous study showed that Ca2+ sequestration into the endoplasmic reticulum represents a fraction of total accumulated [Ca2+]i (Fig. 10 in Križaj et al., 2003), suggesting that the majority of stored Ca2+ is sequestered in another type of Ca2+ store. Our data suggests that this intracellular Ca2+ pool is localized to mitochondria. Photoreceptors lost about two-third of accumulated free [Ca2+]i following collapse of the inner mitochondrial membrane potential. In both in rods and cones the expression and function of ER and mitochondrial store appear to be qualitatively similar—the ER regulates cell body [Ca2+]i whereas the mitochondria dominate ellipsoid Ca2+ signaling. In cell bodies with blocked mitochondrial Ca2+ uptake, the ER accounted for about half of the releasable intracellular Ca2+. The size of this ER Ca2+ pool was markedly lower than the releasable caffeine-sensitive Ca2+ pool in control cells with un-blocked mitochondria, consistent with pronounced ER-mitochondrial interactions in the IS (Križaj et al., 2003). Decreases in the amount of Ca2+accumulated into internal stores were correlated with a several-fold decrease in rise times of depolarization-evoked [Ca2+]i signals. This effect could result from direct inhibition of calcium channels by antimycin; it could reflect a change in cells’ metabolism and/or mitochondrial modulation of Ca2+ channel inactivation/phosphorylation. Oligomycin, the inhibitor of F0/F1 synthase, alone had no effect on depolarization-evoked [Ca2+]i changes in the ellipsoid, suggesting that these were not mediated by reversed activation of the F0/F1 synthase. In addition to suppressing depolarization-evoked [Ca2+]i responses, antimycin also increased the baseline [Ca2+]i (Fig. 5C). We have not directly ascertained whether antimycin modulates the Ca2+ channel itself. However, our data shows that antimycin consistently elevates [Ca2+]i in isolated ellipsoids (Fig. 6). Previous reports on chromaffin cells suggested that elevated baseline [Ca2+]i caused by suppression of mitochondrial Ca2+ accumulation indirectly inhibits of L-type, N-type and P/Q type currents through an inactivation mechanism (Hernandez-Guijo et al., 2001). Whether suppression of voltage-operated Ca2+ entry by inhibition of mitochondrial Ca2+ sequestration (Fig. 5D; see also Medler & Gleason, 2002; Hernandez-Guijo et al., 2001) occurred as a result of inactivation of Ca2+ entry by subplasmalemmal [Ca2+]i (Budd & Nicholls, 1996; Hoth et al., 2000; Montero et al., 2000; Hernandez-Guijo et al., 2001) or another mechanism, remains to be determined. The effects of mitochondrial blockers were relatively stronger in cones than rods, possibly reflecting a difference in the density and/or structure of the mitochondria.
It could be anticipated that CICR and mitochondrial Ca2+ uptake are independent due to the anatomical segregation of ER and mitochondrial stores. However, this prediction was not borne out by our data. First, exposure to the ryanodine receptor agonist caffeine increased ellipsoid [Ca2+]i even though this region is devoid of ER cisternae or ryanodine receptors (Figs. 1A & 1B). [Ca2+]i increases observed for caffeine-evoked responses in depolarized rod ellipsoids followed changes in cell body with a delay of several seconds (Fig. 1B). Depolarization-evoked [Ca2+]i increases in ellipsoids dissociated from the cell body were always significantly smaller compared to the intact cell. In addition to possible diffusion from the cell body (e.g., Szikra & Križaj, 2006), slow [Ca2+]i increases in the ellipsoid might also be caused by a limited amount of smooth ER extending from the subellipsoid space, or result from a steady Ca2+ release mechanism that builds up in time following exposure to caffeine such as store-operated/TRPC channels recently identified in salamander photoreceptors (Szikra et al., 2006). Second, although mitochondria are absent from the soma, exposure to antimycin decreased the ER store Ca2+ content in the cell body region, suggesting that Ca2+ exchange between the ER and mitochondria contributes to the refilling of the ER store (e.g., Landolfi et al., 1998; Rizzuto et al., 2004). Taken together, this data suggests that Ca2+ stores in photoreceptors are not independent of each other.
Ca2+store blockers had little effect on Ca2+clearance from the cytosol in rods, suggesting neither mitochondria nor the ER modulate Ca2+ extrusion. Modest increases in [Ca2+]i decay time constants were detected for cone cell bodies and ellipsoids in the presence of SERCA blockade and mitochondrial electron chain inhibition, respectively (Fig. 6).
The blockade of the electromotive force is not associated with ATP depletion
Several lines of evidence suggest that ATP levels were not depleted in antimycin-treated cells. Baseline [Ca2+]i in the photoreceptor IS is maintained by PMCA pumps with a minor contribution from SERCAs (Križaj et al., 2003). Blockade of high-affinity PMCA-mediated transport with calmodulin antagonists was associated with large increases in the [Ca2+]i baseline (Križaj & Copenhagen, 1998). No such changes in baseline [Ca2+]i were observed in intact ISs following exposure to antimycin/oligomycin. We propose that this was due, in part, by upregulated glycolytic arm of energy metabolism in the IS. To compensate for the loss of aerobic metabolism following antimycin-mediated blockade, the glucose concentration in the extracellular saline was doubled to 20 mM, sufficient to maintain IS ATPase function (e.g., Fig. 4; Fliesler et al., 1997). Potential reversal of F1/F0 ATP synthase during loss of the electromotive force across the inner mitochondrial membrane was addressed by adding oligomycin to all antimycin-containing solutions (White & Reynolds, 1996; Scotti et al., 1999). In the presence of oligomycin, the neuronal ATP/ADP ratio is maintained close to normal (Budd & Nicholls, 1996). We conclude that glycolytic upregulation in antimycin-treated cells maintains normal photoreceptor ATP content (see also Winkler, 1975, 1983; Haugh-Scheidt et al., 1995; Fliesler et al., 1997; Winkler et al., 2003).
Functional significance of the region-specific expression of photoreceptor Ca2+ stores
Unlike invertebrate photoreceptors, in which Ca2+stores are known to undergo dramatic changes during illumination (Walz & Baumann, 1995), functional roles of Ca2+stores in vertebrate rods and cones are relatively unknown. Recent studies implicated ER stores as having an essential role in rod neurotransmission (Križaj et al., 1999; Suryanarayanan & Slaughter, 2006). Other studies showed that both Ca2+ handling by ER and mitochondria regulates a number of essential cellular functions, including apoptosis (Mattson & Chan, 2003; Hajnoczky et al., 2003).
The action of CICR is limited to the cell body (present study) and the synaptic terminal (Križaj et al., 1999; Cadetti et al., 2006). This is consistent with localization of voltage-operated Ca2+ channels and smooth ER required to operate the CICR positive feedback (Mercurio & Holtzman, 1982; Nachman-Clewner et al., 1999). CICR-mediated amplification of [Ca2+]i was observed during sustained depolarizations (Figs. 2 and 8) consistent with the observation that CICR plays a major role in depolarized photoreceptors responding to dim flashes (Suryanarayanan & Slaughter, 2006). Because SERCA transporter have a higher Ca2+ affinity compared to the mitochondrial uniporters (~0.7 versus >1.0 μM) (Berridge et al., 2003; Martin et al., 2002; Verkhratsky, 2005), ER stores are likely to play a proportionately larger role in light-adapted conditions when steady-state [Ca2+]i is low. In addition to the exocytotic apparatus (Cadetti et al., 2006), another candidate target for Ca2+ released from perikaryal Ca2+ stores may be the nuclear transcriptional apparatus. We occasionally observe elevated [Ca2+] levels in the cell nucleus while the cytosol surrounding the nuclear envelope had low levels of Ca2+ (data not shown), suggesting Ca2+ release from ryanodine and InsP3 receptors localized to the envelope ER could influence gene expression in photoreceptors.
The strategic localization of mitochondria to the ellipsoid suggests that Ca2+ sequestration acts as a large-capacity Ca2+ sink that shields phototransduction cascades of the outer segment from Ca2+ fluxes within the inner segment. Similar physiological role for mitochondrial buffering was reported in pancreatic acinar cells; clusters of mitochondria at the secretory pole of these cells form an immobile buffering system that prevents the spread of Ca2+ signal from primary Ca2+ release sites to the rest of the cell (Tinel et al., 1999). In photoreceptors, Ca2+ accumulation into mitochondria regulates the activity of the neuronal nitric oxide synthase (Cao & Eldred, 2001) and upregulates ATP production in the darkness (Kimble et al., 1980; Haugh-Scheidt et al., 1995), possibly through activation of rate-limiting Ca2+-dependent dehydrogenases of the Krebs cycle (Jouaville et al., 1999; Rizzuto et al., 2004). Our results might be useful to researchers interested in the physiological basis of photoreceptor degeneration, as pathological Ca2+ regulation in ER and mitochondria was suggested to regulate photoreceptor apoptosis and transmitter release (Cooper et al., 2002; He et al., 2000).
In conclusion, we quantified the contribution of intracellular organelles to photoreceptor [Ca2+]iIS. Our data shows that the ER and mitochondria accumulate hundreds of nM of releasable Ca2+ with which they control the amplitude and kinetics of [Ca2+]i in hyperpolarized and depolarized rods and cones. Ca2+ stores represent a central hub for IS Ca2+ homeostasis as they interact with each other, as well as with plasma membrane Ca2+ entry and extrusion. Hence, sequestration and release of Ca2+ into intracellular compartments may directly modulate many, if not all, signaling pathways within the photoreceptor IS.
Acknowledgments
This work was supported by a grant from the Hungarian Eötvös Fellowship and The Knights Templar Foundation to T.S., by the National Institutes of Health (EY13870) and That Man May See Foundation to D.K. and an unrestricted grant from Research to Prevent Blindness to the UCSF Depts. of Ophthalmology. D.K. is a Research to Prevent Blindness James S. Adams Scholar. We acknowledge helpful discussions with Dr. Karen Cusato.
References
- Almers W, Neher E. The Ca signal from fura-2 loaded mast cells depends strongly on the method of dye-loading. FEBS Lett. 1985;192:13–18. doi: 10.1016/0014-5793(85)80033-8. [DOI] [PubMed] [Google Scholar]
- Babcock DF, Hille B. Mitochondrial oversight of cellular Ca2+ signaling. Current Opinions in Neurobiology. 1998;8:398–404. doi: 10.1016/s0959-4388(98)80067-6. [DOI] [PubMed] [Google Scholar]
- Bader CR, Bertrand D, Schwartz EA. Voltage-activated and calcium-activated currents studied in solitary rod inner segments from the salamander retina. Journal of Physiology. 1982;331:2532–2584. doi: 10.1113/jphysiol.1982.sp014372. [DOI] [PMC free article] [PubMed] [Google Scholar]
- Berridge MJ, Bootman MD, Roderick HL. Calcium signalling: Dynamics, homeostasis and remodelling. Nature Reviews Molecular Cell Biology. 2003;4:517–529. doi: 10.1038/nrm1155. [DOI] [PubMed] [Google Scholar]
- Budd SL, Nicholls DG. A reevaluation of the role of mitochondria in neuronal Ca2+ homeostasis. Journal of Neurochemistry. 1996;66:403–411. doi: 10.1046/j.1471-4159.1996.66010403.x. [DOI] [PubMed] [Google Scholar]
- Cadetti L, Bryson EJ, Ciccone CA, Rable K, Thoreson WB. Calcium-induced calcium release in rod photoreceptor terminal boosts synaptic transmission during maintained depolarization. European Journal of Neuroscience. 2006;23:2983–2990. doi: 10.1111/j.1460-9568.2006.04845.x. [DOI] [PMC free article] [PubMed] [Google Scholar]
- Cao L, Eldred WD. Subcellular localization of neuronal nitric oxide synthase in turtle retina: Electron immunocytochemistry. Visual Neuroscience. 2001;18:949–960. [PubMed] [Google Scholar]
- Chang GQ, Hao Y, Wong F. Apoptosis: Final common pathway of photoreceptor death in rd, rds, and rhodopsin mutant mice. Neuron. 1993;11:595–605. doi: 10.1016/0896-6273(93)90072-y. [DOI] [PubMed] [Google Scholar]
- Chiarini LB, Leal-Ferreira ML, de Freitas FG, Linden R. Changing sensitivity to cell death during development of retinal photoreceptors. Journal of Neuroscience Research. 2003;74:875–883. doi: 10.1002/jnr.10739. [DOI] [PubMed] [Google Scholar]
- Cooper LL, Hansen RM, Darras BT, Korson M, Dougherty FE, Shoffner JM, Fulton AB. Rod photoreceptor function in children with mitochondrial disorders. Archive of Ophthalmology. 2002;120:1055–1062. doi: 10.1001/archopht.120.8.1055. [DOI] [PubMed] [Google Scholar]
- Demaurex N, Lew DP, Krause KH. Cyclopiazonic acid depletes intracellular Ca2+ stores and activates an influx pathway for divalent cations in HL-60 cells. Journal of Biological Chemistry. 1992;267:2318–2324. [PubMed] [Google Scholar]
- Donovan M, Cotter TG. Caspase-independent photoreceptor apoptosis in vivo and differential expression of apoptotic protease activating factor-1 and caspase-3 during retinal development. Cell Death and Differentiation. 2002;9:1220–1231. doi: 10.1038/sj.cdd.4401105. [DOI] [PubMed] [Google Scholar]
- Doonan F, Donovan M, Cotter TG. Activation of multiple pathways during photoreceptor apoptosis in the rd mouse. Investigative Ophthalmology & Visual Science. 2005;46:3530–3538. doi: 10.1167/iovs.05-0248. [DOI] [PubMed] [Google Scholar]
- Duchen MR. Contributions of mitochondria to animal physiology: From homeostatic sensor to calcium signalling and cell death. Journal of Physiology. 1999;516:1–17. doi: 10.1111/j.1469-7793.1999.001aa.x. [DOI] [PMC free article] [PubMed] [Google Scholar]
- Fain GL, Matthews HR, Cornwall MC, Koutalos Y. Adaptation in vertegrate photoreceptors. Physiological Reviews. 2001;81:117–151. doi: 10.1152/physrev.2001.81.1.117. [DOI] [PubMed] [Google Scholar]
- Fliesler SJ, Richards MJ, Miller CY, Mckay S, Winkler BS. In vitro metabolic competence of the frog retina: Effects of glucose and oxygen deprivation. Experimental Eye Research. 1997;64:683–692. doi: 10.1006/exer.1996.0281. [DOI] [PubMed] [Google Scholar]
- Hajnoczky G, Davies E, Madesh M. Calcium signaling and apoptosis. Biochemical and Biophysical Research Communications. 2003;304:445–454. doi: 10.1016/s0006-291x(03)00616-8. [DOI] [PubMed] [Google Scholar]
- Haugh-Scheidt LM, Linsenmeier RA, Griff ER. Oxygen consumption in the isolated toad retina. Experimental Eye Research. 1995;61:63–72. doi: 10.1016/s0014-4835(95)80059-x. [DOI] [PubMed] [Google Scholar]
- He L, Poblenz AT, Medrano CJ, Fox DA. Lead and calcium produce rod photoreceptor cell apoptosis by opening the mitochondrial permeability transition pore. Journal of Biological Chemistry. 2000;275:12175–12184. doi: 10.1074/jbc.275.16.12175. [DOI] [PubMed] [Google Scholar]
- Heidelberger R, Thoreson WB, Witkovsky P. Synaptic transmission at retinal ribbon synapses. Progress in Retinal Eye Research. 2005;24:682–720. doi: 10.1016/j.preteyeres.2005.04.002. [DOI] [PMC free article] [PubMed] [Google Scholar]
- Hernandez-Guijo JM, Maneu-Flores VE, Ruiz-Nuno A, Villarroya M, Garcia AG, Gandia L. Calcium-dependent inhibition of L, N, and P/Q Ca2+ channels in chromaffin cells: Role of mitochondria. Journal of Neuroscience. 2001;21:2553–25560. doi: 10.1523/JNEUROSCI.21-08-02553.2001. [DOI] [PMC free article] [PubMed] [Google Scholar]
- Hoang QV, Linsenmeier RA, Chung CK, Curcio CA. Photoreceptor inner segments in monkey and human retina: Mitochondrial density, optics, and regional variation. Visual Neuroscience. 2002;19:395–407. doi: 10.1017/s0952523802194028. [DOI] [PubMed] [Google Scholar]
- Hoth M, Button DC, Lewis RS. Mitochondrial control of calcium-channels gating: A mechanism for sustained signaling and transcriptional activation in T lymphocytes. Proceedings of the National Academy of Sciences United States of America. 2000;97:10607–10612. doi: 10.1073/pnas.180143997. [DOI] [PMC free article] [PubMed] [Google Scholar]
- Inesi G, Sagara Y. Specific inhibitors of intracellular Ca2+ transport ATPases. Journal of Membrane Biology. 1994;141:1–6. doi: 10.1007/BF00232868. [DOI] [PubMed] [Google Scholar]
- Jouaville LS, Pinton P, Bastianutto C, ogyutter GA, Rizzuto R. Regulation of mitochondrial ATP synthesis by calcium: Evidence for a long-term metabolic priming. Proceedings of the National Academy of Sciences United States of America. 1999;96:13807–13812. doi: 10.1073/pnas.96.24.13807. [DOI] [PMC free article] [PubMed] [Google Scholar]
- Kimble EA, Svoboda RA, Ostroy SE. Oxygen consumption and ATP changes of the vertebrate photoreceptor. Experimental Eye Research. 1980;31:271–288. doi: 10.1016/s0014-4835(80)80037-6. [DOI] [PubMed] [Google Scholar]
- Križaj D, Bao JX, Schmitz Y, Witkovsky P, Copenhagen DR. Caffeine-sensitive calcium stores regulate synaptic transmission from retinal rod photoreceptors. Journal of Neuroscience. 1999;19:7249–7261. doi: 10.1523/JNEUROSCI.19-17-07249.1999. [DOI] [PMC free article] [PubMed] [Google Scholar]
- Križaj D, Copenhagen DR. Compartmentalization of calcium extrusion mechanisms in the outer and inner segments of photoreceptors. Neuron. 1998;21:249–256. doi: 10.1016/s0896-6273(00)80531-0. [DOI] [PMC free article] [PubMed] [Google Scholar]
- Križaj D, Copenhagen DR. Calcium regulation in photoreceptors. Front Bioscience. 2002;7:d2023–d2044. doi: 10.2741/a896. [DOI] [PMC free article] [PubMed] [Google Scholar]
- Križaj D, Lai FA, Copenhagen DR. Ryanodine stores and calcium regulation in the inner segments of salamander rods and cones. Journal of Physiology. 2003;547:761–774. doi: 10.1113/jphysiol.2002.035683. [DOI] [PMC free article] [PubMed] [Google Scholar]
- Križaj D, Liu XL, Copenhagen DR. Expression of calcium transporters in the retina of the tiger salamander (Ambystoma tigrinum) Journal of Comparative Neurology. 2004;475:463–480. doi: 10.1002/cne.20170. [DOI] [PMC free article] [PubMed] [Google Scholar]
- Landolfi B, Curci S, Debellis L, Pozzan T, Hofer AM. Ca2+ homeostasis in the agonist-sensitive internal store: Functional interactions between mitochondria and the ER measured In situ in intact cells. Journal of Cell Biology. 1998;142:1235–1243. doi: 10.1083/jcb.142.5.1235. [DOI] [PMC free article] [PubMed] [Google Scholar]
- Mariani AP. Photoreceptors of the salamander retina. Journal of Comparative Neurology. 1986;247:497–504. [Google Scholar]
- Martin V, Bredoux R, Corvazier E, Van Gorp R, Kovàcs T, Gélébart P, Enouf J. Three novel sarco/endoplasmic reticulum Ca2+ATPase (SERCA) 3 isoforms. Expression, regulation and function of the members of the SERCA3 family. Journal of Biological Chemistry. 2002;277:24442–24452. doi: 10.1074/jbc.M202011200. [DOI] [PubMed] [Google Scholar]
- Mattson MP, Chan SL. Calcium orchestrates apoptosis. Natural Cell Biology. 2003;5:1041–1043. doi: 10.1038/ncb1203-1041. [DOI] [PubMed] [Google Scholar]
- Medler K, Gleason EL. Mitochondrial Ca(2+) buffering regulates synaptic transmission between retinal amacrine cells. Journal of Neurophysiology. 2002;87:1426–1439. doi: 10.1152/jn.00627.2001. [DOI] [PubMed] [Google Scholar]
- Mercurio AM, Holtzman E. Smooth endoplasmic reticulum and other agranular reticulum in frog retinal photoreceptors. Journal of Neurocytology. 1982;11:263–293. doi: 10.1007/BF01258247. [DOI] [PubMed] [Google Scholar]
- Montero M, Alonso MT, Carnicero E, Cuchillo-Ibanez I, Albillos A, Garcia AG, Garcia-Sancho J, Alvarez J. Chromaffin-cell stimulation triggers fast milimolar mitochondrial Ca2+ transients that modulate secretion. Nature Cell Biology. 2000;2:57–61. doi: 10.1038/35000001. [DOI] [PubMed] [Google Scholar]
- Nachman-Clewner M, St Jules R, Townes-Anderson E. L-type calcium channels in the photoreceptor ribbon synapse: Localization and role in plasticity. Journal of Comparative Neurology. 1999;415:1–16. [PubMed] [Google Scholar]
- Neher E. The use of fura-2 for estimating Ca buffers and Ca fluxes. Neuropharmacology. 1995;34:1423–1442. doi: 10.1016/0028-3908(95)00144-u. [DOI] [PubMed] [Google Scholar]
- Nilsson SE. The retinal photoreceptors and the pigment epithelium. Structure and function. Transduction. Acta Ophthalmology Supplemental. 1985;173:4–8. doi: 10.1111/j.1755-3768.1985.tb06826.x. [DOI] [PubMed] [Google Scholar]
- Pendergrass W, Wolf N, Poot M. Efficacy of mitotracker green and CMX rosamine to measure changes in mitochondrial membrane potentials in living cells and tissues. Cytometry. 2004;61:162–169. doi: 10.1002/cyto.a.20033. [DOI] [PubMed] [Google Scholar]
- Rieke F, Schwartz EA. A cGMP-gated current can control exocytosis at cone synapses. Neuron. 1994;13:863–873. doi: 10.1016/0896-6273(94)90252-6. [DOI] [PubMed] [Google Scholar]
- Rieke F, Schwartz EA. Asynchronous transmitter release: Control of exocytosis and endocytosis at the salamander rod synapse. Journal of Physiology. 1996;493:1–8. doi: 10.1113/jphysiol.1996.sp021360. [DOI] [PMC free article] [PubMed] [Google Scholar]
- Rizzuto R, Duchen MR, Pozzan T. Flirting in little space: The ER/mitochondria Ca2+ liaison. Signal Transduction Knowledge Environment. 2004;215:re1. doi: 10.1126/stke.2152004re1. [DOI] [PubMed] [Google Scholar]
- Scaduto RC, Grotyohann LW. Measurement of mitochondrial membrane potential using fluorescent rhodamine derivatives. Biophysics Journal. 1999;76:469–477. doi: 10.1016/S0006-3495(99)77214-0. [DOI] [PMC free article] [PubMed] [Google Scholar]
- Scotti AL, Chatton JY, Reuter H. Roles of Na(+)-Ca2+ exchange and of mitochondria in the regulation of presynaptic Ca2+ and spontaneous glutamate release. Philosophical Transactions of the Royal Society of London. 1999;354:357–364. doi: 10.1098/rstb.1999.0387. [DOI] [PMC free article] [PubMed] [Google Scholar]
- Somlyo AP, Walz B. Elemental distribution in Rana pipiens retinal rods: Quantitative electron probe study. Journal of Physiology. 1985;358:183–195. doi: 10.1113/jphysiol.1985.sp015547. [DOI] [PMC free article] [PubMed] [Google Scholar]
- Steele EC, Chen X, Iuvone PM, MacLeish PR. Imaging of Ca2+ dynamics within the presynaptic terminals of salamander rod photoreceptors. Journal of Neurophysiology. 2005;94:4544–4553. doi: 10.1152/jn.01193.2004. [DOI] [PubMed] [Google Scholar]
- Suryanarayanan A, Slaughter MM. Synaptic transmission mediated by internal calcium stores in rod photoreceptors. Journal of Neuroscience. 2006;26:1759–1766. doi: 10.1523/JNEUROSCI.3895-05.2006. [DOI] [PMC free article] [PubMed] [Google Scholar]
- Szikra T, Cusato K, Križaj D. Store-operated channels regulate baseline Ca in light-adapted photoreceptors. Investigative Ophthalmology & Visual Science. 2006;47:3715a. [Google Scholar]
- Szikra T, Križaj D. The dynamic range and domain-specific signals of intracellular calcium in photoreceptors. Neuroscience. 2006;141:143–155. doi: 10.1016/j.neuroscience.2006.03.054. [DOI] [PMC free article] [PubMed] [Google Scholar]
- Tinel H, Cancela JM, Mogami H, Gerasimenko JV, Gerasimenko OV, Tepikin AV, Petersen OH. Active mitochondria surronding the pancreatic acinar granule region prevent spreading of inositol triphosphate-evoked local cytosolic Ca(2+) signals. The European Molecular Biology Organization Journal. 1999;18:4999–5008. doi: 10.1093/emboj/18.18.4999. [DOI] [PMC free article] [PubMed] [Google Scholar]
- Townes-Anderson E, MacLeish PR, Raviola E. Rod cells dissociated from mature salamander retina: Ultrastructure and uptake of horseradish peroxidase. Journal of Cell Biology. 1985;100:175–188. doi: 10.1083/jcb.100.1.175. [DOI] [PMC free article] [PubMed] [Google Scholar]
- Treiman M, Caspersen C, Christensen SB. A tool coming of age: Thapsigargin as an inhibitor of sarco-endoplasmic reticulum Ca(2+)-ATPases. Trends in Pharmacological Sciences. 1998;19:131–135. doi: 10.1016/s0165-6147(98)01184-5. [DOI] [PubMed] [Google Scholar]
- Ungar F, Piscopo I, Holtzman E. Calcium accumulation in intracellular compartments of from retinal rod photoreceptors. Brain Research. 1981;205:200–206. doi: 10.1016/0006-8993(81)90733-2. [DOI] [PubMed] [Google Scholar]
- Ungar F, Piscopo I, Letizia J, Holtzman E. Uptake of calcium by the endoplasmic reticulum of frog the frog photoreceptor. Journal of Cell Biology. 1984;98:1645–1655. doi: 10.1083/jcb.98.5.1645. [DOI] [PMC free article] [PubMed] [Google Scholar]
- Uyama Y, Imaizumi Y, Watanabe M. Effects of cyclopiazonic acid, a novel Ca(2+) ATPase inhibitor, on contractile responses in skinned ileal smooth muscle. British Journal of Pharmacology. 1992;106:208–214. doi: 10.1111/j.1476-5381.1992.tb14316.x. [DOI] [PMC free article] [PubMed] [Google Scholar]
- Verkhratsky A. Physiology and pathophysiology of the calcium store in the endoplasmic reticulum of neurons. Physiological Reviews. 2005;85:201–279. doi: 10.1152/physrev.00004.2004. [DOI] [PubMed] [Google Scholar]
- Walz B, Baumann O. Structure and cellular physiology of Ca2+ stores in invertebrate photoreceptors. Cell Calcium. 1995;18:342–351. doi: 10.1016/0143-4160(95)90030-6. [DOI] [PubMed] [Google Scholar]
- White RJ, Reynolds IJ. Mitochondrial depolarization in glutamate-stimulated neurons: An early signal specific to excitotoxin exposure. Journal of Neuroscience. 1996;16:5688–5697. doi: 10.1523/JNEUROSCI.16-18-05688.1996. [DOI] [PMC free article] [PubMed] [Google Scholar]
- Winkler BS. Dependence of rat and rabbit photoreceptor potentials upon anaerobic and aerobic metabolism in vitro. Experimental Eye Research. 1975;21:545–548. doi: 10.1016/0014-4835(75)90036-6. [DOI] [PubMed] [Google Scholar]
- Winkler BS. Relative inhibitory effects of ATP depletion, ouabain and calcium on retinal photoreceptors. Experimental Eye Research. 1983;36:581–594. doi: 10.1016/0014-4835(83)90052-0. [DOI] [PubMed] [Google Scholar]
- Winkler BS, Sauer MW, Starnes CA. Modulation of the Pasteur effect in retinal cells: Implications for understanding compensatory metabolic mechanisms. Experimental Eye Research. 2003;76:715–723. doi: 10.1016/s0014-4835(03)00052-6. [DOI] [PubMed] [Google Scholar]
- Zhang N, Townes-Anderson E. Regulation of structural plasticity by different channel types in rod and cone photoreceptors. Journal of Neuroscience. 2002;22:7065–7079. doi: 10.1523/JNEUROSCI.22-16-07065.2002. [DOI] [PMC free article] [PubMed] [Google Scholar]